. 2023 Dec 19;9(1):1216-1229.
doi: 10.1021/acsomega.3c07453. eCollection 2024 Jan 9.

1,4-Diurea- and 1,4-Dithiourea-Substituted Aromatic Derivatives Selectively Inhibit α-Synuclein Oligomer Formation In Vitro

Affiliations

1,4-Diurea- and 1,4-Dithiourea-Substituted Aromatic Derivatives Selectively Inhibit α-Synuclein Oligomer Formation In Vitro

Susantha K Ganegamage et al. ACS Omega. .

Abstract

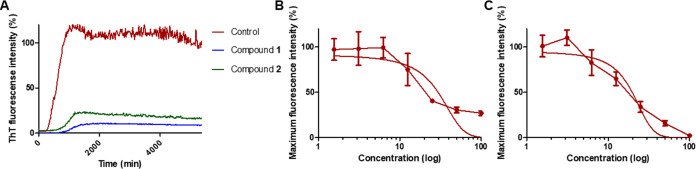
Parkinson's disease (PD) is the second most common neurodegenerative disease, affecting the elderly population worldwide. In PD, the misfolding of α-synuclein (α-syn) results in the formation of inclusions referred to as Lewy bodies (LB) in midbrain neurons of the substantia nigra and other specific brain localizations, which is associated with neurodegeneration. There are no approved strategies to reduce the formation of LB in the neurons of patients with PD. Our drug discovery program focuses on the synthesis of urea and thiourea compounds coupled with aminoindole moieties to abrogate α-syn aggregation and to slow down the progression of PD. We synthesized several urea and thiourea analogues with a central 1,4-phenyl diurea/thiourea linkage and evaluated their effectiveness in reducing α-syn aggregation with a special focus on the selective inhibition of oligomer formation among other proteins. We utilized biophysical methods such as thioflavin T (ThT) fluorescence assays, transmission electron microscopy (TEM), photoinduced cross-linking of unmodified proteins (PICUP), as well as M17D intracellular inclusion cell-based assays to evaluate the antiaggregation properties and cellular protection of our best compounds. Our results identified compound 1 as the best compound in reducing α-syn fibril formation via ThT assays. The antioligomer formation of compound 1 was subsequently superseded by compound 2. Both compounds selectively curtailed the oligomer formation of α-syn but not tau 4R isoforms (0N4R, 2N4R) or p-tau (isoform 1N4R). Compounds 1 and 2 failed to abrogate tau 0N3R fibril formation by ThT and atomic force microscopy. Compound 2 was best at reducing the formation of recombinant α-syn fibrils by TEM. In contrast to compound 2, compound 1 reduced the formation of α-syn inclusions in M17D neuroblastoma cells in a dose-dependent manner. Compound 1 may provide molecular scaffolds for the optimization of symmetric molecules for its α-syn antiaggregation activity with potential therapeutic applications and development of small molecules in PD.


Conflict of interest statement

The authors declare no competing financial interest.

Figures

Figure 1
Figure 1
Aminoindoles inhibited α-syn oligomer formation by PICUP. α-Syn (60 μM) was cross-linked (PICUP assay) with DMSO (control) or the compound at 50 μM (∼molar ratio, 1:1). 4-, 5-, 6-Aminoindoles, but not the 2-(4-aminophenyl)benzothiazole, abrogated the formation of high molecular bands (i.e., oligomers) visible between 35 and 40 kDa. Coomassie blue-stained polyacrylamide gels showed high-molecular-weight α-syn oligomers with the control (0.125% DMSO). Additional controls consist of no light exposure and no cross-linking agent (no Ru(bpy)), which provided no cross-linked products.
Scheme 1
Scheme 1. Preparation of 1,4-Diurea (1, 3, 5, 7, 9) and 1,4-Dithiourea Compounds (2, 4, 6, 8, 10) Using the Relevant Aromatic (Ar) Amines (ae) and Diisocyanates (P) or Diisothiocynate (Q) to Generate the Final Products Presented in Table 1
Figure 2
Figure 2
Docking of analogue 2 (green color on left) and 1 (yellow color on right) and their binding locations on human α-syn protein (PDB ID: 1XQ8) within the active site (middle) with hydrogen bonding.
Figure 3
Figure 3
ThT kinetic curves (A) and dose-dependent reduction of α-synuclein (α-syn) fibrillation by compound 1 (B) and compound 2 (C). (A) Kinetic curves were achieved using 100 μM compounds 1 and 2. The control consisted of the vehicle (DMSO at 0.25%). (B, C) Dose-dependent curves resulted from incubations carried out with α-syn at 47 h with four concentrations (i.e., 12.5, 25, 50, and 100 μM) of the best α-syn antifibrillary compounds 1 and 2 of the diurea/dithiourea analogues. Triplicate data were collected from 10 consecutive time points at the plateau phase. For both experiments, α-syn was tested at 6 μM.
Figure 4
Figure 4
Kinetics of tau 0N3R fibril formation: comparison of compounds 1–2 and control (no compound) monitored using thioflavin T (ThT) fluorescence assays. Compounds were tested at a final concentration of 100 μM in the presence of 10 μM Tau 0N3R, 2.5 μM heparin, 1 mM dithiothreitol (DTT), 1 mM 4-(2-aminoethyl)benzenesulfonyl fluoride hydrochloride, and 30 μM ThT in a CHELEX-treated buffer consisting of 50 mM Tris, 25 mM NaCl, pH 7.4. The molar ratio of protein:compound was 1:10. The positive control consisted of Tau 0N3R without compound treatment. The background (BG) signal was obtained with all components in the absence of heparin.
Figure 5
Figure 5
Compounds 1 and 2 failed to reduce tau 0N3R fibril formation as validated by atomic force microscopy (AFM). Tau isoform 0N3R (10 μM) was incubated with no treatment, compound 1 (100 μM), or compound 2 (100 μM) for 47 h prior to AFM visualization (molar ratio 1:10). Images were collected at sizes of 10 × 10 μm2 and 3.33 × 3.33 μm2. Scale bars located at the bottom right corner are 1 μm.
Figure 6
Figure 6
Compounds 1, 2, and 8 reduced the level of α-syn oligomer formation by PICUP. α-Syn (60 μM) was cross-linked (PICUP assay) with DMSO (control) or compound at 50 μM (∼molar ratio, 1:1). Compounds 3, 4, 5, and 6 slightly reduced the formation of high molecular bands (i.e., oligomers). The pixel density of the high-molecular-weight bands labeled as oligomers and the low molecular bands identified as monomers have been quantified by image J. The relative pixel density (RPD) was obtained by dividing the pixel density of the higher molecular bands for each condition by their respective monomeric band.
Figure 7
Figure 7
Evidence of the dose-dependent inhibitory activity of compound 2 on α-syn oligomerization determined using the PICUP assay. The protein (30 μM) was incubated with compound 2: 50 μM (molar ratio 1:1.6), 30 μM (molar ratio 1:1), 15 μM (molar ratio 1:0.5), and 7.5 μM (molar ratio 1:0.25). The inhibition of α-syn oligomerization by compound 2 is dose-dependent. The control consisted of DMSO (0.125%).
Figure 8
Figure 8
1,4-Diurea- and dithiourea-substituted aromatic representatives failed to inhibit tau 0N4R oligomer formation by PICUP. Compounds 1 and 2 were selected for their α-syn antioligomerization activity. Tau 0N4R (6 μM) was cross-linked (PICUP assay) with the disubstituted aminoindolyl derivatives at 50 μM (∼molar ratio, 1:8).
Figure 9
Figure 9
Compounds 1 and 2 did not inhibit tau isoform 2N4R oligomer formation. Tau 2N4R (6 μM) was cross-linked (PICUP assay) with different compounds at 50 μM (∼molar ratio, 1:8). Coomassie blue-stained polyacrylamide gels showed high-molecular-weight tau oligomers with control (0.125% DMSO: lane 3) as well as compounds 1 and 2.
Figure 10
Figure 10
1,4-Diurea- and dithiourea-substituted aromatic representatives did not prevent p-tau 1N4R oligomer formation by PICUP. p-Tau isoform 1N4R (6 μM) was cross-linked (PICUP assay) with 50 μM compounds 1 and 2 (molar ratio ∼ 1:8).
Figure 11
Figure 11
Compound 1 and 2 treatments resulted in fewer and shorter α-synuclein (α-syn) fibrils by transmission electron microscopy (TEM). (A) α-Syn (2 μM) was incubated with DMSO (0.25%; ‘CTRL’); (B) α-Syn (2 μM) was treated with compound 1 at 100 μM; (C) α-Syn (2 μM) was subjected to compound 2 treatment at 100 μM. Incubation time was ∼ 22 h prior to TEM visualization. Scale bars = 200 nm.
Figure 12
Figure 12
CD spectra of α-syn incubated at different time points in the absence and presence of compounds. (A) CD spectra of α-syn are characteristic of unfolded, random coils with slight formation β-sheet at time 0 h and show conversion to α helix and additional β-sheet conformation at 48 h. (B, C) Treatment with 100 μM compounds 1 and 2 converted the protein to random coils with fewer β-sheet conformation at 48h. (D) Curcumin treatment did not demonstrate such structural changes.
Figure 13
Figure 13
Compounds 1 and 2 reduced the amount of α-syn α helix intermediate and β-sheet conformation after incubation of 48 h at 37 °C. (A) CD spectra of α-syn were incubated with 100 μM compound 1. (B) CD spectra of α-syn treated with 100 μM compound 2. Protein was tested at 12 μM in 10 mM PBS (pH 7.4) containing 300 mM NaCl and 0.5 mM SDS.
Figure 14
Figure 14
Compounds 1 and 2 disaggregate mature α-syn fibrils by ThT and TEM analyses. α-Syn was incubated at 37 °C at a concentration of 9.4 μM in 10 mM PBS (pH 7.4), supplemented with 0.5 mM SDS and 300 mM NaCl for 48 h prior to any assays to allow the formation of mature fibrils. (A) Subsequently, a ThT experiment was performed using standard procedure, i.e., 6 μM protein, 100 μM compounds (including 3–6 replicates). At 40 h, the relative fluorescence intensity values were averaged and data were plotted using GraphPad Prism. Statistical analyses were applied using the one-way ANOVA with Dunnett’s post hoc test; **, p < 0.01. (B) Samples were deposited on copper grids and analyzed by TEM. Representative pictures are shown herein. The scale at the bottom right corner is 200 nm.
Figure 15
Figure 15
Compound 1 prevents αS inclusion formation. M17D cells expressing the inclusion-prone αS-3K::YFP fusion protein (dox-inducible) were treated with 0.1% DMSO (vehicle; “0 μM”) as well as 1.25, 2.5, 5, and 10 μM compounds 1, 2, and 8 at t = 24 h after plating. Cells were induced with doxycycline at 48 h. (A) Incucyte-based analysis of punctate YFP signals relative to 0.1% DMSO was done at t = 96 h (N = 3) independent experiments, n = 6–18 individual wells total (0 μM, n = 18; 10 μM, n = 6; all other concentrations, n = 12). (B) Same as (A), but confluence fold changes relative to DMSO vehicle (0 μM) were plotted. (C) Representative IncuCyte images of reporter cells treated with vehicle versus 10 μM compounds 1, 2, or 8 (t = 96 h), green channel. Arrows indicate αS-rich YFP-positive inclusions. Scale bar, 50 μm. All data are presented as fold changes relative to DMSO control +/– standard deviation. One-way ANOVA, Dunnett’s post hoc test; *, p < 0.05; **, p < 0.01; ***, p < 0.0 01.

References

    1. Marras C.; Beck J. C.; Bower J. H.; Roberts E.; Ritz B.; Ross G. W.; Abbott R. D.; Savica R.; Van Den Eeden S. K.; Willis A. W.; Tanner C. Prevalence of Parkinson’s disease across North America. NPJ Parkinson’s Dis. 2018, 4, 21.10.1038/s41531-018-0058-0. - DOI - PMC - PubMed
    1. Shahmoradian S. H.; Lewis A. J.; Genoud C.; Hench J.; Moors T. E.; Navarro P. P.; Castano-Diez D.; Schweighauser G.; Graff-Meyer A.; Goldie K. N.; et al. Lewy pathology in Parkinson’s disease consists of crowded organelles and lipid membranes. Nat. Neurosci. 2019, 22 (7), 1099–1109. 10.1038/s41593-019-0423-2. - DOI - PubMed
    1. Cardinale A.; Calabrese V.; de Iure A.; Picconi B. Alpha-Synuclein as a Prominent Actor in the Inflammatory Synaptopathy of Parkinson’s Disease. Int. J. Mol. Sci. 2021, 22 (12), 651710.3390/ijms22126517. - DOI - PMC - PubMed
    1. Mahul-Mellier A. L.; Burtscher J.; Maharjan N.; Weerens L.; Croisier M.; Kuttler F.; Leleu M.; Knott G. W.; Lashuel H. A. The process of Lewy body formation, rather than simply alpha-synuclein fibrillization, is one of the major drivers of neurodegeneration. Proc. Natl. Acad. Sci. U.S.A. 2020, 117 (9), 4971–4982. 10.1073/pnas.1913904117. - DOI - PMC - PubMed
    1. Winner B.; Jappelli R.; Maji S. K.; Desplats P. A.; Boyer L.; Aigner S.; Hetzer C.; Loher T.; Vilar M.; Campioni S.; et al. In vivo demonstration that alpha-synuclein oligomers are toxic. Proc. Natl. Acad. Sci. U.S.A. 2011, 108 (10), 4194–4199. 10.1073/pnas.1100976108. - DOI - PMC - PubMed

LinkOut - more resources