. 2024 Jan 3;14(1):548-565.
doi: 10.21037/qims-23-1027. Epub 2023 Nov 7.

Treatment response assessment to chemotherapy with bevacizumab for colorectal liver metastasis by contrast-enhanced ultrasound

Affiliations

Treatment response assessment to chemotherapy with bevacizumab for colorectal liver metastasis by contrast-enhanced ultrasound

Wen-Qing Wu et al. Quant Imaging Med Surg. .

Abstract

Background: Though contrast-enhanced ultrasound (CEUS) perfusion parameters have been approved to be potential indicators for response to chemotherapy in solid tumors, their ability in assessment of colorectal liver metastasis (CRLM) to chemotherapy with bevacizumab (Bev) has rarely been investigated.

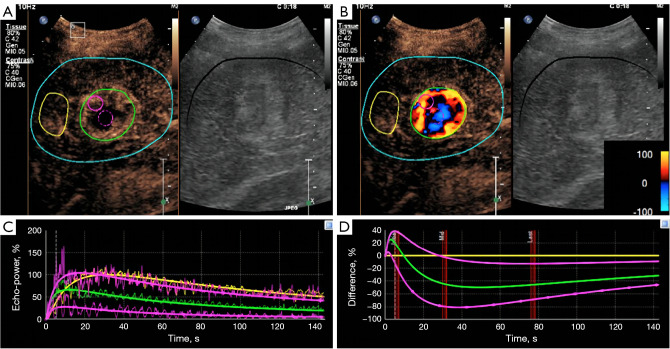
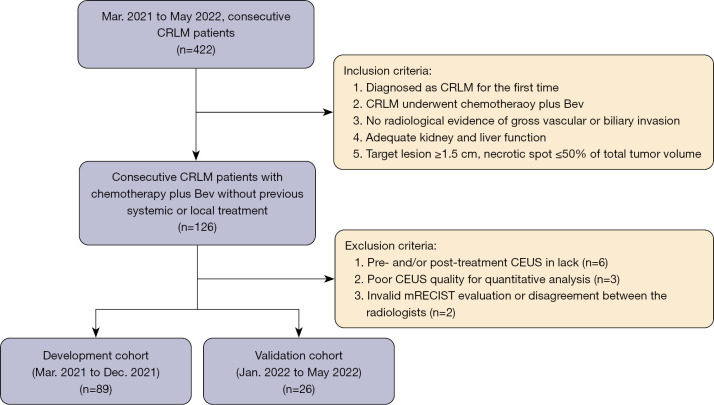
Methods: From March 2021 to May 2022, 115 consecutive CRLM patients with CEUS pre- and post-2 months' chemotherapy with Bev were prospectively enrolled. One target lesion per patient underwent CEUS quantitative analysis with SonoLiver software. Rise time, time-to-peak, mean transit time, maximal intensity (IMAX), and area under the time-intensity curve (AUC) were assessed with region of interest (ROI) selected on whole lesion, lesion periphery, and internal lesion, respectively. The reduction and ratio of post- to pre-treatment in parameters were investigated in development cohort (n=89) and validated in internal validation cohort (n=26) according to the chronological order.

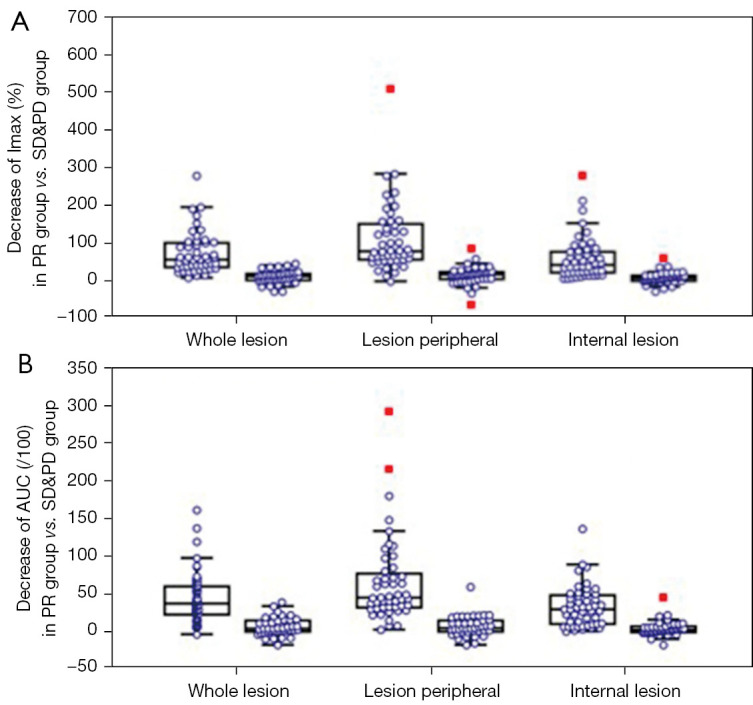
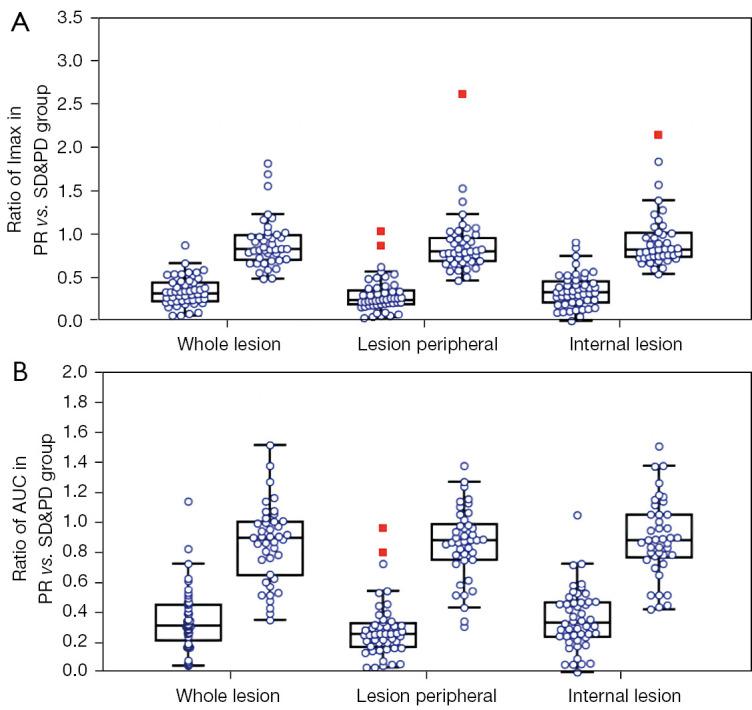
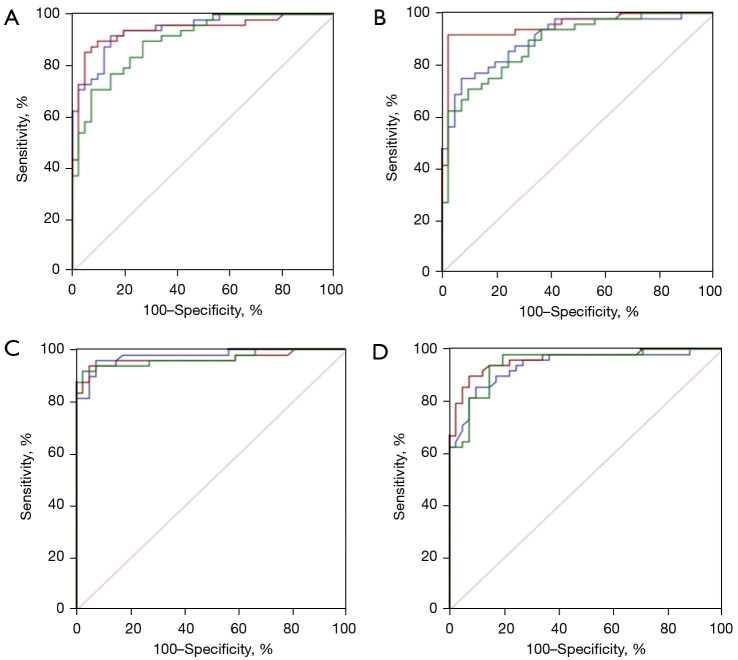
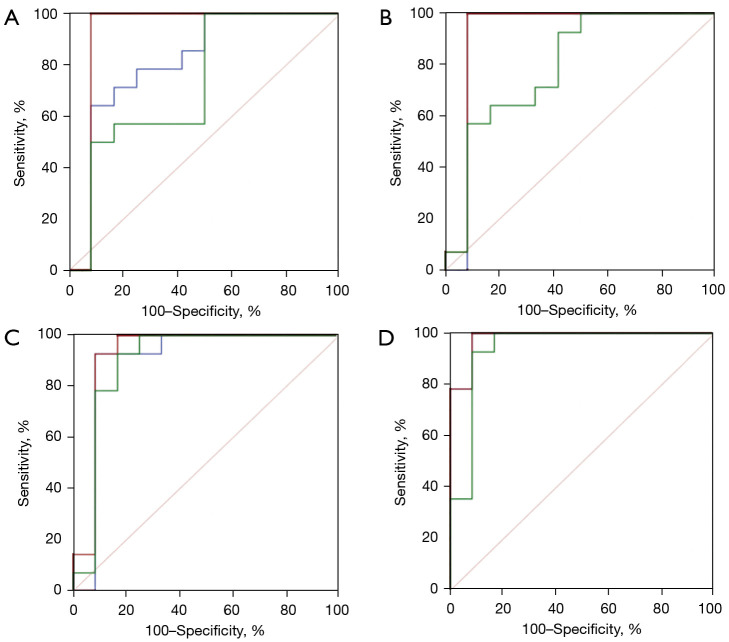
Results: With modified Response Evaluation Criteria in Solid Tumor as reference, 48, 14 responders and 41, 12 non-responders were included in development and validation cohort, respectively. Significantly smaller values of IMAX and AUC on ROIwhole, ROIperipheral, and ROIinternal, were observed post-treatment in development cohort (all P<0.05). In predicting treatment response, the influence of ROI selection was observed when using ∆IMAX and ∆AUC, while no influence was observed using ratios. Areas under the receiver operating characteristic curve (AUROCs) for ∆IMAX and ∆AUC on ROIperipheral were 0.939 (0.867-0.979), 0.951 (0.883-0.985), and 0.917 (0.740-0.988), 0.923 (0.748-0.990) in development and validation cohort, respectively. For ratios of IMAX and AUC, AUROCs were 0.976 (0.919-0.997), 0.938 (0.865-0.978), and 0.899 (0.717-0.982), 0.982 (0.836-1.000) in development and validation cohort, respectively.

Conclusions: IMAX and AUC showed significant reductions in responders, and different analyses ROIs influence the performance of ∆IMAX and ∆AUC in response assessment. Parameters derived from ROI peripheral exhibited the most promising results in predicting treatment response.

Keywords: Contrast-enhanced ultrasound (CEUS); colorectal carcinoma; liver metastasis; response.


Conflict of interest statement

Conflicts of Interest: All authors have completed the ICMJE uniform disclosure form (available at https://qims.amegroups.com/article/view/10.21037/qims-23-1027/coif). The authors have no conflicts of interest to declare.

Figures

Figure 1
Figure 1
Fifty-nine-year-old man with CRLM, the size of the target lesion was 44 mm. SonoLiver screenshot of CEUS image and dynamic perfusion image with motion compensation are shown. (A,B) Ultrasound image (A) and color-coded display of dynamic perfusion model diagram (B) show CRLM. Five ROIs are drawn: area within blue line is motion compensation area, a reference ROI (yellow line), an analysis ROI covering the whole lesion (green line), and analysis ROI on lesion peripheral (red solid line), and an analysis ROI on internal lesion (red dotted line). Color bar represents the ratio of the intensity of analysis ROI to reference ROI (red: the intensity of analysis ROI higher than that of reference ROI; blue: the intensity of analysis ROI lower than that of reference ROI). (C) Contrast agent dynamics in reference area (yellow line) and analysis area (green line of whole lesion, upper red line of lesion peripheral, nether red line of internal lesion). Thin lines are original dynamic perfusion curve, and thick lines are perfusion curve after best-fitting analysis. (D) TIC of the difference between original signals in analysis ROIs (green line of whole lesion, red line of lesion peripheral, red line with dot of internal lesion) and reference signal averaged in reference ROI. CRLM, colorectal liver metastasis; CEUS, contrast-enhanced ultrasound; ROI, region of interest; TIC, time-intensity curve.
Figure 2
Figure 2
The flow chart of the patients’ recruitment. CRLM, colorectal liver metastasis; Bev, bevacizumab; CEUS, contrast-enhanced ultrasound; mRECIST, modified Response Evaluation Criteria in Solid Tumor.
Figure 3
Figure 3
The comparison of ∆IMAX and ∆AUC between PR group (responders, the left sides of each box-whisker plots) and SD & PD group (non-responders, the right sides of each box-whisker plots). Box-and-whisker plots of ∆par. between PR group and SD & PD group with different ROI selection. Lines in boxes denote medians, whiskers denote 95% CIs, square denote outliers. (A) ∆IMAX in PR group and SD & PD group. ∆IMAX was significantly higher in PR group than that in SD & PD group for ROIwhole, ROIperipheral, and ROIinternal. (B) ∆AUC in PR group and SD & PD group. ∆AUC was significantly higher in PR group than that in SD & PD group for ROIwhole, ROIperipheral, and ROIinternal. IMAX, maximal intensity; PR, partial response; SD, stable disease; PD, progressive disease; AUC, area under the time-intensity curve; ∆IMAX, IMAX of pre-treatment minus that of post-treatment; ∆AUC, AUC of pre-treatment minus that of post-treatment; ∆par., reduction of a parameter; ROI, region of interest; CI, confidence interval; ROIwhole, ROI covering the whole lesion; ROIperipheral, ROI selected on lesion periphery; ROIinternal, ROI selected on internal tumor with necrotic area avoided.
Figure 4
Figure 4
The comparison of post- to pre-treatment ratio of IMAX and AUC between PR group (responders, the left sides of each box-whisker plots) and SD & PD group (non-responders, the right sides of each box-whisker plots). Box-and-whisker plots of ratio of perfusion parameters between PR group and SD & PD group with different ROI selection. Lines in boxes denote medians, whiskers denote 95% CIs, square denote outliers. (A) Post- to pre-treatment ratio of IMAX in PR group was significantly lower in PR group than that in SD & PD group for ROIwhole, ROIperipheral, and ROIinternal. (B) Post- to pre-treatment ratio of AUC in PR group was significantly lower in PR group than that in SD & PD group for ROIwhole, ROIperipheral, and ROIinternal. IMAX, maximal intensity; PR, partial response; SD, stable disease; PD, progressive disease; AUC, area under the time-intensity curve; ROI, region of interest; CI, confidence interval; ROIwhole, ROI covering the whole lesion; ROIperipheral, ROI selected on lesion periphery; ROIinternal, ROI selected on internal tumor with necrotic area avoided.
Figure 5
Figure 5
AUROCs for reduction and ratio of IMAX and AUC in response assessment in development cohort. Blue line: ROI selected on whole lesion; red line: ROI selected on lesion peripheral; green line: ROI selected on lesion internal. (A) AUROC for ∆IMAX. Comparable AUROC values were observed with ROIperipheral compared to ROIwhole (P=0.89), slightly lower AUROC value with ROIinternal as compared to ROIperipheral (P=0.19) and ROIwhole (P=0.08). (B) AUROC for ∆AUC. Significantly higher AUROC value was observed with ROIperipheral as compared to ROIwhole (P=0.05) and ROIinternal (P=0.03). (C) AUROC for ratio of IMAX. Comparable AUROC values were observed with ROIperipheral, ROIwhole, and ROIinternal (all P>0.10). (D) AUROC for ratio of AUC. Comparable AUROC values were observed with ROIperipheral, ROIwhole, and ROIinternal (all P>0.10). AUROC, area under the receiver operating characteristic curve; IMAX, maximal intensity; AUC, area under the time-intensity curve; ROI, region of interest; ∆IMAX, IMAX of pre-treatment minus that of post-treatment; ROIperipheral, ROI selected on lesion periphery; ROIwhole, ROI covering the whole lesion; ROIinternal, ROI selected on internal tumor with necrotic area avoided; ∆AUC, AUC of pre-treatment minus that of post-treatment.
Figure 6
Figure 6
AUROCs for reduction and ratio of IMAX and AUC in response assessment in validation cohort. Blue line: ROI selected on whole lesion; red line: ROI selected on lesion peripheral; green line: ROI selected on lesion internal. (A) AUROC for ∆IMAX. Slightly higher AUROC value was observed with ROIperipheral as compared to ROIwhole (P=0.19). Significantly lower AUROC value was observed with ROIinternal as compared to ROIperipheral (P=0.04). (B) AUROC for ∆AUC. Comparable AUROC values were observed on ROIperipheral as compared to ROIwhole (P=0.90). Slightly lower AUROC value was observed with ROIinternal as compared to ROIwhole (P=0.07) and ROIperipheral (P=0.08). (C) AUROC for ratio of IMAX. Comparable AUROC values were observed with ROIperipheral, ROIwhole and ROIinternal (all P>0.10). (D) AUROC for ratio of AUC. Comparable AUROC values were observed on ROIperipheral as compared to ROIwhole (P>0.99). Slightly lower AUROC value was observed with ROIinternal as compared to ROIwhole and ROIperipheral (P=0.07 for both). AUROC, area under the receiver operating characteristic curve; IMAX, maximal intensity; AUC, area under the time-intensity curve; ROI, region of interest; ∆IMAX, IMAX of pre-treatment minus that of post-treatment; ROIperipheral, ROI selected on lesion periphery; ROIwhole, ROI covering the whole lesion; ROIinternal, ROI selected on internal tumor with necrotic area avoided; ∆AUC, AUC of pre-treatment minus that of post-treatment.

Similar articles

References

    1. Chen W, Zheng R, Baade PD, Zhang S, Zeng H, Bray F, Jemal A, Yu XQ, He J. Cancer statistics in China, 2015. CA Cancer J Clin 2016;66:115-32. 10.3322/caac.21338 - DOI - PubMed
    1. Cardona K, Mastrodomenico P, D'Amico F, Shia J, Gönen M, Weiser MR, Paty PB, Kingham TP, Allen PJ, De Matteo RP, Fong Y, Jarnagin WR, D'Angelica MI. Detailed pathologic characteristics of the primary colorectal tumor independently predict outcome after hepatectomy for metastases. Ann Surg Oncol 2013;20:148-54. 10.1245/s10434-012-2540-y - DOI - PubMed
    1. Imai K, Allard MA, Benitez CC, Vibert E, Sa Cunha A, Cherqui D, Castaing D, Bismuth H, Baba H, Adam R. Early Recurrence After Hepatectomy for Colorectal Liver Metastases: What Optimal Definition and What Predictive Factors? Oncologist 2016;21:887-94. 10.1634/theoncologist.2015-0468 - DOI - PMC - PubMed
    1. Edwards MS, Chadda SD, Zhao Z, Barber BL, Sykes DP. A systematic review of treatment guidelines for metastatic colorectal cancer. Colorectal Dis 2012;14:e31-47. 10.1111/j.1463-1318.2011.02765.x - DOI - PMC - PubMed
    1. Fukumura D, Jain RK. Tumor microvasculature and microenvironment: targets for anti-angiogenesis and normalization. Microvasc Res 2007;74:72-84. 10.1016/j.mvr.2007.05.003 - DOI - PMC - PubMed