. 2024 Jan;14(1):e1539.
doi: 10.1002/ctm2.1539.

ARID5B-mediated LINC01128 epigenetically activated pyroptosis and apoptosis by promoting the formation of the BTF3/STAT3 complex in β2GPI/anti-β2GPI-treated monocytes

Affiliations

ARID5B-mediated LINC01128 epigenetically activated pyroptosis and apoptosis by promoting the formation of the BTF3/STAT3 complex in β2GPI/anti-β2GPI-treated monocytes

Yuan Tan et al. Clin Transl Med. 2024 Jan.

Abstract

Background: Alterations of the trimethylation of histone 3 lysine 4 (H3K4me3) mark in monocytes are implicated in the development of autoimmune diseases. Therefore, the purpose of our study was to elucidate the role of H3K4me3-mediated epigenetics in the pathogenesis of antiphospholipid syndrome (APS).

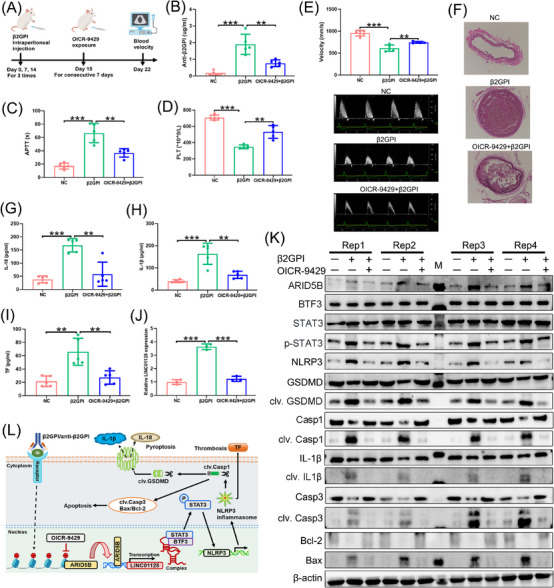
Methods: H3K4me3 Cleavage Under Targets and Tagmentation and Assay for Transposase-Accessible Chromatin were performed to determine the epigenetic profiles. Luciferase reporter assay, RNA immunoprecipitation, RNA pull-down, co-immunoprecipitation and chromatin immunoprecipitation were performed for mechanistic studies. Transmission electron microscopy and propidium iodide staining confirmed cell pyroptosis. Primary monocytes from patients with primary APS (PAPS) and healthy donors were utilised to test the levels of key molecules. A mouse model mimicked APS was constructed with beta2-glycoprotein I (β2GPI) injection. Blood velocity was detected using murine Doppler ultrasound.

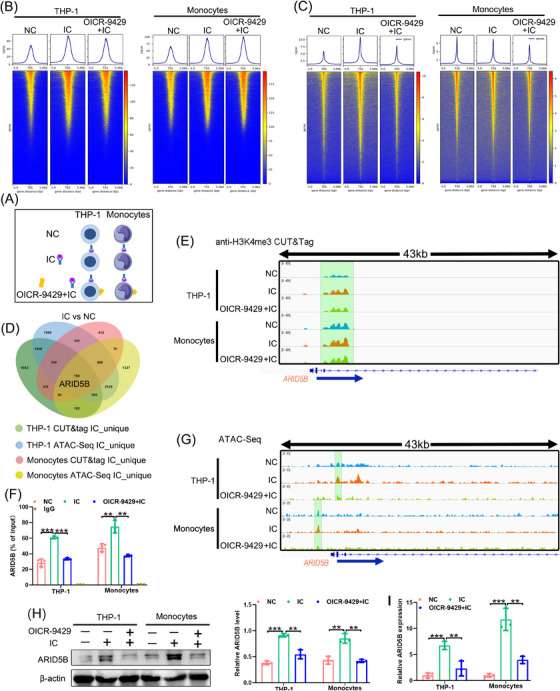
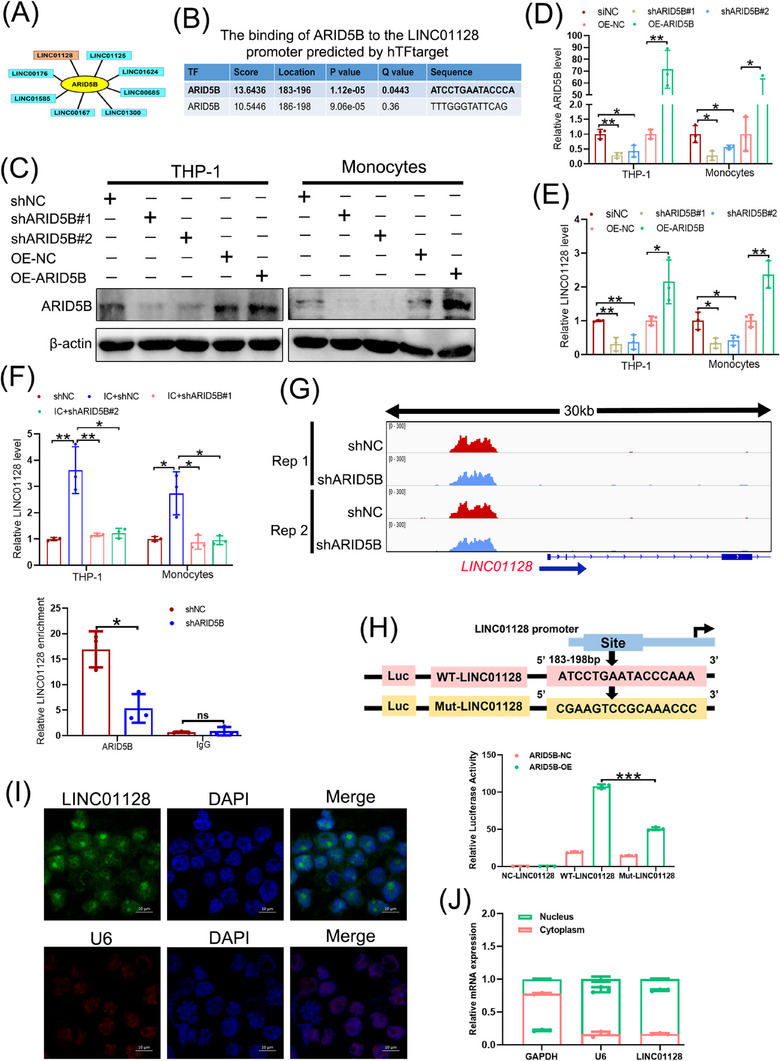
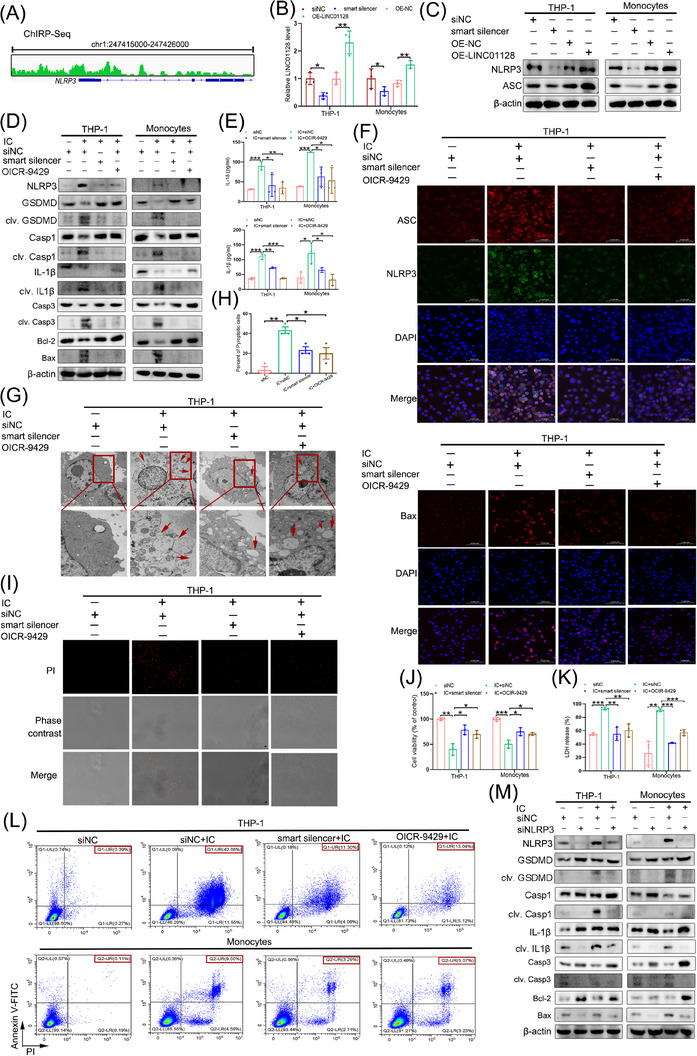
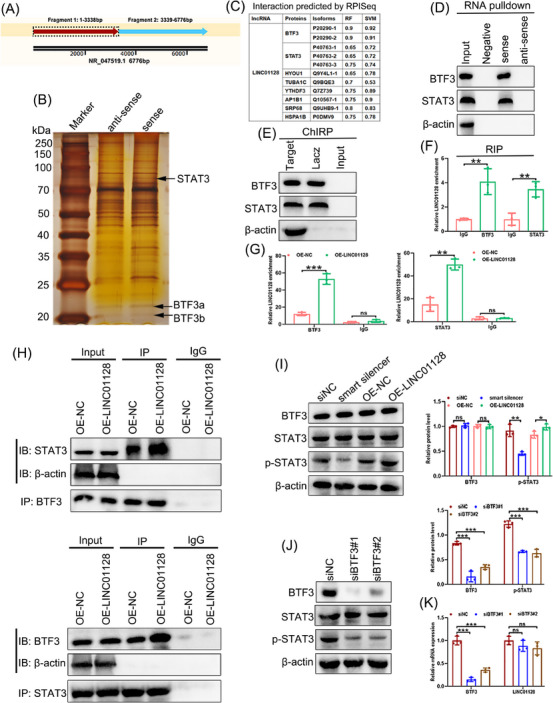
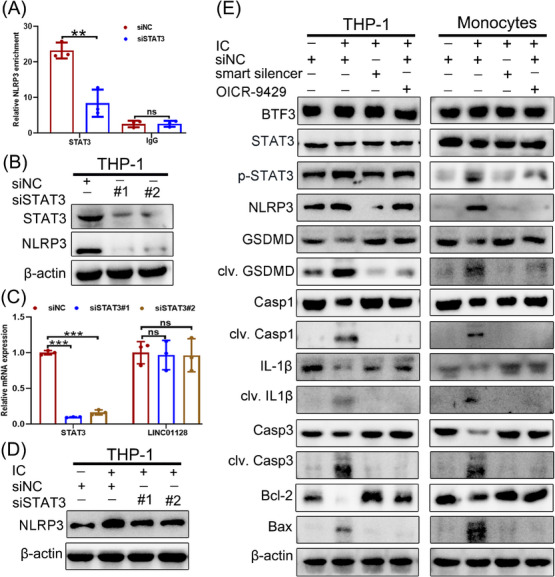
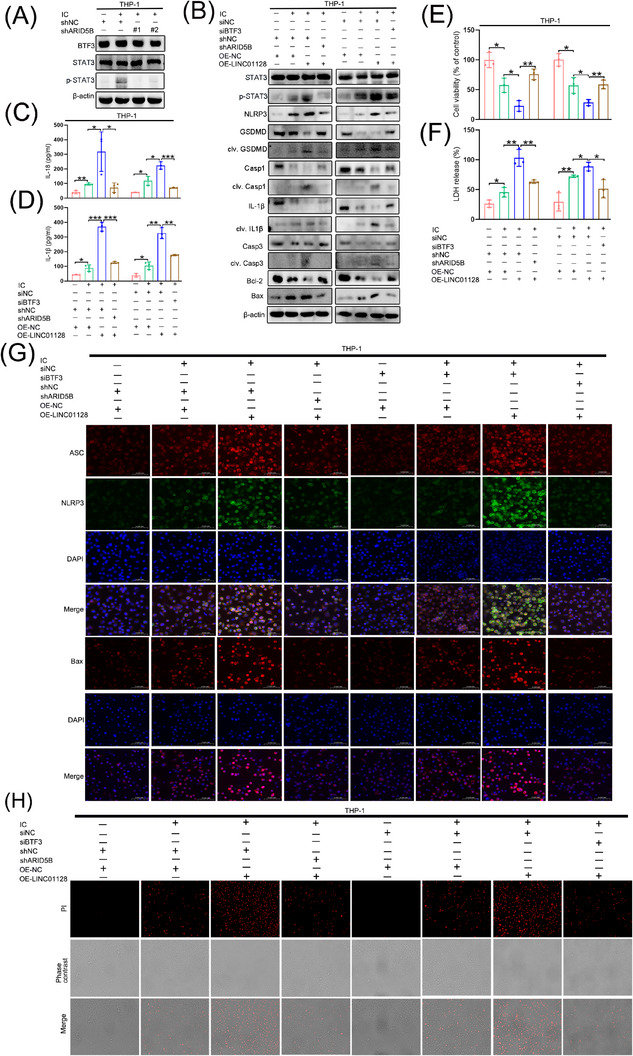
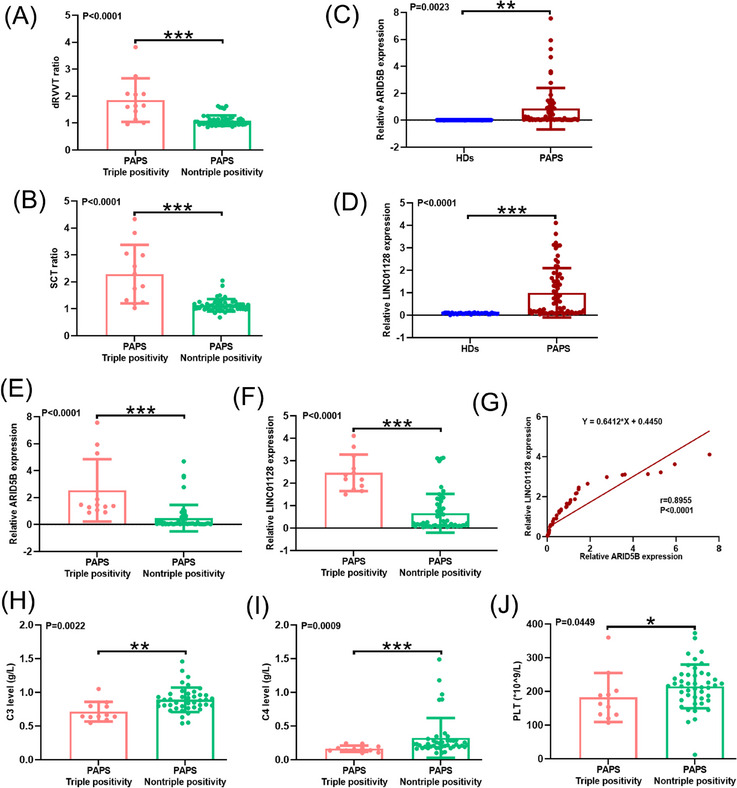
Results: H3K4me3 signal and open chromatin at the ARID5B promoter were increased in an in vitro model of APS. The epigenetic factor ARID5B directly activated LINC01128 transcription at its promoter. LINC01128 promoted the formation of the BTF3/STAT3 complex to enhance STAT3 phosphorylation. Activated STAT3 interacted with the NLRP3 promoter and subsequently stimulated pyroptosis and apoptosis. ARID5B or BTF3 depletion compensated for LINC01128-induced pyroptosis and apoptosis by inhibiting STAT3 phosphorylation. In mice with APS, β2GPI exposure elevated the levels of key proteins of pyroptosis and apoptosis pathways in bone marrow-derived monocytes, reduced the blood velocity of the ascending aorta, increased the thrombus size of the carotid artery, and promoted the release of interleukin (IL)-18, IL-1β and tissue factor. Patients with PAPS had the high-expressed ARID5B and LINC01128, especially those with triple positivity for antiphospholipid antibodies. Moreover, there was a positive correlation between ARID5B and LINC01128 expression.

Conclusion: This study indicated that ARID5B/LINC01128 was synergistically upregulated in APS, and they aggravated disease pathogenesis by enhancing the formation of the BTF3/STAT3 complex and boosting p-STAT3-mediated pyroptosis and apoptosis, thereby providing candidate therapeutic targets for APS.

Highlights: The H3K4me3 mark and chromatin accessibility at the ARID5B promoter are increased in vitro model mimicked APS. ARID5B-mediated LINC01128 induces pyroptosis and apoptosis via p-STAT3 by binding to BTF3. ARID5B is high- expressed in patients with primary APS and positively correlated with LINC01128 expression. OICR-9429 treatment mitigates pyroptosis and related inflammation in vivo and in vitro models mimicked APS.

Keywords: APS; ARID5B; LINC01128; apoptosis; epigenetics; pyroptosis; thrombosis.


Conflict of interest statement

The authors declare they have no conflicts of interest.

Figures

FIGURE 1
FIGURE 1
Trimethylation of histone 3 lysine 4 (H3K4me3)‐mediated ARID5B expression at its promoter. (A) Workflow of β2GPI/anti‐β2GPI immune complex (IC) treatment and OICR‐9424 exposure in an ex vivo monocyte or THP‐1 cell model that partially mimicked antiphospholipid syndrome (APS). (B) Heatmaps of H3K4me3 Cleavage Under Targets and Tagmentation (CUT&Tag) in an ex vivo THP‐1 cell and monocyte model of APS. (C) Heatmaps of Transposase‐Accessible Chromatin using sequencing (ATAC‐Seq) in an ex vivo THP‐1 cell and monocyte model of APS. (D) Venn diagram showed the intersection of the unique peaks (ARID5B) in the IC group compared to that in the negative control (NC) group between H3K4me3 CUT&Tag and ATAC‐Seq. (E) Integrative Genomics Viewer (IGV) and (F) quantitative PCR (qPCR) showed the relative enrichment levels of H3K4me3 at the promoter of ARID5B. (G) Chromatin accessibility at the ARID5B promoter was displayed using IGV. (H) The protein levels of ARID5B in the ex vivo model of APS were detected using western blotting. (I) Real‐time quantitative PCR (RT‐qPCR) determined the mRNA expression of ARID5B in the ex vivo model of APS. Data information: error bars represent the mean ± SD of at least three independent experiments. ** p < .01; *** p < .001. β2GPI, beta2‐glycoprotein I.
FIGURE 2
FIGURE 2
ARID5B transcriptionally activated LINC01128 expression. (A) Schematic representation of eight target long non‐coding RNAs (lncRNAs) of ARID5B in anti‐ARID5B Cleavage Under Targets and Tagmentation (CUT&Tag) in THP‐1 cells. (B) The two binding sites of ARID5B at the LINC01128 promoter were predicted using http://bioinfo.life.hust.edu.cn/hTFtarget#!/website. (C) Western blotting and (D) real‐time quantitative PCR (RT‐qPCR) analysis of ARID5B expression after transfection with two shRNAs (shARID5B#1 and shARID5B#2) or overexpression lentivirus in THP‐1 cells and monocytes. (E) RT‐qPCR analysis of LINC01128 expression after transfection with the above shRNAs or overexpression lentivirus. (F) RT‐qPCR analysis of LINC01128 expression after treatment with β2GPI/anti‐β2GPI immune complex (IC) in shARID5B‐THP‐1 cells. (G) Integrative Genomics Viewer (IGV) and quantitative PCR (qPCR) representation of anti‐ARID5B CUT&Tag at the LINC01128 promoter in the scrambled negative control (shNC)‐ and shARID5B‐THP‐1 cells. (H) Schematic representation of the mutated sequences of potential ARID5B‐binding sites on the LINC01128 promoter; luciferase activity after transfection with a reporter containing wild‐type (WT‐LINC01128) or mutant LINC01128 (Mut‐LINC01128) promoter constructs in 293T cells. (I) RNA fluorescence in situ hybridisation (FISH) assay showing the subcellular localisation of LINC01128 in THP‐1 cells; U6 was used as a nuclear localisation control; green, LINC01128; red, U6; blue, DAPI. (J) Nuclear fractionation and RT‐qPCR analysis of LINC01128 expression in the nucleus and cytoplasm. Data information: error bars represent the mean ± SD of at least three independent experiments. ns, not significant; * p < .05; ** p < .01; *** p < .001. β2GPI, beta2‐glycoprotein I.
FIGURE 3
FIGURE 3
LINC01128 silencing repressed the key molecules involved in pyroptosis and apoptosis in antiphospholipid syndrome (APS). (A) Chromatin isolation by RNA purification (ChIRP) assay detected the enrichment of Nod‐like receptor family pyrin domain‐containing 3 (NLRP3) in the LINC01128 probe group in THP‐1 cells. (B) RT‐PCR analysis of LINC01128 expression after transfection with a smart silencer or overexpression plasmid in THP‐1 cells and monocytes. (C) Western blotting analysis of NLRP3 and apoptosis‐associated speck‐like protein (ASC) expression in LINC01128‐knockdown and LINC01128‐overexpressing THP‐1 cells and monocytes. (D) Western blotting revealed the expression of pyroptosis‐ and apoptosis‐related proteins in the small interfering negative control (siNC), siNC+IC, smart silencer‐LINC01128+IC and siNC+OICR‐9429+IC groups. (E) ELISA to detect the secretion of interleukin (IL)‐18 and IL‐1β in the siNC, siNC+IC, smart silencer‐LINC01128+IC and siNC+OICR‐9429+IC groups. (F) Immunofluorescence to detect the expression of NLRP3, ASC and Bax in the siNC, siNC+IC, smart silencer‐LINC01128+IC and siNC+OICR‐9429+IC groups in THP‐1 cells; original magnification, 40×. (G) Representative transmission electron microscopy (TEM) images and (H) the percentage of pyroptotic THP‐1 cells. Red arrows indicate the ballooned cell membrane or the large bubbles in the plasma. Scale bar, 2 μm. (I) Propidium iodide (PI) staining of THP‐1 cells in the siNC, siNC+IC, smart silencer‐LINC01128+IC and siNC+OICR‐9429+IC groups; original magnification, 20×. (J) Cell Counting Kit‐8 (CCK‐8) assay to assess the cell viability in the siNC, siNC+IC, smart silencer‐LINC01128+IC and siNC+OICR‐9429+IC groups in both THP‐1 cells and monocytes. (K) Release of lactate dehydrogenase (LDH) from THP‐1 cells and monocytes in siNC, siNC+IC, smart silencer‐LINC01128+IC and siNC+OICR‐9429+IC groups. (L) Flow cytometry analysis of THP‐1 cells and monocytes stained with Annexin V‐FITC and propidium iodide (PI); the percentage of double‐positive cells indicates pyroptotic cells labelled in red. (M) Western blotting to measure the levels of pyroptosis‐ and apoptosis‐related proteins in the siNC, siNLRP3, siNC+IC and siNLRP3+IC groups in both THP‐1 cells and monocytes. Data information: error bars represent the mean ± SD of at least three independent experiments. * p < .05; ** p < .01; *** p < .001. IC, β2GPI/anti‐β2GPI immune complex; β2GPI, beta2‐glycoprotein I.
FIGURE 4
FIGURE 4
LINC01128 promoted the formation of the BTF3/STAT3 complex. (A) Schematic representation of the two biotinylated fragments of LINC01128. (B) RNA pull‐down assay using LINC01128 sense and antisense RNA in THP‐1 cells, followed by silver staining. (C) The interaction score of LINC01128 with BTF3, STAT3 and other proteins was predicted using http://pridb.gdcb.iastate.edu/RPISeq/about.php (RNA‐Protein Interaction Prediction, RPISeq). (D) Western blotting detected the interaction of LINC01128 with BTF3 and STAT3 using the extract of the RNA pull‐down assay. (E) Western blotting to measure the interaction of LINC01128 with BTF3 and STAT3 using the extract of the chromatin isolation by RNA purification (ChIRP) assay. (F) RNA immunoprecipitation (RIP)‐qPCR analysis of LINC01128 with anti‐BTF3 or anti‐STAT3 antibody in THP‐1 cells. (G) RIP‐qPCR analysis of LINC01128 with anti‐BTF3 or anti‐STAT3 antibody in OE‐NC and OE‐LINC01128 THP‐1 cells. (H) Co‐immunoprecipitation (Co‐IP) analysis of OE‐NC and OE‐LINC01128 THP‐1 cells using anti‐BTF3 or anti‐STAT3 antibody; western blotting to verify the Co‐IP products using anti‐STAT3 or anti‐BTF3 antibody. (I) Western blotting to detect the expression of BTF3 and p‐STAT3/STAT3 in THP‐1 cells after knockdown or overexpression of LINC01128. (J) Western blotting to identify the expression of BTF3 and p‐STAT3/STAT3 in THP‐1 cells after the knockdown of BTF3. (K) Real‐time quantitative PCR (RT‐qPCR) to detect the expression of BTF3 and LINC01128 in THP‐1 cells after the knockdown of BTF3. Data information: error bars represent the mean ± SD of at least three independent experiments. ns, not significant; * p < .05; ** p < .01; *** p < .001.
FIGURE 5
FIGURE 5
LINC01128 promoted p‐STAT3‐mediated pyroptosis and apoptosis pathways. (A) Chromatin immunoprecipitation (ChIP)‐qPCR to detect the enrichment of p‐STAT3 at the NLRP promoter using the anti‐p‐STAT3 antibody in small interfering negative control (siNC)‐ and siSTAT3‐THP‐1 cells. (B) Western blotting to detect the expression of STAT3 and Nod‐like receptor family pyrin domain‐containing 3 (NLRP3) in THP‐1 cells after the knockdown of STAT3. (C) Real‐time quantitative PCR (RT‐qPCR) to detect the expression of STAT3 and LINC01128 in THP‐1 cells after the knockdown of STAT3. (D) Western blotting to identify the expression of NLRP3 in the siNC, siNC+IC, siSTAT3#1+IC and siSTAT3#2+IC groups. (E) Western blotting to identify the expression of BTF3 and p‐STAT3/STAT3, and the levels of pyroptosis‐ and apoptosis‐related proteins in THP‐1 cells and monocytes in the siNC, siNC+IC, smart silencer‐LINC01128+IC and siNC+OICR‐9429+IC groups. Data information: error bars represent the mean ± SD of at least three independent experiments. ns, not significant; ** p < .01; *** p < .001. IC, β2GPI/anti‐β2GPI immune complex; β2GPI, beta2‐glycoprotein I.
FIGURE 6
FIGURE 6
ARID5B or BTF3 knockdown interfered with LINC01128‐mediated pyroptosis and apoptosis via the p‐STAT3 pathway. (A) Western blotting to identify the expression of BTF3 and p‐STAT3/STAT3 after ARID5B knockdown in an in vitro THP‐1 cell model of antiphospholipid syndrome (APS). (B) Western blotting showed the levels of p‐STAT3/STAT3, and pyroptosis‐ and apoptosis‐related proteins after LINC01128 overexpression and ARID5B or BTF3 knockdown in an in vitro THP‐1 cell model of APS. (C and D) ELISA showed the secretory levels of interleukin (IL)‐18 and IL‐1β, respectively, after LINC01128 overexpression and ARID5B or BTF3 knockdown in an in vitro THP‐1 cell model of APS. (E) CCK‐8 assay and (F) lactate dehydrogenase (LDH) assay after LINC01128 overexpression and ARID5B or BTF3 knockdown in an in vitro THP‐1 cell model of APS. (G) Immunofluorescence to detect the expression of Nod‐like receptor family pyrin domain‐containing 3 (NLRP3), ASC and Bax after LINC01128 overexpression and ARID5B or BTF3 knockdown in an in vitro THP‐1 cell model of APS. (H) Propidium iodide (PI) staining after LINC01128 overexpression and ARID5B or BTF3 knockdown in an in vitro THP‐1 cell model of APS; original magnification, 20×. Data information: error bars represent the mean ± SD of at least three independent experiments. ns, not significant; * p < .05; ** p < .01; *** p < .001. IC, β2GPI/anti‐β2GPI immune complex; β2GPI, beta2‐glycoprotein I.
FIGURE 7
FIGURE 7
The activation of ARID5B/LINC01128/BTF3/STAT3 signalling in mice with antiphospholipid syndrome (APS). (A) Workflow of beta2‐glycoprotein I (β2GPI) intraperitoneal injection and OICR‐9429 exposure, β2GPI was injected once a week for 3 weeks to generate mice with vascular APS in vivo (number of mice in each group = 5). (B) Anti‐β2GPI levels, (C) activated partial thromboplastin time (APTT) and (D) platelet count (PLT) were detected in the negative control (NC), β2GPI and OICR‐9429+β2GPI groups. (E) The blood velocity of the ascending aorta was tested using Doppler ultrasound in the three groups of mice. (F) The thrombus size of the carotid artery was tested by haematoxylin–eosin (HE) staining in the three groups of mice; original magnification, 100×. (G–I) ELISA displaying the serum levels of interleukin (IL)‐18, IL‐1β and tissue factor (TF), respectively. (J) Real‐time quantitative PCR (RT‐qPCR) to detect the expression of LINC01128 in the three groups of mice. (K) Western blotting indicated the expression of ARID5B, BTF3 and p‐STAT3/STAT3, the activity of pyroptosis and apoptosis pathways in the three groups of mice. (L) Schematic diagram illustrating the potential mechanism of ARID5B‐mediated LINC01128 in p‐STAT3‐induced pyroptosis and apoptosis activation in APS. Data information: error bars represent the mean ± SD of at least three independent experiments. M, marker; ns, not significant; ** p < .01; *** p < .001.
FIGURE 8
FIGURE 8
The correlation of ARID5B/LINC01128 with antiphospholipid antibodies (aPLs) in patients with primary antiphospholipid syndrome (PAPS). (A) dilute Russell's viper venom time (dRVVT) ratio and (B) silica clotting time (SCT) ratio of triple‐positive (N = 12) and non‐triple‐positive (N = 52) patients with PAPS. (C) Relative ARID5B and (D) LINC01128 expression in patients with PAPS (N = 64) and healthy donors (HDs) (N = 32). (E) Relative ARID5B and (F) LINC01128 expression in triple‐positive (N = 12) and non‐triple‐positive (N = 52) patients with PAPS. (G) Correlation analysis between the expression of ARID5B and LINC01128. (H) C3, (I) C4 and (J) platelet count (PLT) levels in triple‐positive (N = 11) and non‐triple‐positive (N = 42, 43, 45) patients with PAPS. Data information: error bars represent the mean ± SD of at least three independent experiments. * p < .05; ** p < .01; *** p < .001.

Similar articles

Cited by

References

    1. Petri M. Antiphospholipid syndrome. Transl Res. 2020;225:70‐81. - PMC - PubMed
    1. D'Ippolito S, Barbaro G, Paciullo C, Tersigni C, Scambia G, Di Simone N. Antiphospholipid syndrome in pregnancy: new and old pathogenetic mechanisms. Int J Mol Sci. 2023;24(4):3195. - PMC - PubMed
    1. Capozzi A, Manganelli V, Riitano G, et al. Advances in the pathophysiology of thrombosis in antiphospholipid syndrome: molecular mechanisms and signaling through lipid rafts. J Clin Med. 2023;12(3):891. - PMC - PubMed
    1. Guzmán‐Martín CA, Juárez‐Vicuña Y, Domínguez‐López A, et al. lncRNAs dysregulation in monocytes from primary antiphospholipid syndrome patients: a bioinformatic and an experimental proof‐of‐concept approach. Mol Biol Rep. 2023;50(1):937‐941. - PubMed
    1. Patsouras MD, Karagianni P, Kogionou P, Vlachoyiannopoulos PG. Differential CpG methylation of the promoter of interleukin 8 and the first intron of tissue factor in antiphospholipid syndrome. J Autoimmun. 2019;102:159‐166. - PubMed

Publication types

LinkOut - more resources