. 2024 Mar 1;212(5):813-824.
doi: 10.4049/jimmunol.2300648.

Multiple Immune and Genetic Mechanisms Contribute to Cmv5s-Driven Susceptibility and Tissue Damage during Acute Murine Cytomegalovirus Infection

Affiliations

Multiple Immune and Genetic Mechanisms Contribute to Cmv5s-Driven Susceptibility and Tissue Damage during Acute Murine Cytomegalovirus Infection

Jessica L Annis et al. J Immunol. .

Abstract

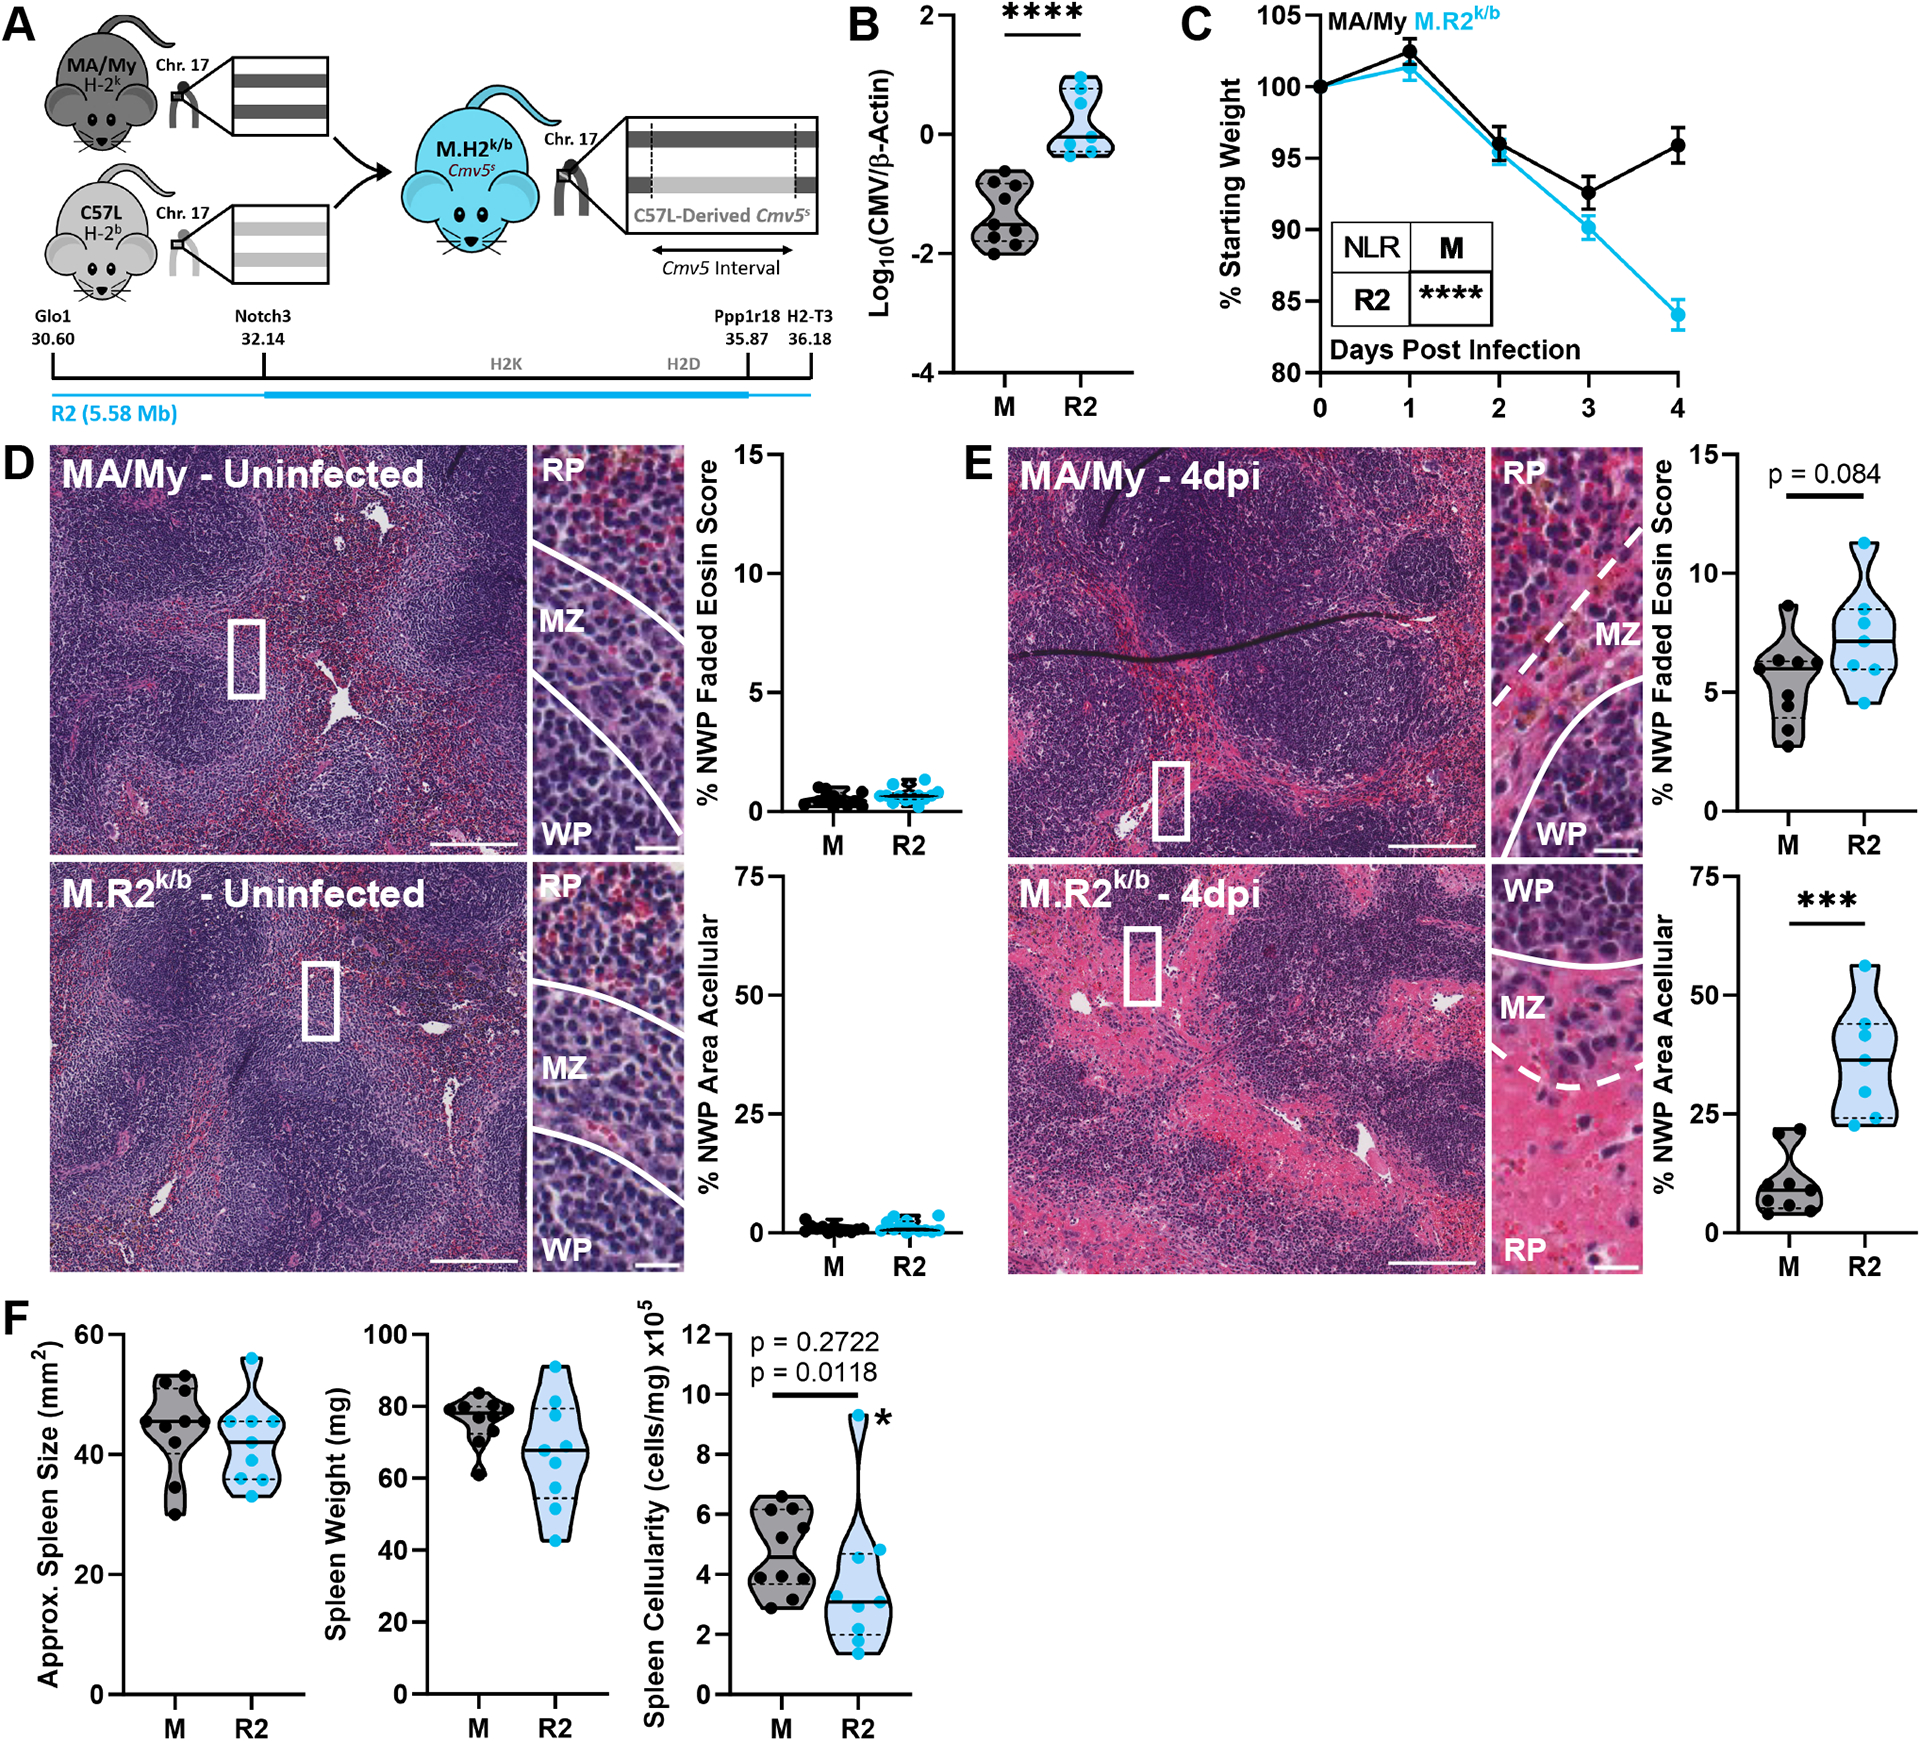
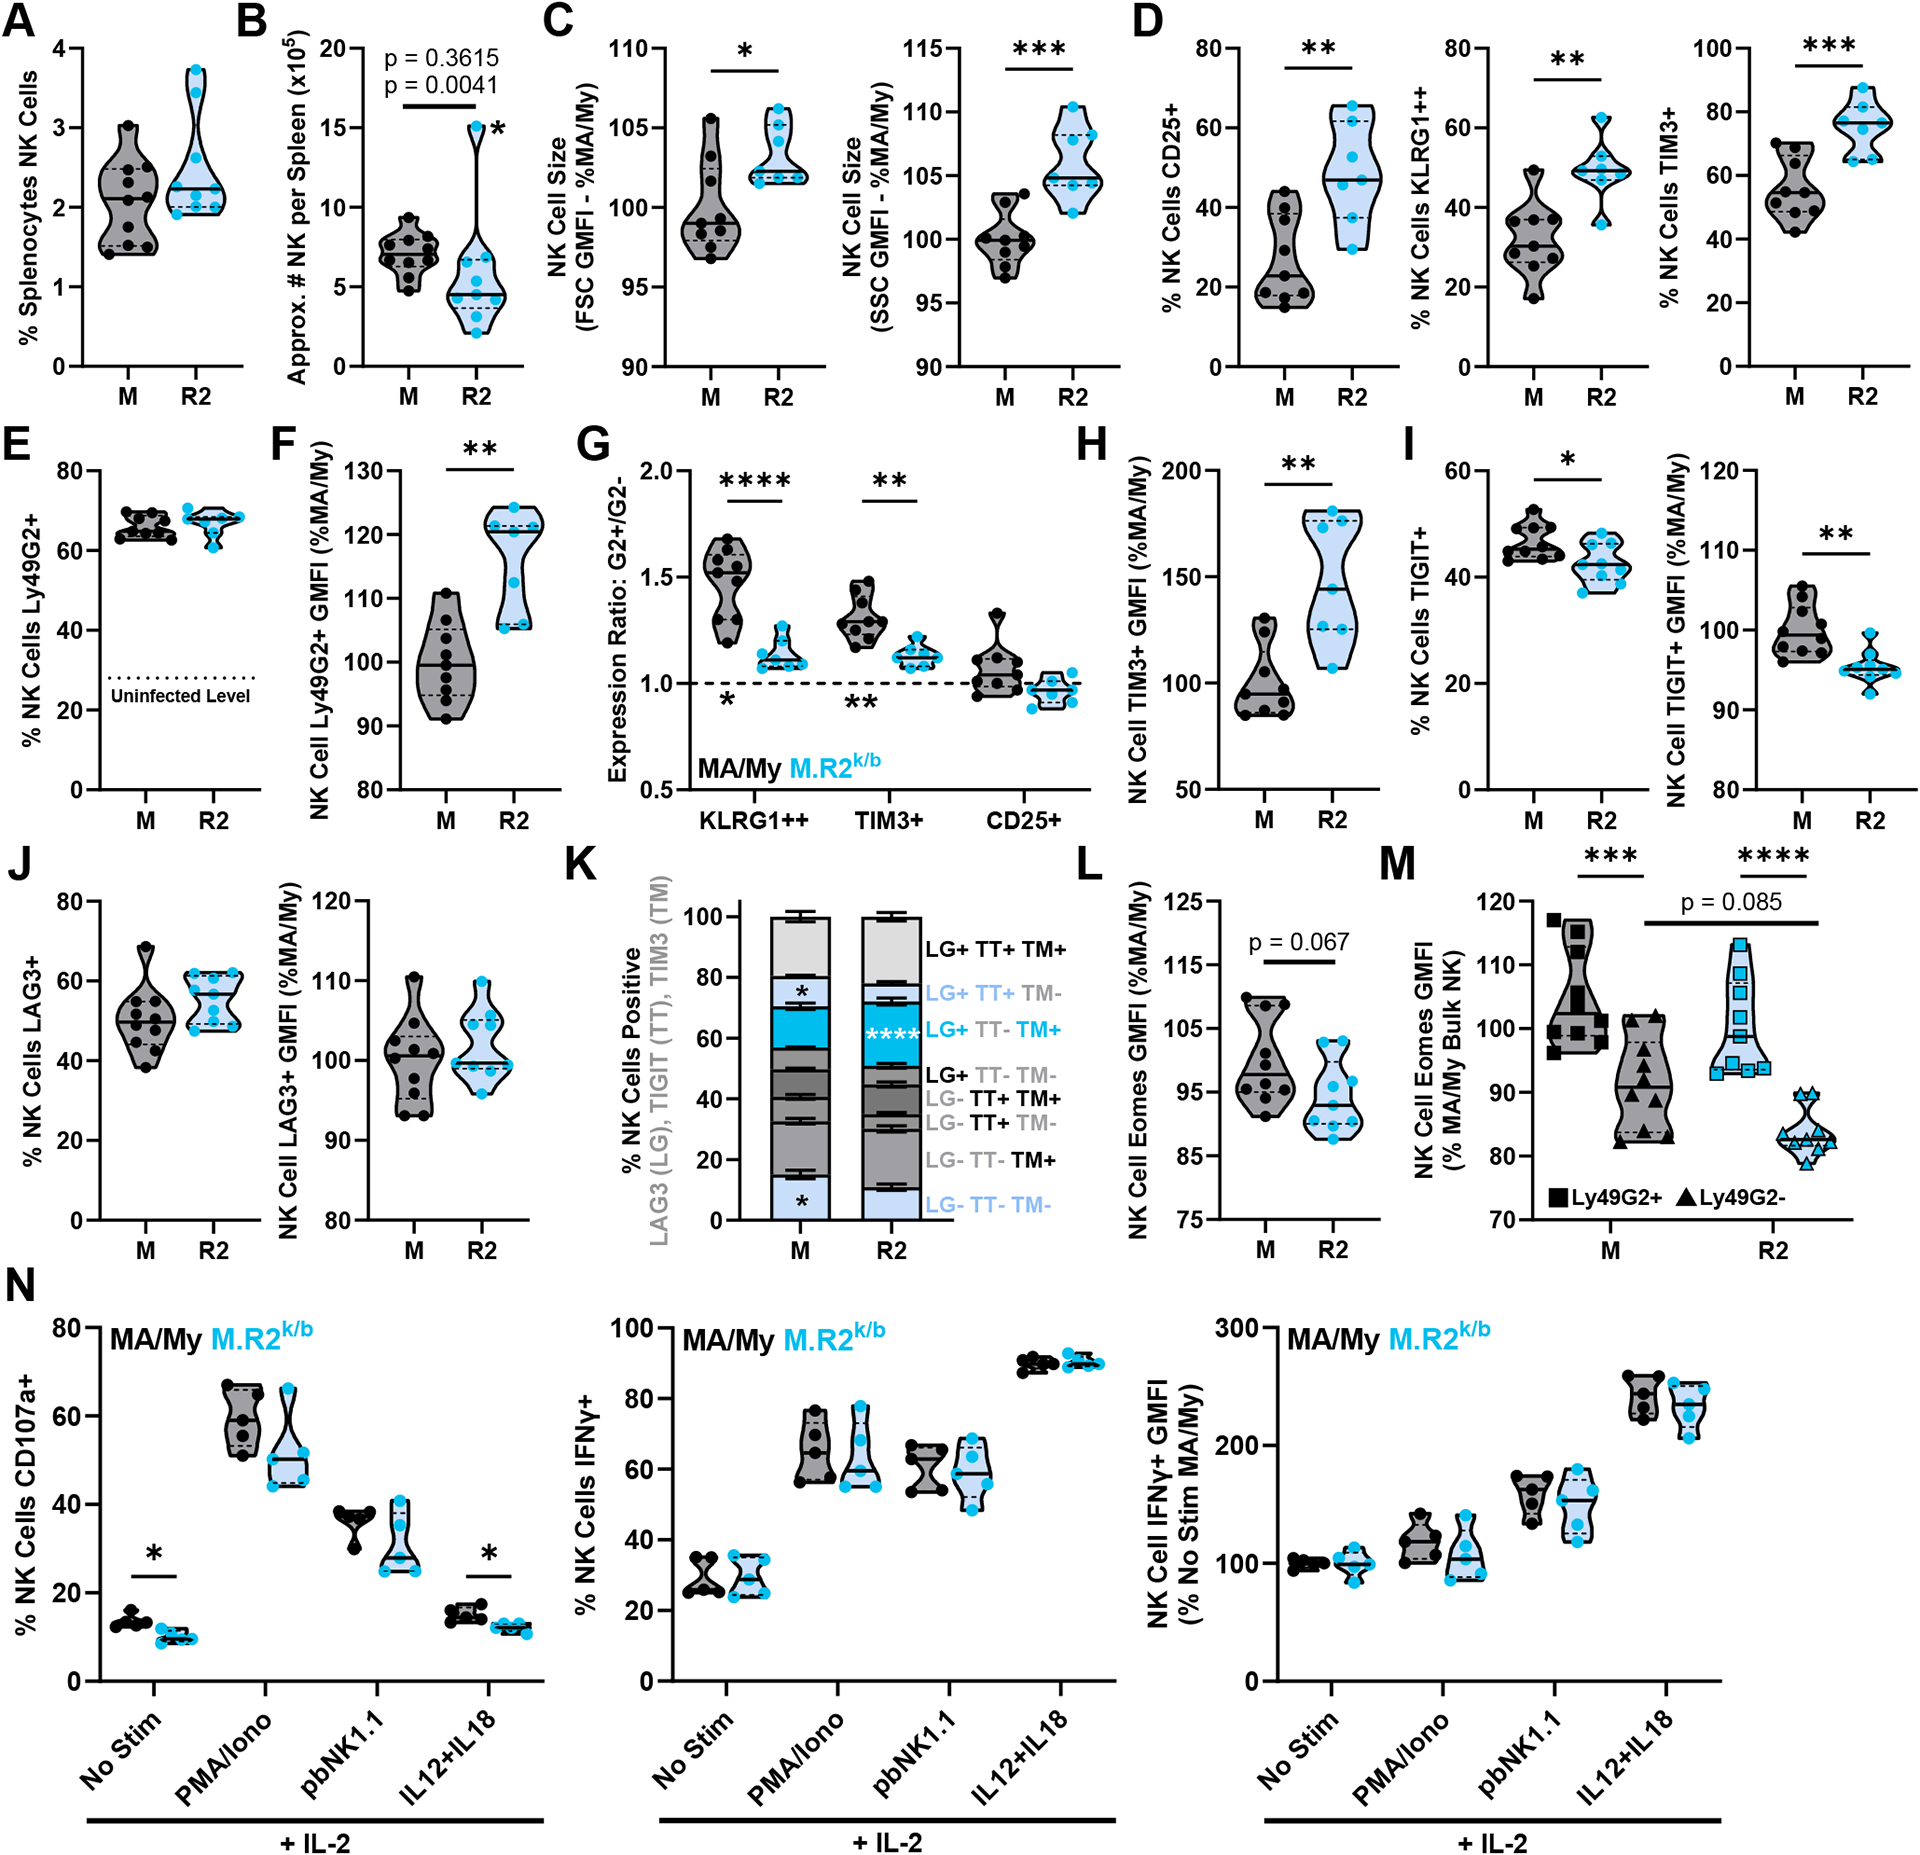
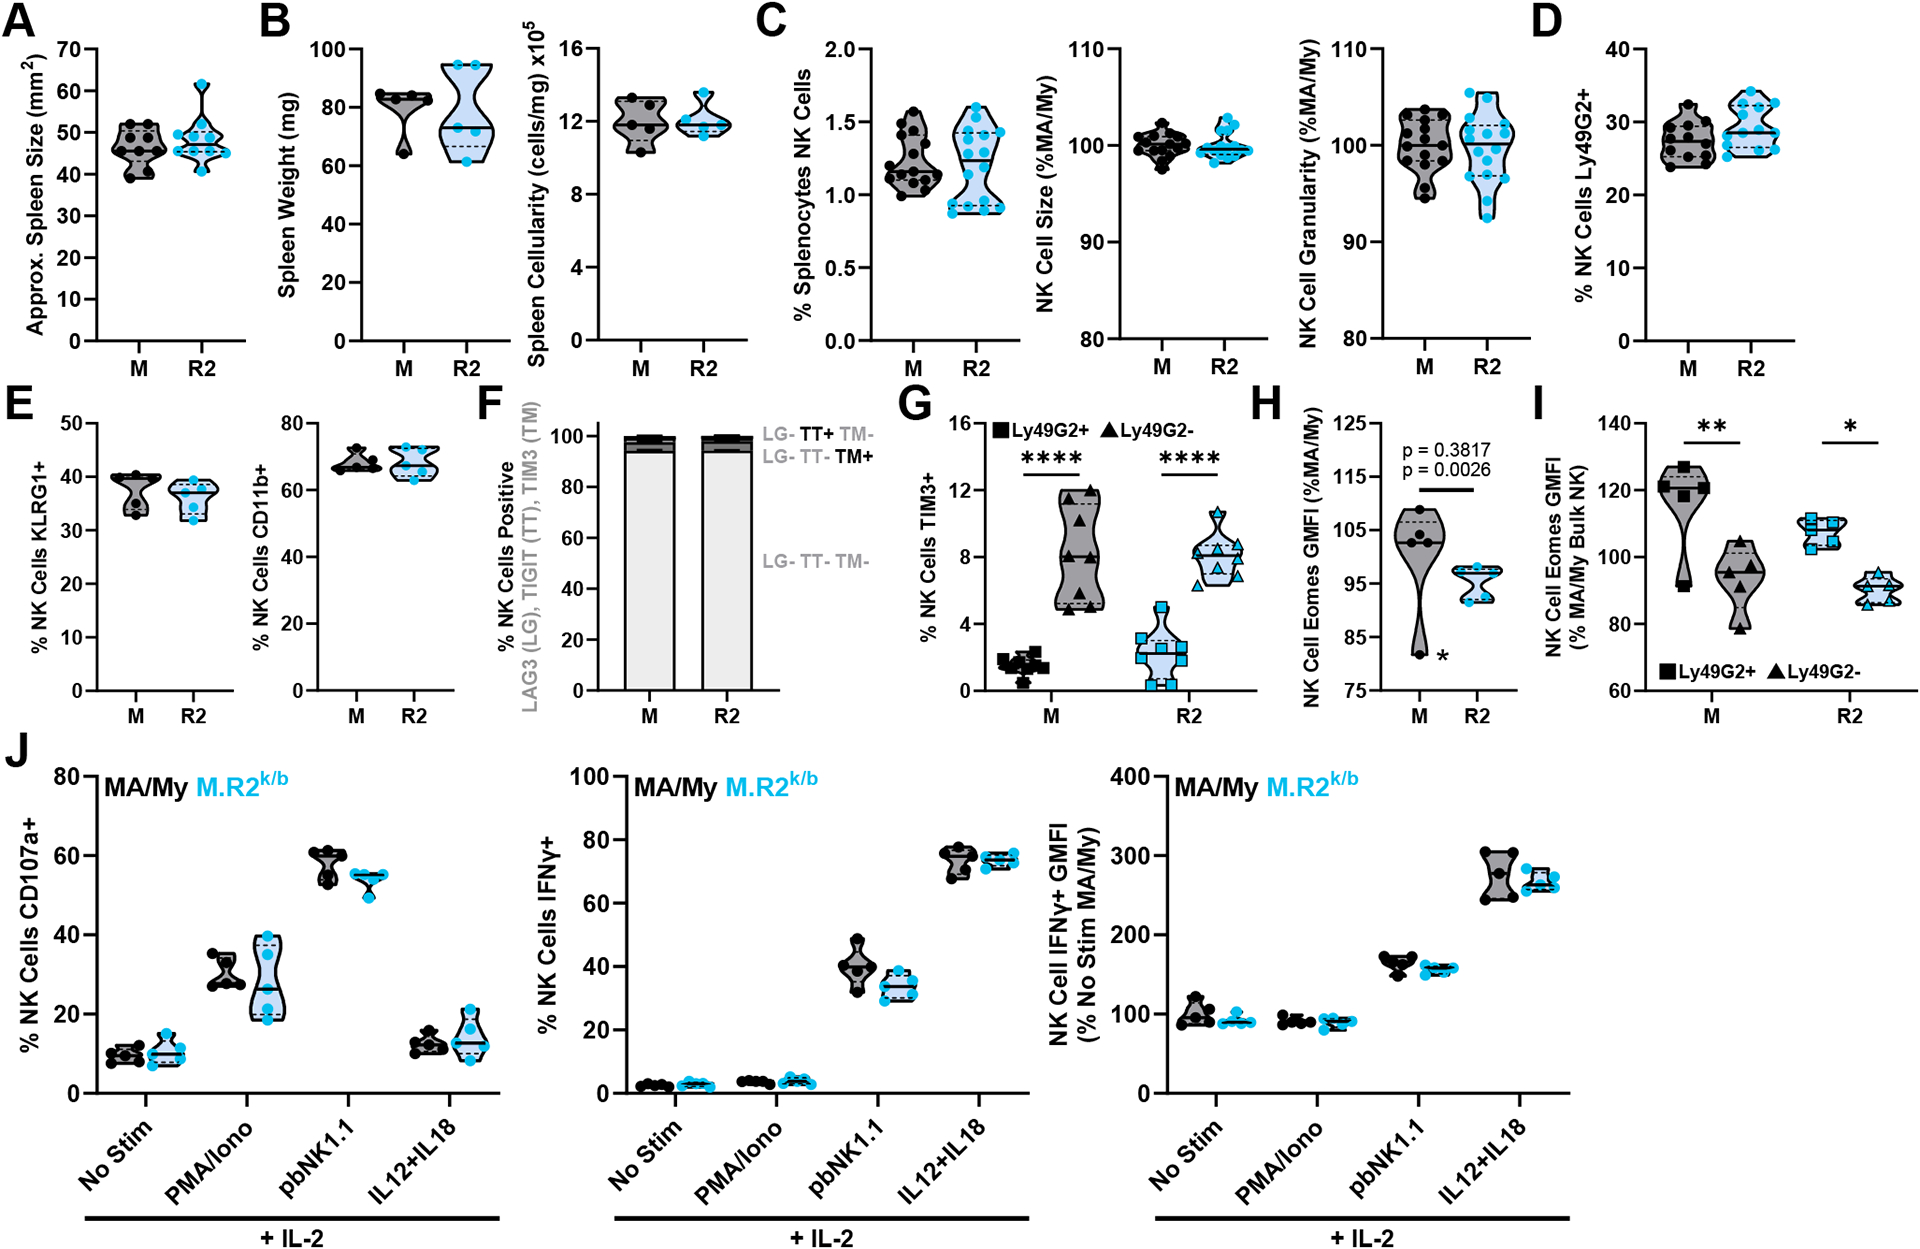
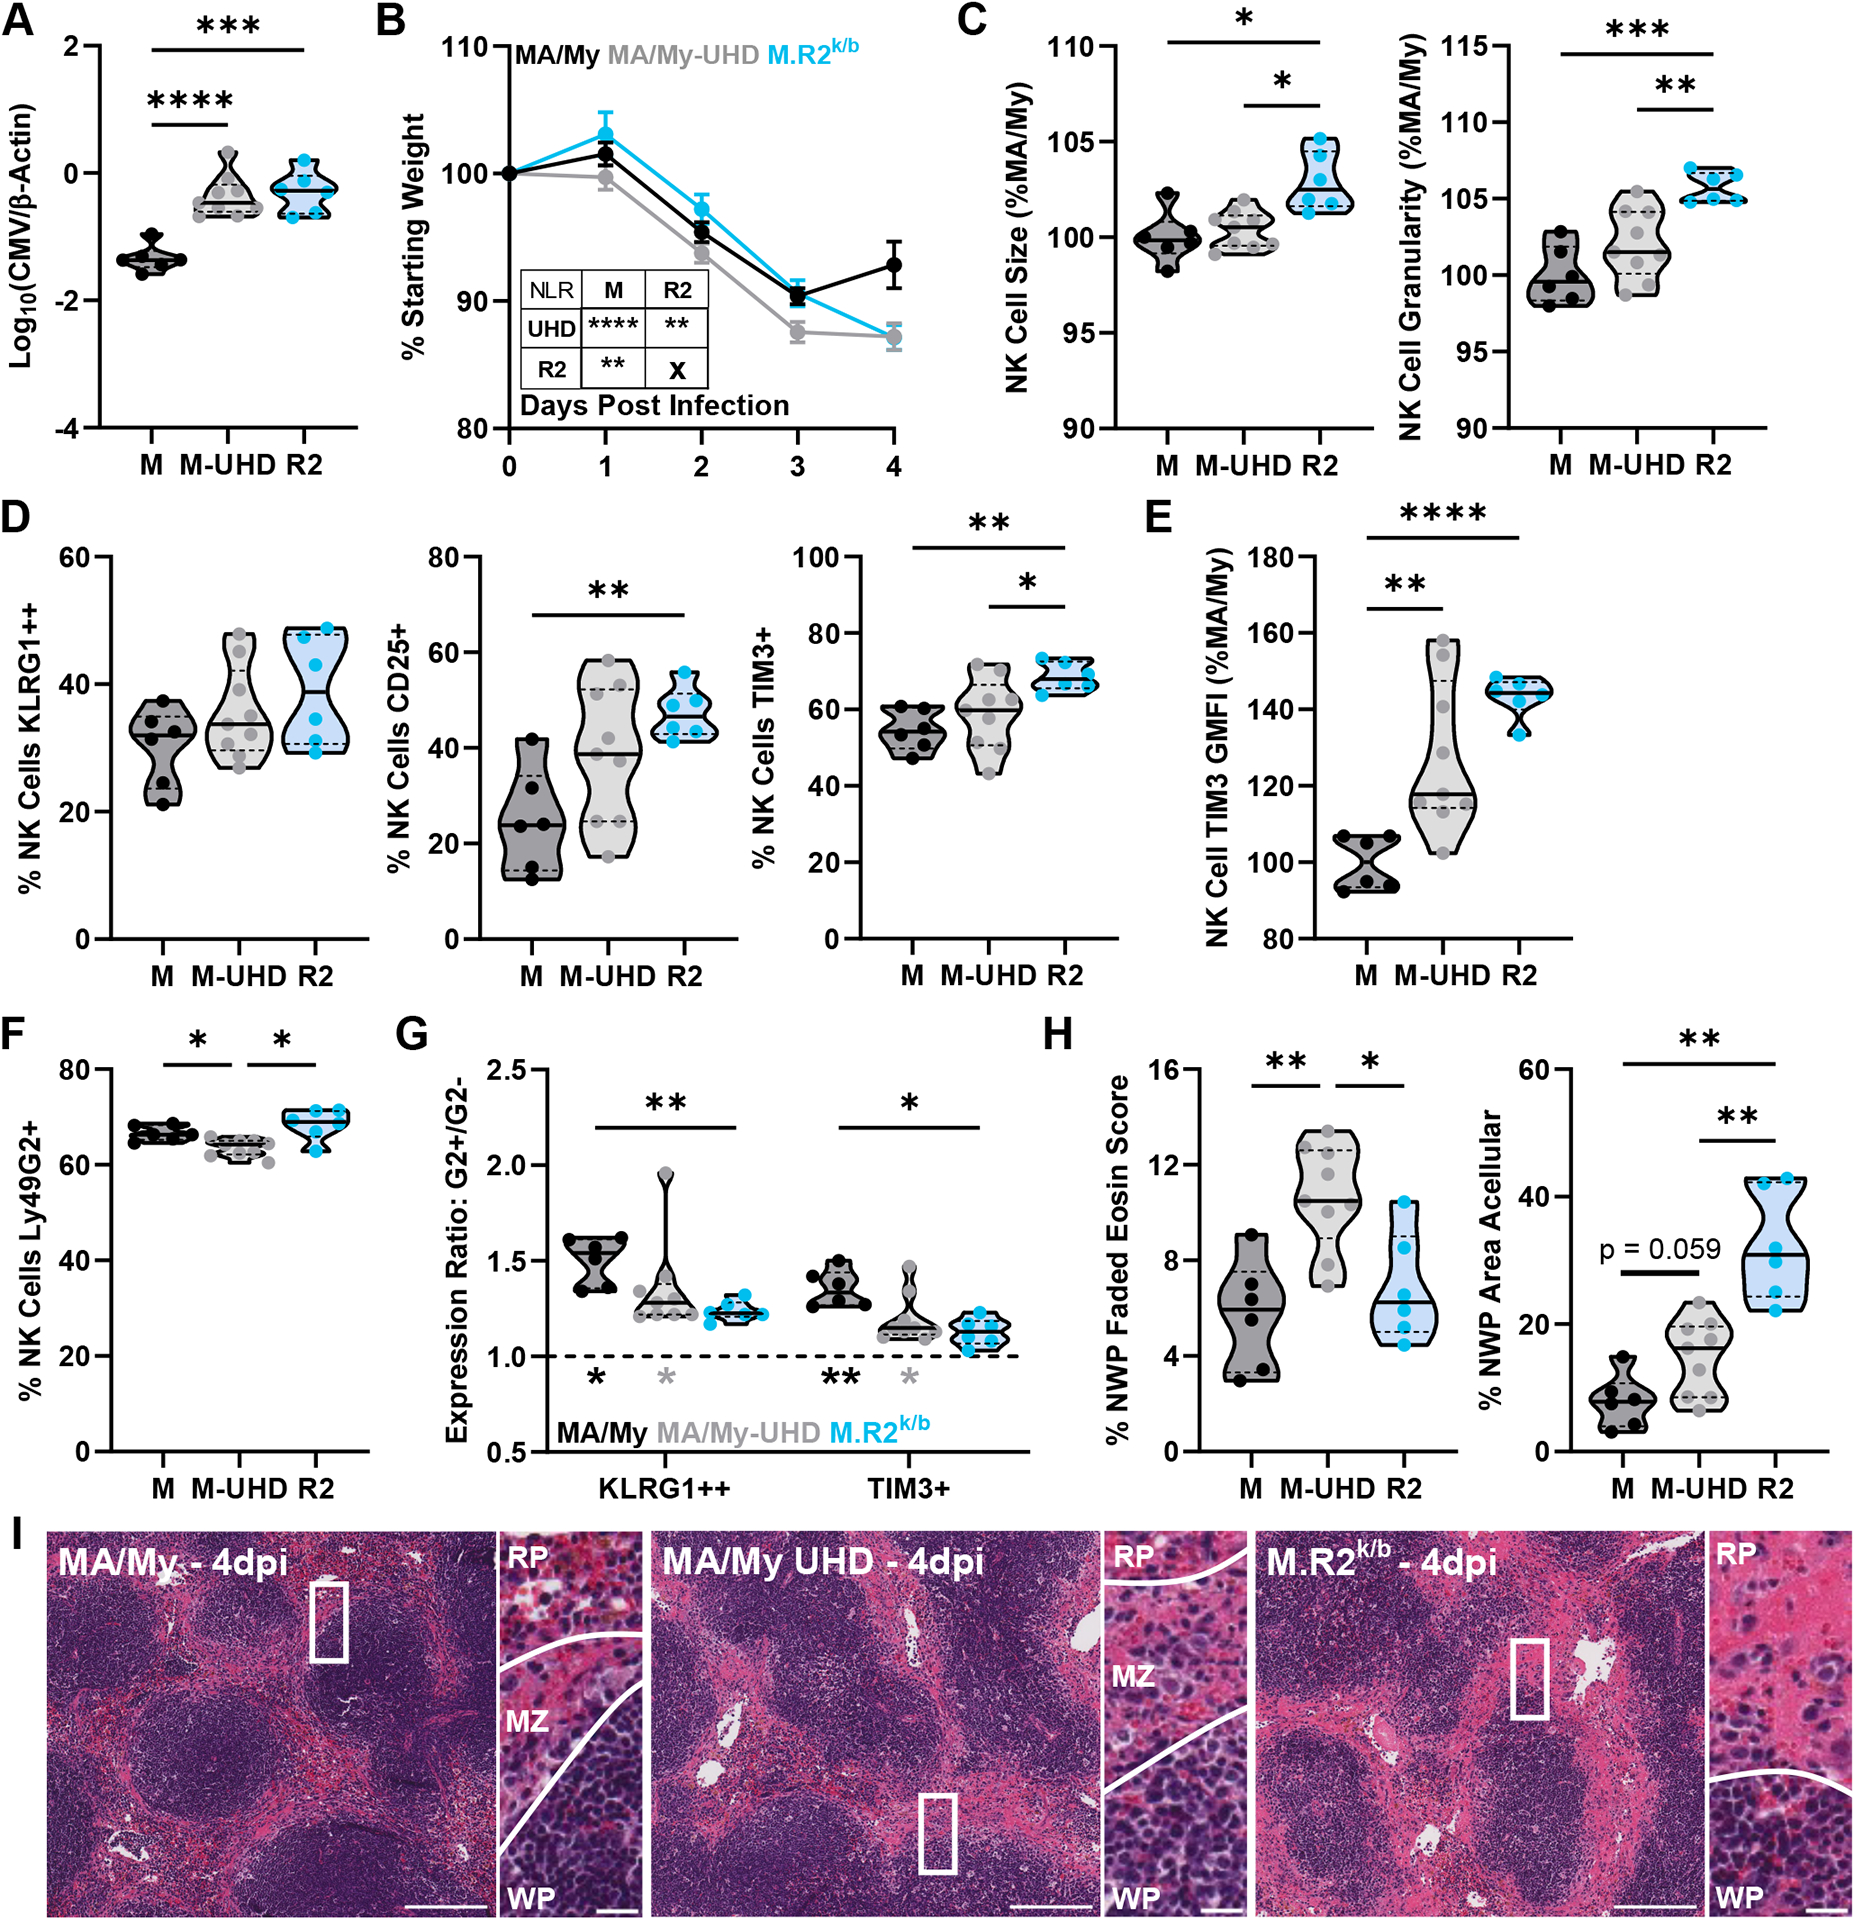
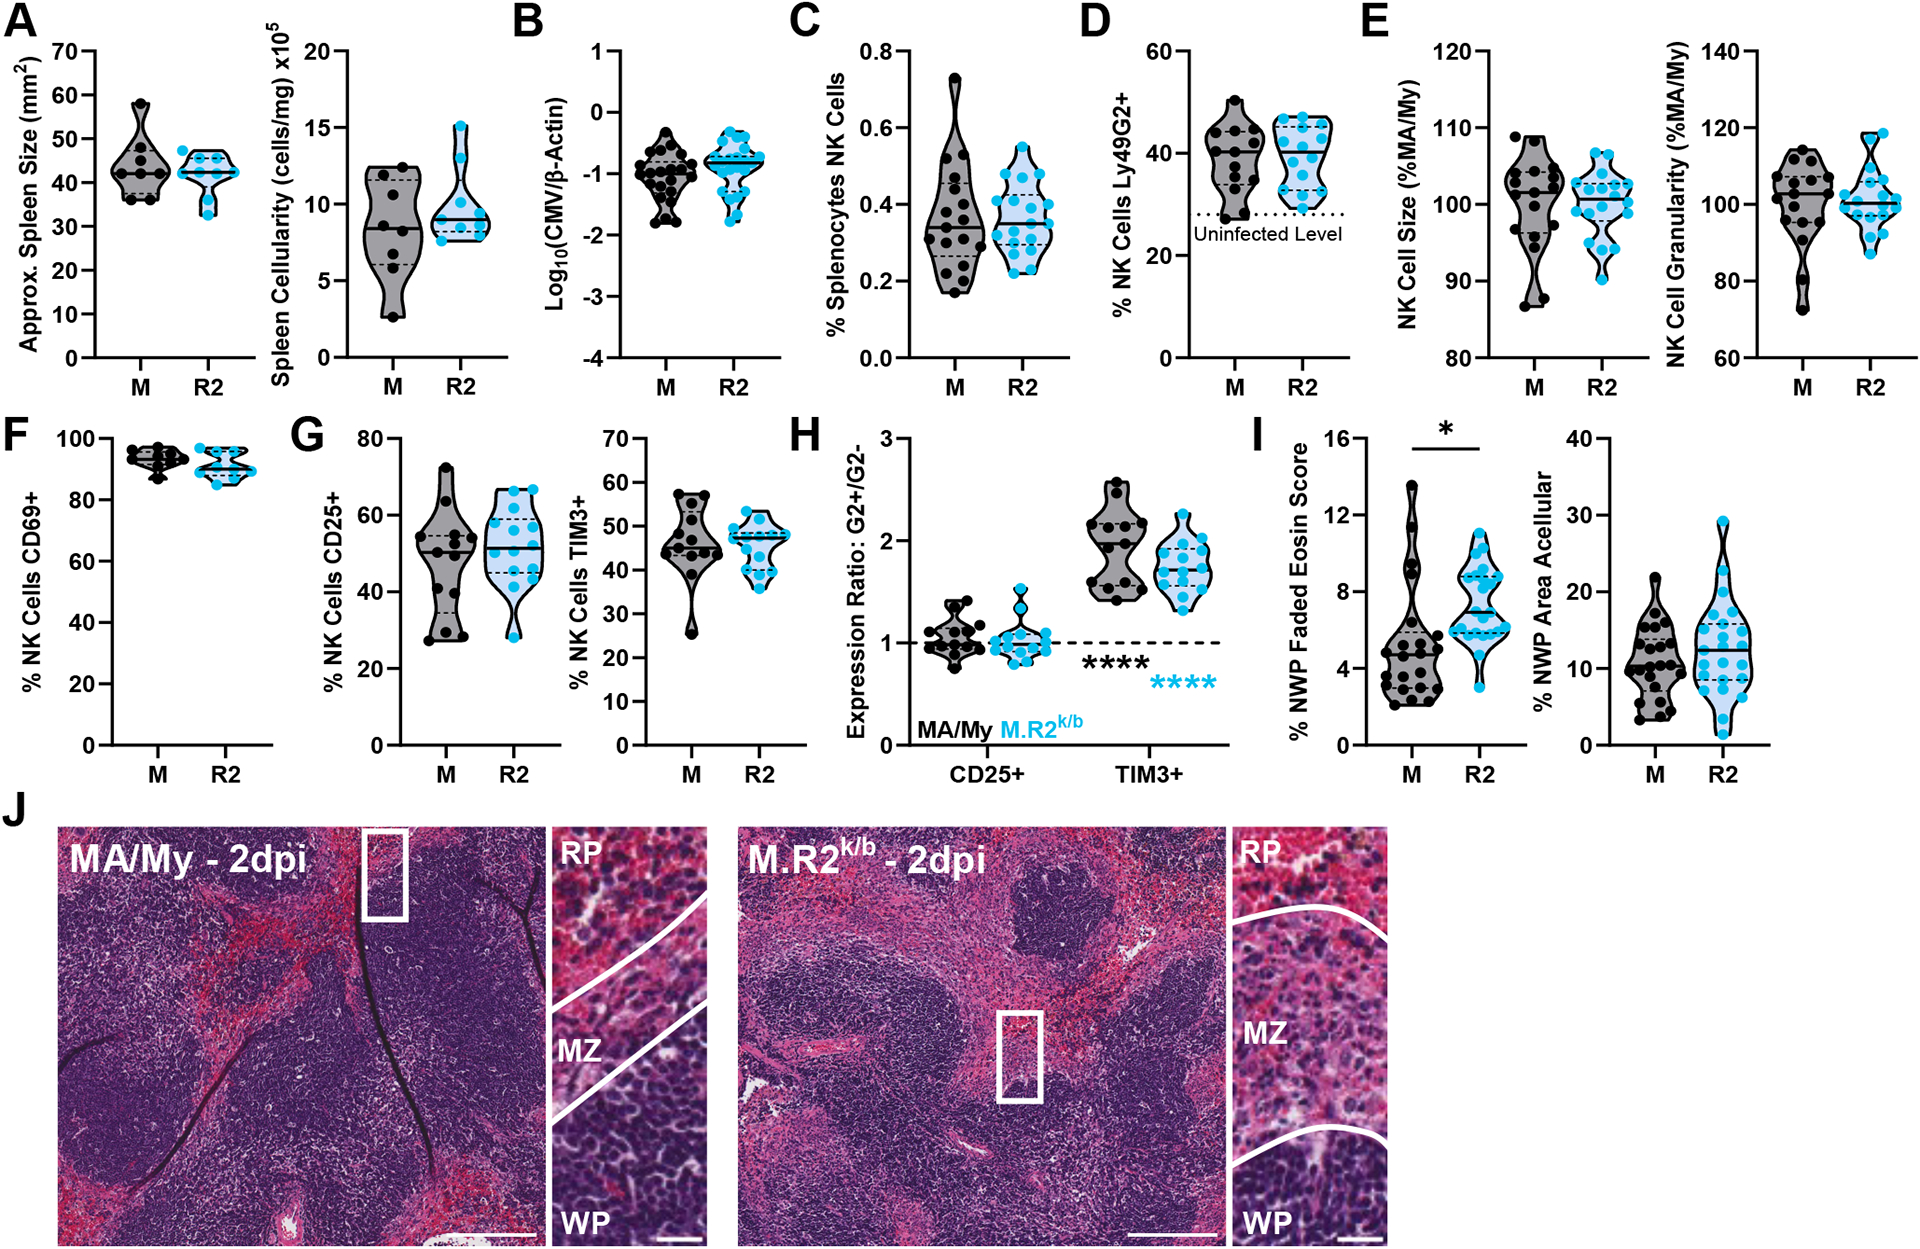
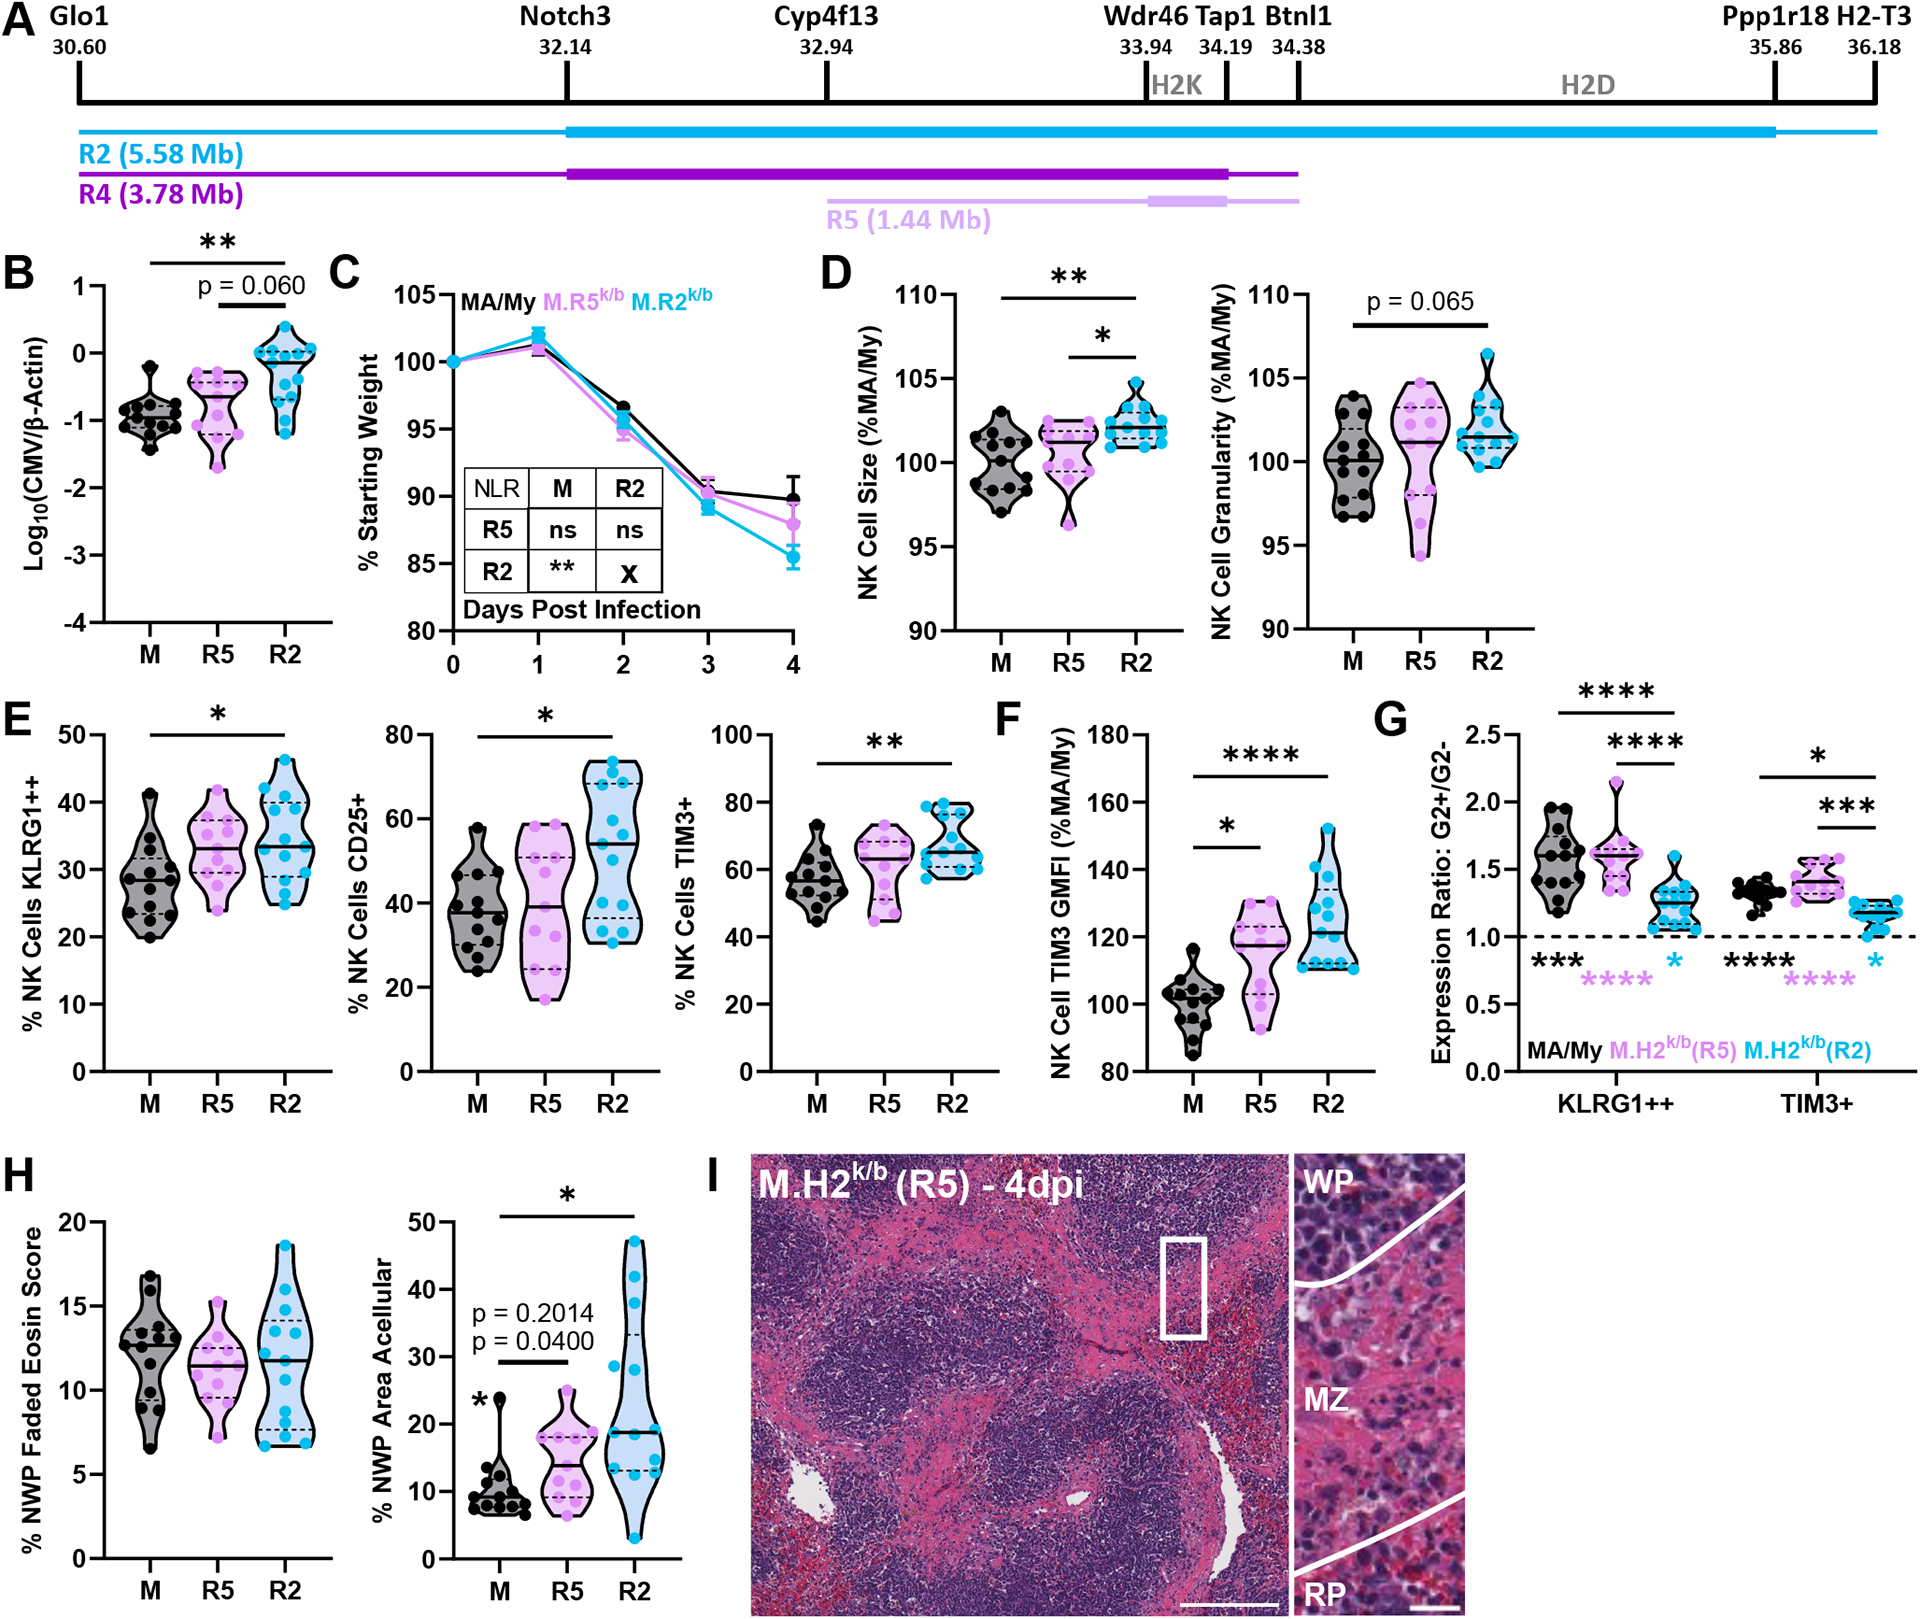
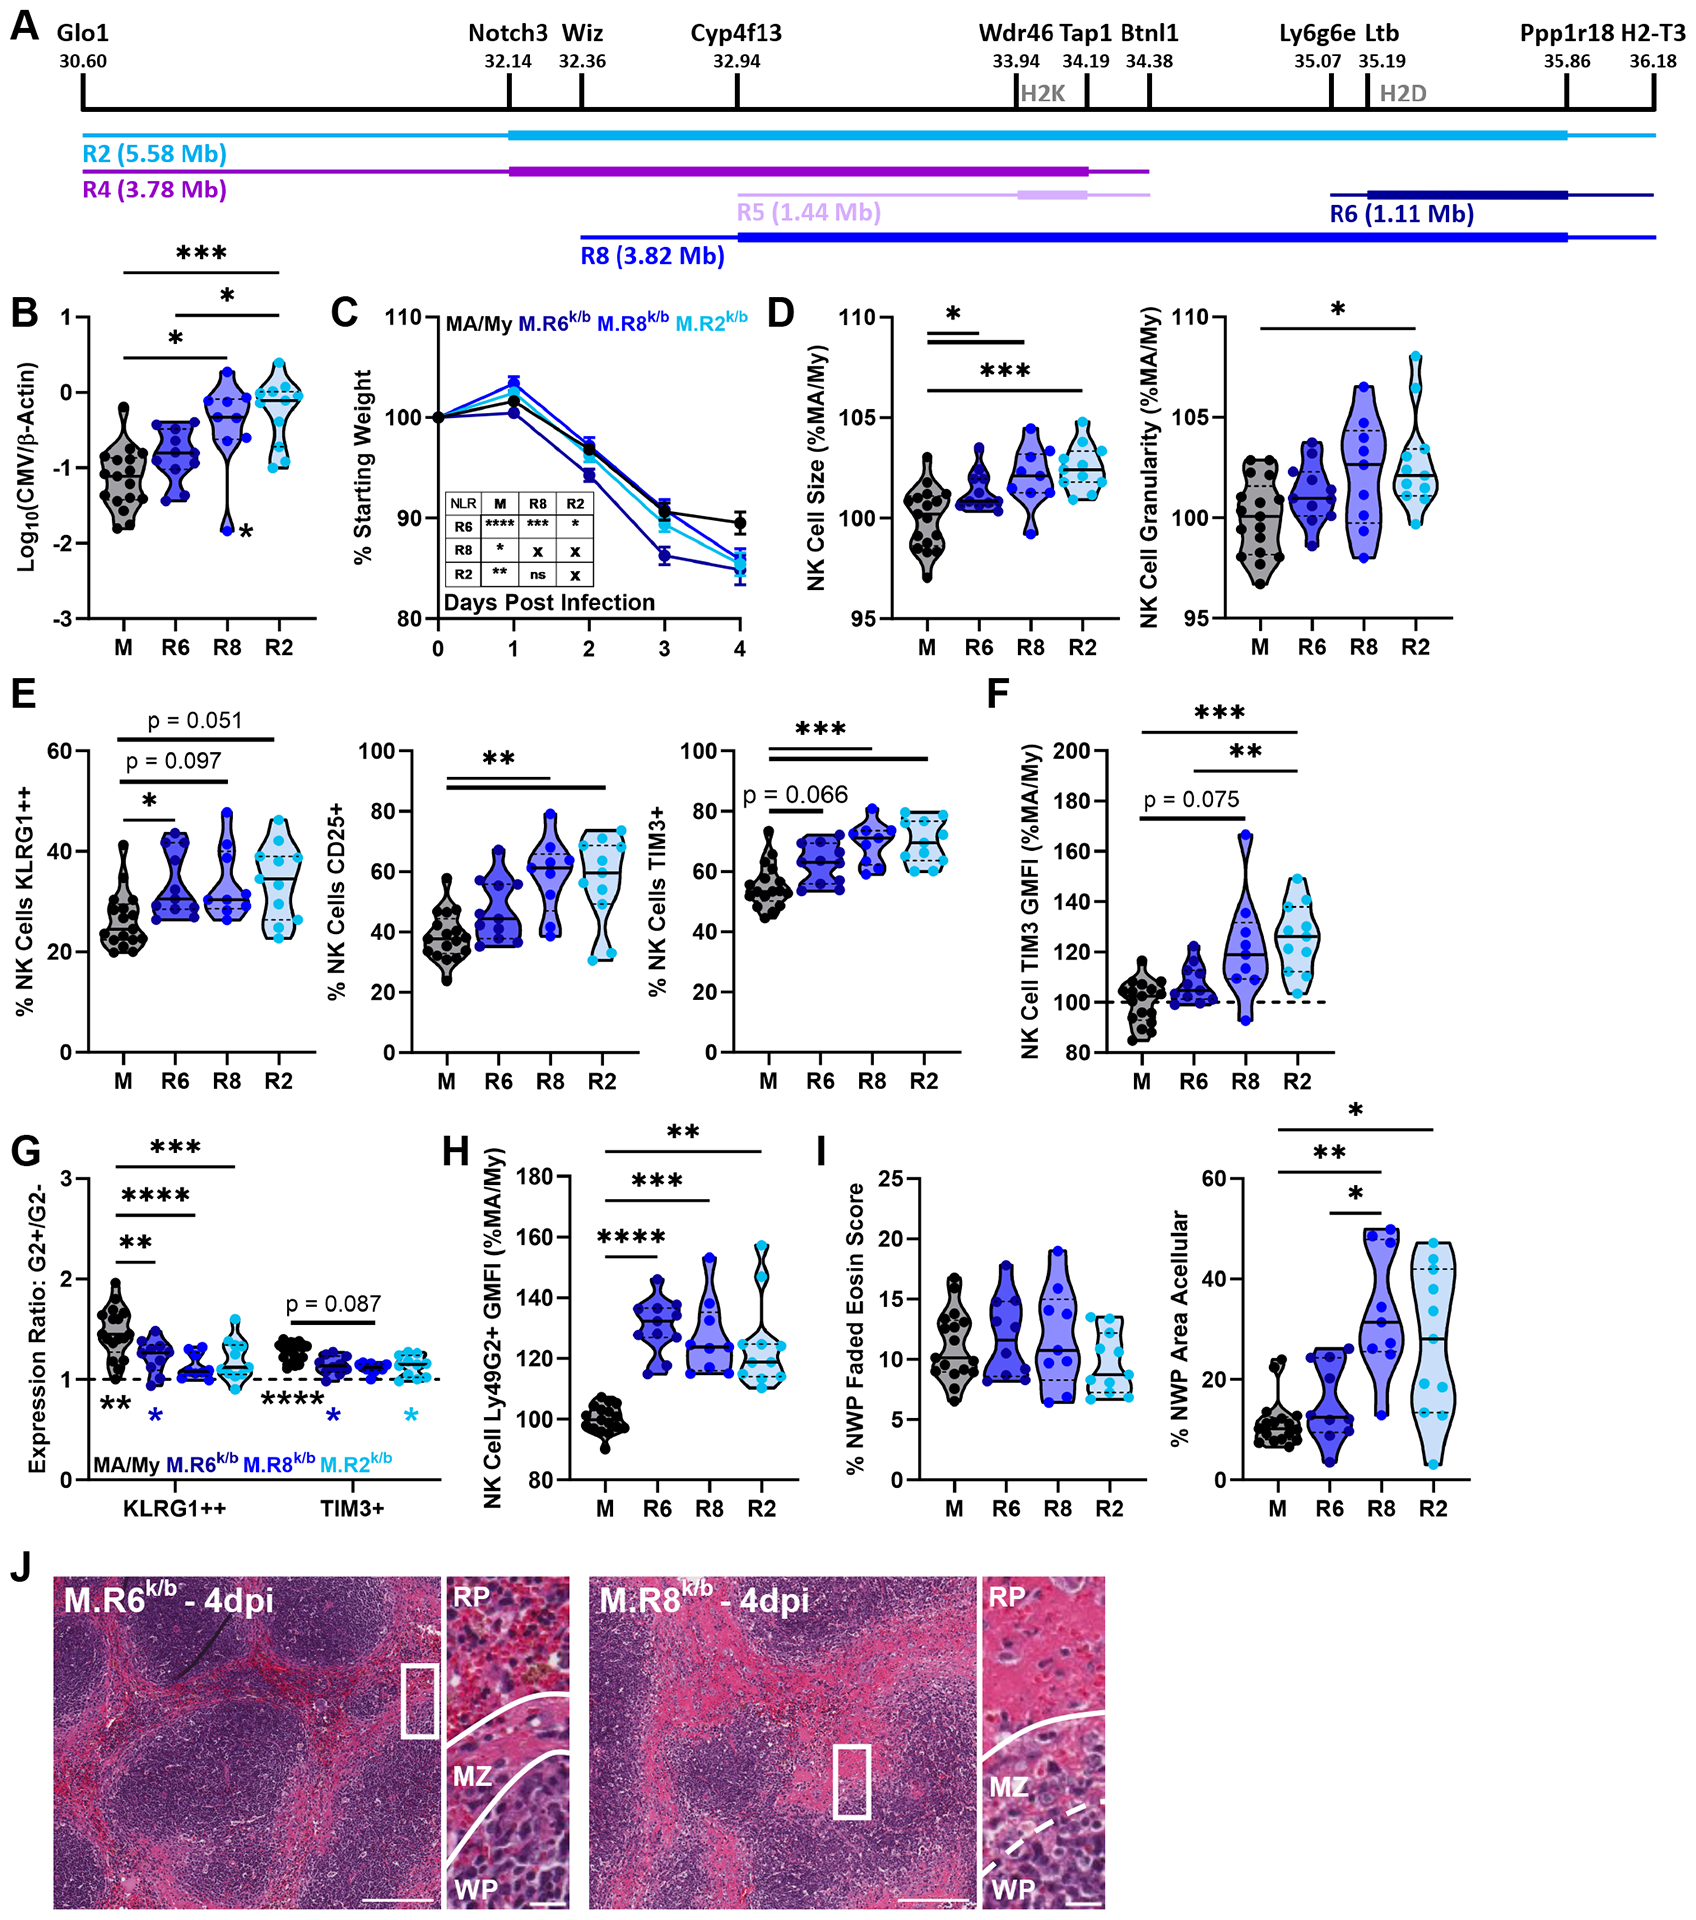
The MHC class I molecule H-2Dk conveys resistance to acute murine CMV infection in both C57L (H-2Dk transgenic) and MA/My mice. M.H2k/b mice are on an MA/My background aside from a C57L-derived region spanning the MHC (Cmv5s), which diminishes this resistance and causes significant spleen histopathology. To hone in on the effector elements within the Cmv5s interval, we generated several Cmv5-recombinant congenic mouse strains and screened them in vivo, allowing us to narrow the phenotype-associated interval >6-fold and segment the genetic mechanism to at least two independent loci within the MHC region. In addition, we sought to further characterize the Cmv5s-associated phenotypes in their temporal appearance and potential direct relationship to viral load. To this end, we found that Cmv5s histopathology and NK cell activation could not be fully mirrored in the MA/My mice with increased viral dose, and that marginal zone destruction was the first apparent Cmv5s phenotype, being reliably quantified as early as 2 d postinfection in the M.H2k/b mice, prior to divergence in viral load, weight loss, or NK cell phenotype. Finally, we further dissect NK cell involvement, finding no intrinsic differences in NK cell function, despite increased upregulation of activation markers and checkpoint receptors. In conclusion, these data dissect the genetic and immunologic underpinnings of Cmv5 and reveal a model in which polymorphism within the MHC region of the genome leads to the development of tissue damage and corrupts protective NK cell immunity during acute viral infection.


Figures

Figure 1.
Figure 1.. M.R2k/b Mice Bear Cmv5s MCMV Susceptibility and Spleen Tissue Damage.
(A) Schematic depicting the genetic origins of the Cmv5 recombinant MA/My-congenic mouse with inside and outside border locations for the M.R2k/b (R2) recombinant interval (also see Table S1). (B) Viral load by quantitative PCR from 4dpi spleen DNA. (C) Mouse weight loss during infection as % of starting weight, Error bars represent SEM. Representative images of H&E-stained spleen sections with quantification (NWP = non-white pulp) from uninfected (D) or 4dpi (E) mice of indicated strains. Zoomed insert contains lines highlighting borders between white pulp (WP)/marginal zone (MZ)/red pulp (RP) regions. Full image scale bar at 200 microns, insert scale bar at 20 microns. (F) 4dpi approximate spleen size (area, trapezoid), weight, and cellularity as splenocytes/mg tissue. Datapoint marked by asterisk identified as outlier by Grubb’s outlier test with alpha < 0.05, top p-value listed includes this outlier while bottom p-value omits it. Violin plots depict median (solid line) and quartile (dashed line) values. (B, C, E) pooled from 2 independent experiments with total 7–9 mice per group (2–5 males, 4–5 females), (D) pooled from 4 independent experiments with total 12–13 mice per group (3 males, 9–10 females), (F) pooled from 2 independent experiments with total 9–10 mice per group (4–5 males, 5 females). Statistical comparisons made using unpaired Welch’s t-test (B, D-F). Weight loss curves (C) are assessed by non-linear (cubic) regression (NLR) with an extra sum of squares F-test (inset table). * p < 0.05, ** p < 0.01, *** p < 0.001, **** p < 0.0001.
Figure 2.
Figure 2.. Cmv5s NK Cells Upregulate Activation Markers and Checkpoint Receptors at 4dpi but are not Dysfunctional.
(A, C-M) Flow cytometry data from splenocytes harvested at 4dpi, pre-gated as described in methods on NK cells or NK cells further segmented by expression of Ly49G2. (B) Approximate number of NK cells per spleen was calculated using flow cytometry, cell count, and spleen weight data. Datapoint marked by asterisk identified as outlier by Grubb’s outlier test with alpha < 0.05, top p-value listed includes this outlier while bottom p-value omits it. (G) G2+/G2− expression ratio, top statistics indicate differences in ratios between groups, bottom statistics indicate differences between ratio and y = 1 (statistical differences between G2+ and G2− values). (K) Total NK cells divided by their expression of 3 assessed checkpoint molecules: LG = LAG-3, TT = TIGIT, TM = TIM-3. (N) NK cells isolated from 4dpi spleens were stimulated in vitro and assessed by flow cytometry for CD107a expression (degranulation) and production of IFNγ. Violin plots depict median (solid line) and quartile (dashed line) values. (A, C-H) pooled from 2 independent experiments with total 7–9 mice per group (2–5 males, 4–5 females). (B, I-M) pooled from 2 independent experiments with total 9–10 mice per group (4–5 males, 5 females). (N) representative experiment shown from a total of 2 independent experiments (5 females). Statistical comparisons made using unpaired Welch’s t-test (A-F, H-J, L), 2-way ANOVAs with Sidak’s multiple comparisons test (G, K, M), or multiple unpaired Welch’s t-tests with Holm-Sidak corrections for multiple comparisons (N). * p < 0.05, ** p < 0.01, *** p < 0.001, **** p < 0.0001.
Figure 3.
Figure 3.. MA/My and M.R2k/b NK Cells are Similar in Phenotype and Function at Baseline.
(A) Approximate spleen size (area, trapezoid), (B) weight and cellularity as splenocytes/mg tissue in uninfected mice of indicated strain. (C-I) Flow cytometry data of splenocytes harvested from uninfected mice. (H) Datapoint marked by asterisk identified as outlier by Grubb’s outlier test with alpha < 0.05, top p-value listed includes this outlier while bottom p-value omits it. (J) NK cells isolated from uninfected spleens were stimulated in vitro and assessed by flow cytometry for CD107a expression (degranulation) and production of IFNγ. Violin plots depict median (solid line) and quartile (dashed line) values. (A) pooled from 2 independent experiments with total 9–10 mice per group (9–10 females), (B, E, F, H, I, J) data from 1 independent experiment with 5 mice per group (5 females). (C) pooled from 4 independent experiments with total 15–16 mice per group (3 males, 12–13 females). (D) pooled from 3 independent experiments with total 12–13 mice per group (3 males, 9–10 females). (G) pooled from 2 independent experiments with total 8 mice per group (3 males, 5 females). Statistical comparisons are made using an unpaired Welch’s t-test (A-E, H), an ordinary 2-way ANOVA with Tukey’s (G, I) or Sidak’s (F) multiple comparisons test. (J) was assessed by multiple unpaired Welch’s t-tests with Holm-Sidak correction for multiple comparisons. * p < 0.05, ** p < 0.01, *** p < 0.001, **** p < 0.0001.
Figure 4.
Figure 4.. Increased Viral Replication is Insufficient to Cause Cmv5s-like Tissue Damage and NK Cell Activation in MA/My Mice.
(A) Viral load by quantitative PCR from 4dpi spleen DNA. (B) Mouse weight loss during infection as % of starting weight, Error bars represent SEM. (C-G) Flow cytometry data from splenocytes harvested at 4dpi. (G) G2+/G2− expression ratio, top statistics indicate differences in ratios between groups, bottom statistics indicate differences between ratio and y = 1 (statistical differences between G2+ and G2− values). (H) Quantification of histology sections, NWP = non-white pulp. (I) Representative images of H&E-stained spleen sections at 4dpi with zoomed insert and lines highlighting borders between white pulp (WP)/marginal zone (MZ)/red pulp (RP) regions. Full image scale bar at 200 microns, insert scale bar at 20 microns. Violin plots depict median (solid line) and quartile (dashed line) values. Results are pooled from 2 individual experiments with total 6–9 mice per group (2–4 males, 3–5 females). See Figure S3 for details of data pooling and presentation. Statistical comparisons made using Brown-Forsythe and Welch ANOVA with Dunnett’s T3 multiple comparisons test (A, C-F, H), Ordinary 2-way ANOVA with Tukey’s multiple comparisons test (G), or non-linear (cubic) regression (NLR) with extra sum-of-squares F test (inset) (B). * p < 0.05, ** p < 0.01, *** p < 0.001, **** p < 0.0001.
Figure 5.
Figure 5.. Cmv5s Histopathology at the Marginal Zone Precedes Divergence in Viral Load and NK Cell Activation.
(A) Approximate spleen size (area, trapezoid) and cellularity represented as cells/mg spleen. (B) Viral load by quantitative PCR from 2dpi spleen DNA (C-H) Flow cytometry data from splenocytes harvested at 2dpi. (H) G2+/G2− expression ratio, bottom statistics indicate differences between ratio and y = 1 (statistical differences between G2+ and G2− values). (I) Quantification of histology sections, NWP = non-white pulp, (J) Representative images of H&E-stained spleen sections from different strains at 2dpi with zoomed insert and lines highlighting borders between white pulp (WP)/marginal zone (MZ)/red pulp (RP) regions. Full image scale bar at 200 microns, insert scale bar at 20 microns. Violin plots depict median (solid line) and quartile (dashed line) values. (A) Data pooled from 2 independent experiments with total 9–10 mice per group (9–10 males), (B, I) pooled from 5 independent experiments with total 22–23 mice per group (17–18 males, 5 females), (C, E) pooled from 4 independent experiments with total 17–18 mice per group (17–18 males), (F) pooled from 2 independent experiments with total 9 mice per group (9 males), (D, G, H) pooled from 3 independent experiments with total 13–14 mice per group (13–14 males). Statistical comparisons made using an unpaired Welch’s t-test (A-G, I), or an ordinary 2-way ANOVA with Sidak’s multiple comparisons test (H). * p < 0.05, ** p < 0.01, *** p < 0.001, **** p < 0.0001.
Figure 6.
Figure 6.. H2K/Mhc-II Region Cmv5 Recombinants Display Splenic Marginal Zone Damage.
(A) Schematic depicting the M.R4k/b (R4) (see Fig. S2) and M.R5k/b (R5) C57L-derived interval locations. (B) Viral load by quantitative PCR from 4dpi spleen DNA. (C) Mouse weight loss during infection as % of starting weight, Error bars represent SEM. NLR = non-linear regression. (D-G) Flow cytometry data from splenocytes harvested at 4dpi. (G) G2+/G2− expression ratio, top statistics indicate differences in ratios between groups, bottom statistics indicate differences between ratio and y = 1 (statistical differences between G2+ and G2− values). (H) Quantification of histology sections, NWP = non-white pulp. Datapoint marked by asterisk identified as outlier by Grubb’s outlier test with alpha < 0.05, top p-value listed includes this outlier while bottom p-value omits it. (I) Representative image of H&E-stained spleen sections at 4dpi with zoomed insert and lines highlighting borders between white pulp (WP)/marginal zone (MZ)/red pulp (RP) regions. Full image scale bar at 200 microns, insert scale bar at 20 microns. Violin plots depict median (solid line) and quartile (dashed line) values. Data pooled from 3 independent experiments with total 11–13 mice per group (4–5 males, 7–9 females). See Figure S3 for details of data pooling and presentation. Statistical comparisons are made using Brown-Forsythe and Welch ANOVA with Dunnett’s T3 multiple comparisons test (B, D-F, H), ordinary 2-way ANOVA with Tukey’s multiple comparisons test (G), or non-linear (cubic) regression (NLR) with extra sum-of-squares F test (inset) (C). * p < 0.05, ** p < 0.01, *** p < 0.001, **** p < 0.0001.
Figure 7.
Figure 7.. C57L-Derived H2D Locus is Not Sufficient to Convey MCMV Susceptibility or Tissue Damage.
(A) Schematic depicting the M.R6k/b (R6) and M.R8k/b (R8) C57L-derived interval locations. (B) Viral load by quantitative PCR from 4dpi spleen DNA. Datapoint marked by asterisk identified as outlier by Grubb’s outlier test with alpha < 0.05, p-value reaches significance with the outlier so an additional p-value omitting the value is not listed. (C) Mouse weight loss during infection as % of starting weight, Error bars represent SEM. (D-H) Flow cytometry data from splenocytes harvested at 4dpi. (G) G2+/G2− expression ratio, top statistics indicate differences in ratios between groups, bottom statistics indicate differences between ratio and y = 1 (statistical differences between G2+ and G2− values). (I) Quantification of histology sections, NWP = non-white pulp. (J) Representative images of H&E-stained spleen sections at 4dpi with zoomed insert and lines highlighting borders between white pulp (WP)/marginal zone (MZ)/red pulp (RP) regions. Full image scale bar at 200 microns, insert scale bar at 20 microns. Violin plots depict median (solid line) and quartile (dashed line) values. Data pooled from 3 independent experiments with total 9–17 mice per group (6–12 males, 3–5 females). See Figure S3 for details of data pooling and presentation. Statistical comparisons are made using Brown-Forsythe and Welch ANOVA with Dunnett’s T3 multiple comparisons test (B, D-F, H, I), ordinary 2-way ANOVA with Tukey’s multiple comparisons test (G), or non-linear (cubic) regression (NLR) with extra sum-of-squares F test (inset) (C). * p < 0.05, ** p < 0.01, *** p < 0.001, **** p < 0.0001.

Similar articles

Cited by

References

    1. Kenney AD, Dowdle JA, Bozzacco L, McMichael TM, St Gelais C, Panfil AR, Sun Y, Schlesinger LS, Anderson MZ, Green PL, Lopez CB, Rosenberg BR, Wu L, Yount JS. 2017. Human Genetic Determinants of Viral Diseases. Annu Rev Genet. 51:241–263. - PMC - PubMed
    1. Lanier LL 2005. NK Cell Recognition. Annu Rev Immunol. 23:225–274. - PubMed
    1. Long EO, Kim HS, Liu D, Peterson ME, Rajagopalan S. 2013. Controlling natural killer cell responses: integration of signals for activation and inhibition. Annu Rev Immunol. 31:227–258. - PMC - PubMed
    1. Kim S, Poursine-Laurent J, Truscott SM, Lybarger L, Song Y, Yang L, French AR, Sunwoo JB, Lemieux S, Hansen TH, Yokoyama WM. 2005. Licensing of natural killer cells by host major histocompatibility complex class I molecules. Nature. 436:709–713. - PubMed
    1. Boudreau JE, Hsu KC. 2018. Natural Killer Cell Education and the Response to Infection and Cancer Therapy: Stay Tuned. Trends Immunol. 39:222–239. - PMC - PubMed

Substances