

Leveraging inter-individual transcriptional correlation structure to infer discrete signaling mechanisms across metabolic tissues
- PMID: 38224289
- PMCID: PMC10945578
- DOI: 10.7554/eLife.88863
Leveraging inter-individual transcriptional correlation structure to infer discrete signaling mechanisms across metabolic tissues
Abstract
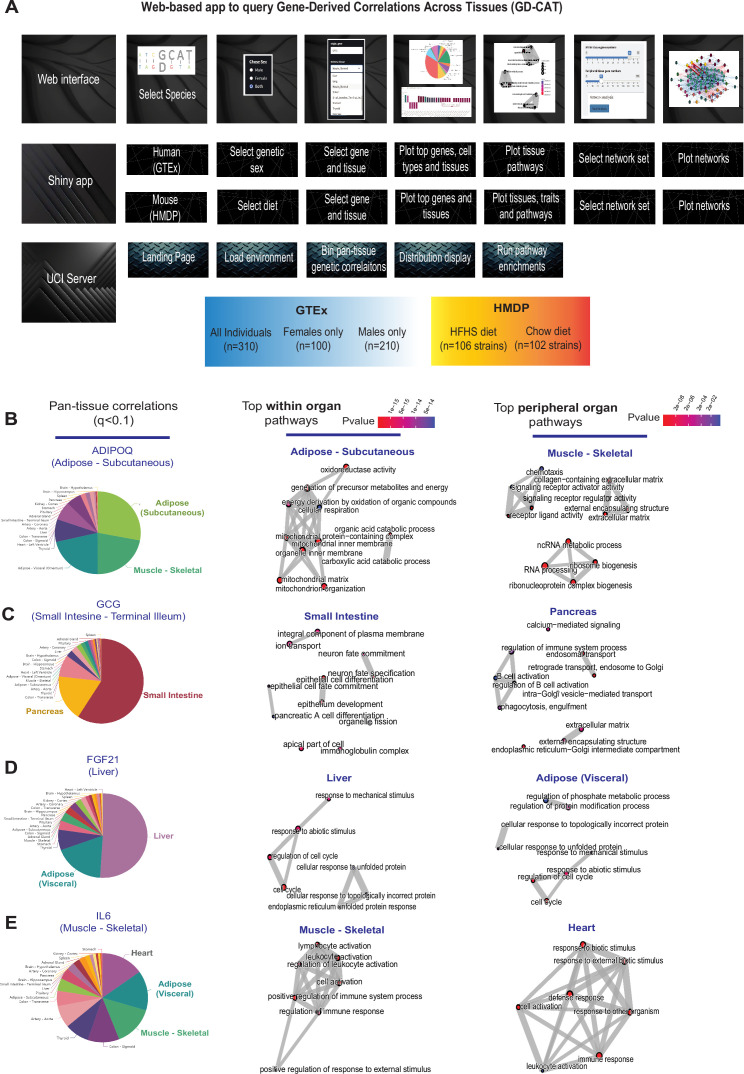
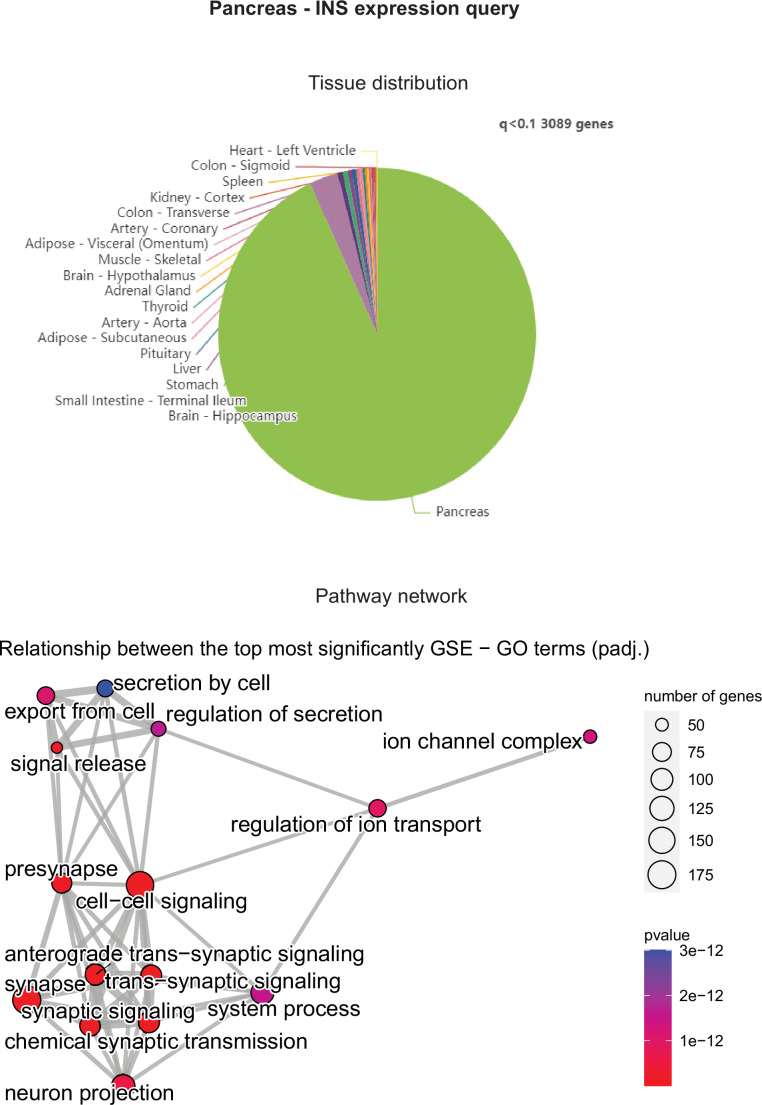
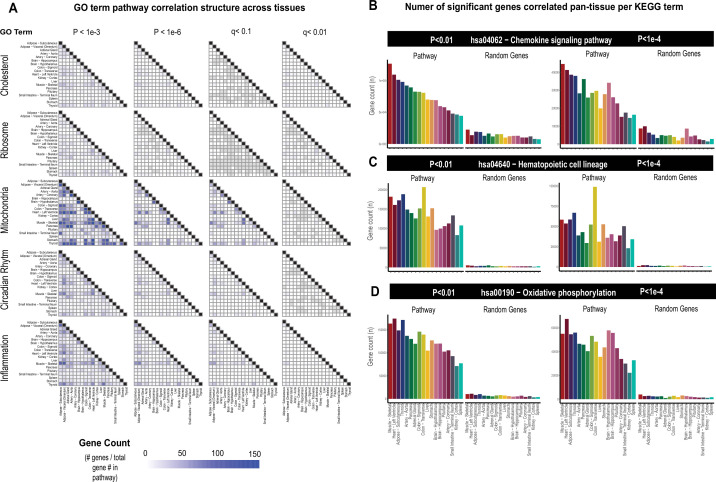
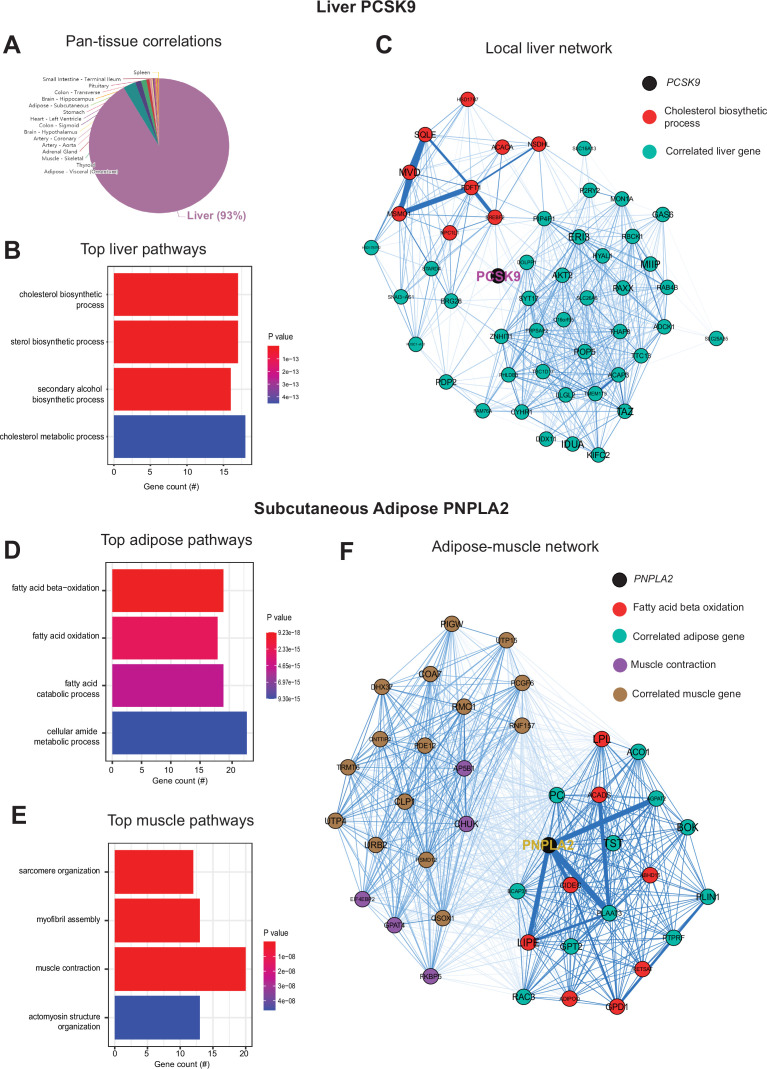
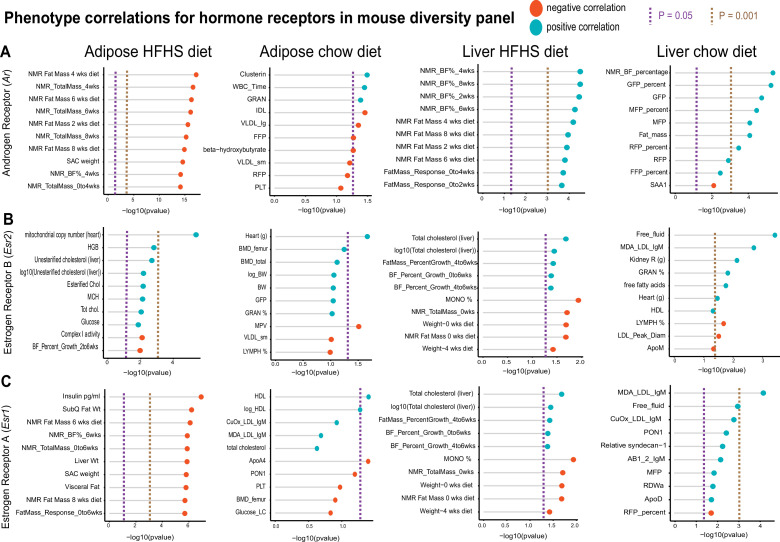
Inter-organ communication is a vital process to maintain physiologic homeostasis, and its dysregulation contributes to many human diseases. Given that circulating bioactive factors are stable in serum, occur naturally, and are easily assayed from blood, they present obvious focal molecules for therapeutic intervention and biomarker development. Recently, studies have shown that secreted proteins mediating inter-tissue signaling could be identified by 'brute force' surveys of all genes within RNA-sequencing measures across tissues within a population. Expanding on this intuition, we reasoned that parallel strategies could be used to understand how individual genes mediate signaling across metabolic tissues through correlative analyses of gene variation between individuals. Thus, comparison of quantitative levels of gene expression relationships between organs in a population could aid in understanding cross-organ signaling. Here, we surveyed gene-gene correlation structure across 18 metabolic tissues in 310 human individuals and 7 tissues in 103 diverse strains of mice fed a normal chow or high-fat/high-sucrose (HFHS) diet. Variation of genes such as FGF21, ADIPOQ, GCG, and IL6 showed enrichments which recapitulate experimental observations. Further, similar analyses were applied to explore both within-tissue signaling mechanisms (liver PCSK9) and genes encoding enzymes producing metabolites (adipose PNPLA2), where inter-individual correlation structure aligned with known roles for these critical metabolic pathways. Examination of sex hormone receptor correlations in mice highlighted the difference of tissue-specific variation in relationships with metabolic traits. We refer to this resource as
Keywords: endocrine; genetics; genomics; human; mouse; organ cross-talk; systems genetics.
Conflict of interest statement
MZ, IT, CV, JM, CN, IC, CJ, LV, YC, RY, HB, JL, NL, RP, CN, CJ, IM, JJ, NP, AH, LS, EK, DN, SM No competing interests declared, BP, MS Reviewing editor, eLife
Figures
Update of
-
Leveraging inter-individual transcriptional correlation structure to infer discrete signaling mechanisms across metabolic tissues.bioRxiv [Preprint]. 2023 Oct 4:2023.05.10.540142. doi: 10.1101/2023.05.10.540142. bioRxiv. 2023. Update in: Elife. 2024 Jan 15;12:RP88863. doi: 10.7554/eLife.88863. PMID: 37214953 Free PMC article. Updated. Preprint. No abstract available.
References
-
- Andreux PA, Williams EG, Koutnikova H, Houtkooper RH, Champy MF, Henry H, Schoonjans K, Williams RW, Auwerx J. Systems genetics of metabolism: the use of the BXD murine reference panel for multiscalar integration of traits. Cell. 2012;150:1287–1299. doi: 10.1016/j.cell.2012.08.012. - DOI - PMC - PubMed
-
- Battle A, Brown CD, Engelhardt BE, Montgomery SB, GTEx Consortium. Laboratory, Data Analysis &Coordinating Center (LDACC)—Analysis Working Group. Statistical Methods groups—Analysis Working Group. Enhancing GTEx (eGTEx) groups. NIH Common Fund. NIH/NCI. NIH/NHGRI. NIH/NIMH. NIH/NIDA. Biospecimen Collection Source Site—NDRI. Biospecimen Collection Source Site—RPCI. Biospecimen Core Resource—VARI. Brain Bank Repository—University of Miami Brain Endowment Bank. Leidos Biomedical—Project Management. ELSI Study. Genome Browser Data Integration &Visualization—EBI. Genome Browser Data Integration &Visualization—UCSC Genomics Institute, University of California Santa Cruz. Lead analysts. Laboratory, Data Analysis &Coordinating Center (LDACC) NIH program management. Biospecimen collection. Pathology. eQTL manuscript working group Genetic effects on gene expression across human tissues. Nature. 2017;550:204–213. doi: 10.1038/nature24277. - DOI - PMC - PubMed
-
- Bennett BJ, Farber CR, Orozco L, Kang HM, Ghazalpour A, Siemers N, Neubauer M, Neuhaus I, Yordanova R, Guan B, Truong A, Yang W, He A, Kayne P, Gargalovic P, Kirchgessner T, Pan C, Castellani LW, Kostem E, Furlotte N, Drake TA, Eskin E, Lusis AJ. A high-resolution association mapping panel for the dissection of complex traits in mice. Genome Research. 2010;20:281–290. doi: 10.1101/gr.099234.109. - DOI - PMC - PubMed
MeSH terms
Substances
Grants and funding
- DK097771/NH/NIH HHS/United States
- U24 DK097771/DK/NIDDK NIH HHS/United States
- F31DK134173-01A1/NH/NIH HHS/United States
- K99 HL138193/HL/NHLBI NIH HHS/United States
- DK120342/NH/NIH HHS/United States
- R01 DK109724/DK/NIDDK NIH HHS/United States
- F31 DK134173/DK/NIDDK NIH HHS/United States
- DK130640/NH/NIH HHS/United States
- DK109724/NH/NIH HHS/United States
- CA266042/NH/NIH HHS/United States
- DP1 DK130640/DK/NIDDK NIH HHS/United States
- DK063491/NH/NIH HHS/United States
- R00 HL138193/HL/NHLBI NIH HHS/United States
- U01 AG070959/AG/NIA NIH HHS/United States
- R37 CA266042/CA/NCI NIH HHS/United States
- K99 HD098330/HD/NICHD NIH HHS/United States
- AA029124/NH/NIH HHS/United States
- U54 DK120342/DK/NIDDK NIH HHS/United States
- P30 DK063491/DK/NIDDK NIH HHS/United States
- R01 AA029124/AA/NIAAA NIH HHS/United States
- HL138193/NH/NIH HHS/United States
- R00 HD098330/HD/NICHD NIH HHS/United States
