. 2024 Jan;166(1):129-142.
doi: 10.1007/s11060-023-04531-z. Epub 2024 Jan 15.

dCas9/CRISPR-based methylation of O-6-methylguanine-DNA methyltransferase enhances chemosensitivity to temozolomide in malignant glioma

Affiliations

dCas9/CRISPR-based methylation of O-6-methylguanine-DNA methyltransferase enhances chemosensitivity to temozolomide in malignant glioma

Serendipity Zapanta Rinonos et al. J Neurooncol. 2024 Jan.

Abstract

Background: Malignant glioma carries a poor prognosis despite current therapeutic modalities. Standard of care therapy consists of surgical resection, fractionated radiotherapy concurrently administered with temozolomide (TMZ), a DNA-alkylating chemotherapeutic agent, followed by adjuvant TMZ. O-6-methylguanine-DNA methyltransferase (MGMT), a DNA repair enzyme, removes alkylated lesions from tumor DNA, thereby promoting chemoresistance. MGMT promoter methylation status predicts responsiveness to TMZ; patients harboring unmethylated MGMT (~60% of glioblastoma) have a poorer prognosis with limited treatment benefits from TMZ.

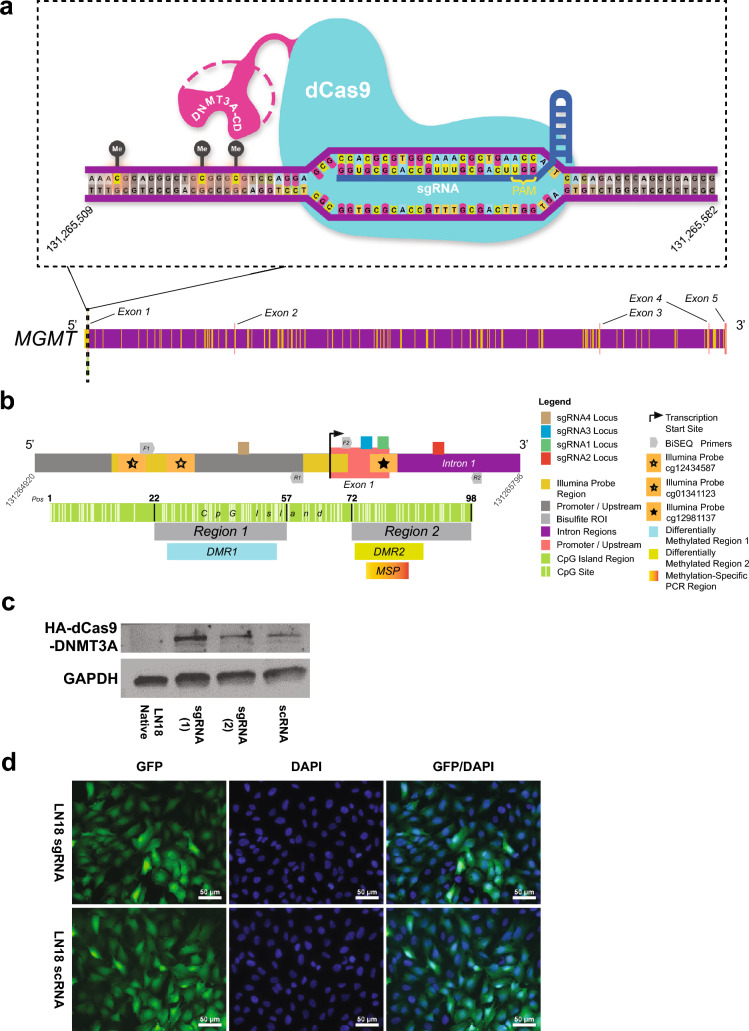
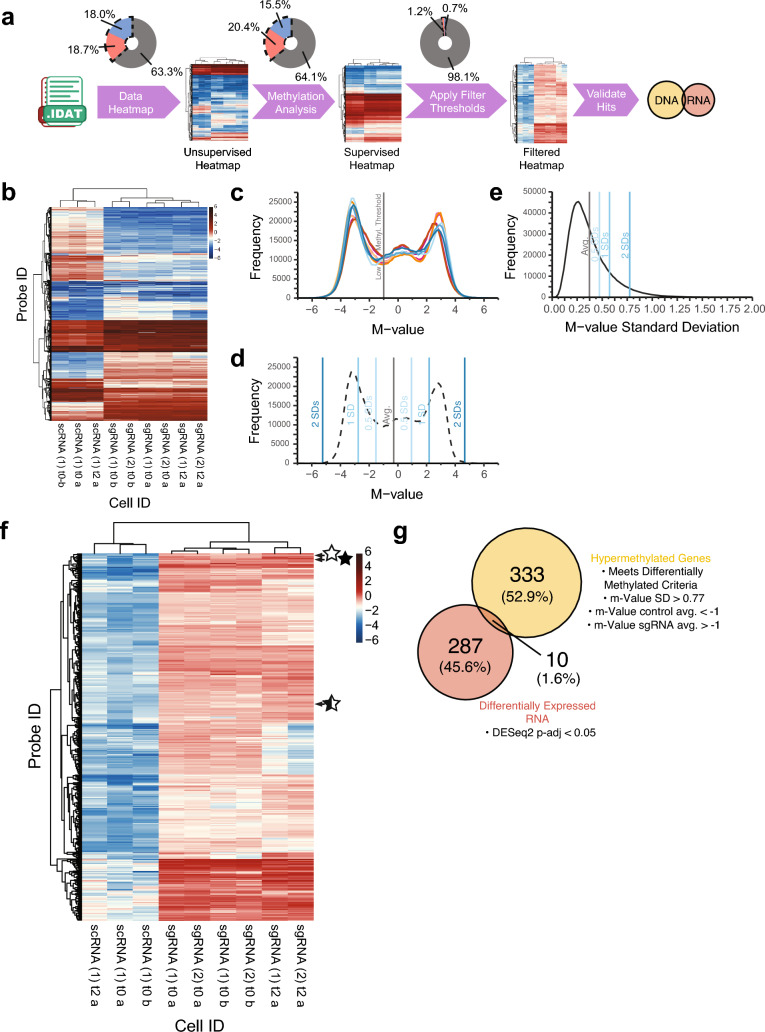
Methods: Via lentiviral-mediated delivery into LN18 glioma cells, we employed deactivated Cas9-CRISPR technology to target the MGMT promoter and enhancer regions for methylation, as mediated by the catalytic domain of the methylation enzyme DNMT3A. Methylation patterns were examined at a clonal level in regions containing Differentially Methylation Regions (DMR1, DMR2) and the Methylation Specific PCR (MSP) region used for clinical assessment of MGMT methylation status. Correlative studies of genomic and transcriptomic effects of dCas9/CRISPR-based methylation were performed via Illumina 850K methylation array platform and bulk RNA-Seq analysis.

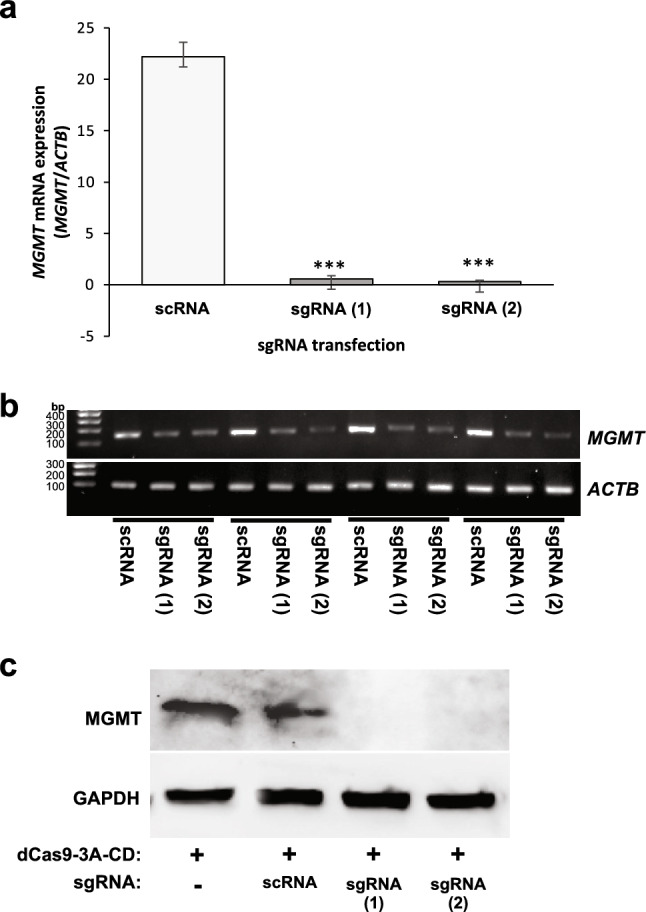
Results: We used the dCas9/DNMT3A catalytic domain to achieve targeted MGMT methylation at specific CpG clusters in the vicinity of promoter, enhancer, DMRs and MSP regions. Consequently, we observed MGMT downregulation and enhanced glioma chemosensitivity in survival assays in vitro, with minimal off-target effects.

Conclusion: dCas9/CRISPR is a viable method of epigenetic editing, using the DNMT3A catalytic domain. This study provides initial proof-of-principle for CRISPR technology applications in malignant glioma, laying groundwork for subsequent translational studies, with implications for future epigenetic editing-based clinical applications.

Keywords: CRISPR therapeutics; Chemoresistance; Epigenetics; MGMT; Malignant glioma/glioblastoma (GBM); Methylation.


Conflict of interest statement

SZR, TL, STP, and AL have a U.S. Provisional Patent Application No. 63/429348 entitled TARGETED EPIGENETIC EDITING AS NOVEL THERAPY FOR MALIGNANT GLIOMA, filed on 12/1/2022. Official patent filing is currently in process, as of the time of manuscript submission. TJP, BSCE and BMK declare no potential conflicts of interest. LML is a board member and stock holder of ClearPoint Neuro, on the medical advisory board of InSightec, a paid consultant for ImmPact Bio, and has received research funding through UCLA from Northwest Biotherapeutics. PLN has contracts with UCLA for the Brain Tumor Program with BMS, Chimerix, Erasca, Springsworks, and Recursion. TFC is cofounder, major stock holder, consultant and board member of Katmai Pharmaceuticals, member of the board and paid consultant for the 501c3 Global Coalition for Adaptive Research, holds stock in Chimerix and receives milestone payments and possible future royalties, member of the scientific advisory board for Break Through Cancer, member of the scientific advisory board for Cure Brain Cancer Foundation, has provided paid consulting services to Sagimet, Clinical Care Options, Ideology Health, Servier, Jubilant, Immvira, Gan & Lee, BrainStorm, Katmai, Sapience, Inovio, Vigeo Therapeutics, DNATrix, Tyme, SDP, Novartis, Roche, Kintara, Bayer, Merck, Boehinger Ingelheim, VBL, Amgen, Kiyatec, Odonate Therapeutics QED, Medefield, Pascal Biosciences, Bayer, Tocagen, Karyopharm, GW Pharma, Abbvie, VBI, Deciphera, VBL, Agios, Genocea, Celgene, Puma, Lilly, BMS, Cortice, Wellcome Trust, Novocure, Novogen, Boston Biomedical, Sunovion, Human Longevity, Insys, ProNai, Pfizer, Notable labs, Medqia Trizel, Medscape and has contracts with UCLA for the Brain Tumor Program with Oncovir, Merck, Oncoceutics, Novartis, Amgen, Abbvie, DNAtrix, Beigene, BMS, AstraZeneca, Kazia, Agios, Boston Biomedical, Deciphera, Tocagen, Orbus, AstraZeneca, Karyopharm. The Regents of the University of California (TFC employer) has licensed intellectual property co-invented by TFC to Katmai Pharmaceuticals.

Figures

Fig. 1
Fig. 1
Schematic overview and verification of the dCas9/DNMT3A catalytic domain CRISPR-based methylation system in LN18 human glioma cells. a Schematic representation of the dCas9-DNMT3A-CD complex bound to a segment of DNA at the MGMT gene on chromosome 10. Deactivated Cas9 (dCas9) is unable to cut DNA and is fused to the DNMT3A catalytic domain. Single guide RNA (sgRNA) sequences (blue) can bind to complementary sequences within the genome, which permits dCas9 (teal) to be able to recognize and bind to DNA (purple). Once bound, DNMT3A-CD (magenta) can then induce methylation in CpG sites (represented as the “Me” labeled black circles) upstream of sgRNA complementary sequences. b Map of MGMT CpG island, 762 bp in length, encompassing promoter, exon 1, enhancer, and intron 1 regions. Comprehensive map of the MGMT gene with superimposed locations of Illumina probes (yellow boxes) as well as exon (salmon), intron (purple), and promoter/upstream (gray) regions. Locations of complementary sequences to the four sgRNAs are as shown. Open star, half-closed star and closed star regions indicate locations of differentially methylated Illumina probes. F1/R1 and F2/R2 indicate nested PCR primer pairs for Region 1 and Region 2, respectively. Inset: MGMT CpG island (individual CpG sites in light green) and relative locations of Region 1 and Region 2. CpG sites 22, 57, 72, and 96 indicate the specific sites flanking each region, numbered in order from 5′ to 3′ within the CpG island. Differentially methylated regions are shown (DMR1 and DMR2), located within assayed Region 1 and 2, respectively. MSP region is also shown within DMR2. Genetic regions and positions on Chromosome 10 were determined using the UCSC genome browser (GRCh37/hg19 assembly) and the 850K array probe annotation file provided by Illumina. c Verification of dCas9-DNMT3A-CD (d3A) protein expression in LN18 human glioma cells. Western blot images of HA-tagged d3A fusion protein in LN18 cells sequentially transduced with pLVP-dCas9-DNMT3A-CD-V2 and pLenti-sgRNA-GFP (versus native cell line as negative control with no transduced constructs); representative blot shown here (from at least three replicate experiments). “scRNA” indicates scrambled sgRNA transduction; “sgRNA(1)” and “sgRNA(2)” indicate replicate samples derived from cells with MGMT-sgRNA 1, 2, 3 and 4 transduction. Expected size of the d3A fusion protein is approximately in the 200 kDa range, as shown, using anti-HA antibody-mediated detection. GAPDH served as the loading control. d Verification of sgRNA-GFP lentiviral transduction in LN18 human glioma cells. Representative fluorescent microscopic images (×40 magnification) of the same LN18 cell lines in part c demonstrating GFP signal detection in cells transduced with GFP-tagged pLenti-sgRNA (LN18sgRNA1, 2, 3, 4) vs. the scrambled sgRNA GFP-tagged pLenti-scRNA (LN18 scRNA). DAPI shown as nuclear stain, with merged images in far-right column. Scale bar as shown (50 μm)
Fig. 2
Fig. 2
Bisulfite sequencing of representative clones with induced methylation patterns of CpG sites at CRISPR-targeted regions within the MGMT CpG island. a Lollipop schematic illustrating the distribution of CpG methylation sites in each representative clonal population (red circle = methylated site; gray circle = unmethylated site). Genomic DNA from LN18 cells containing either d3A/scRNA or d3A/sgRNA underwent sodium bisulfite treatment, followed by nested PCR amplification. Region 1 contains the target binding region for sgRNA 4 (as indicated by “4”); Region 2 contains the target binding regions for sgRNA 1, 2, and 3 (as indicated by “1”, “2” and “3”, respectively). Region 1 contains DMR1; Region 2 contains DMR2 and the MSP region. Amplicons of Region 1 and Region 2 were obtained separately and used to generate individual clones for each region via TA cloning. Abbreviations for individual clone nomenclature: “scRNA” indicates clones transduced with scrambled sgRNA; “sgRNA” indicates clones transduced with sgRNA1, 2, 3, and 4. Numbers preceding “scRNA” or “sgRNA” designation indicate individual clone numbers. Each row of the schematic (per category, scRNA or sgRNA) represents a single clone. The composite row displays a summary of the relative frequencies of methylation at each CpG site amongst the assayed clones. Regional CpG sites as per Malley et al. [18]: DMR1 = CpG 25–50; DMR2 = CpG 73–90; MSP = CpG 76–87 (MSP-F = CpG 76–80; MSP-R = CpG 84–87). Core/minimal promoter = CpG 50–62; Enhancer = CpG 82–87. Refer to Table S2 (Supplementary Information, Online Resource 2) for details. b BiSEQ chromatograms of representative clones, demonstrating methylation of target DNA sequences within the MGMT CpG island, derived from LN18 cells transduced with dCas9/DNMT3A-CD plus sgRNA constructs. Blue arrows indicate CpG sites that are methylated (converted from T-G to C-G). Region 1 includes the sequence targeted by sgRNA4 (4). Region 2 includes the sequence targeted by sgRNA 1, 2 and 3 (1, 2, 3)
Fig. 3
Fig. 3
Expression of MGMT mRNA and protein in LN18 human glioma cells with CRISPR-mediated MGMT methylation via dCas9-DNMT3A-CD and MGMT-specific sgRNAs. a MGMT mRNA expression detected by RT-qPCR in LN18 cells expressing d3A/sgRNA targeted towards MGMT. Top: qPCR bar figure of expression mean ± SEM (from a total of four repeated experiments). b DNA gel electrophoresis images of corresponding qPCR for MGMT end products (from four separate experiments). Actin B (ACTB) served as the internal control. c Western blot analysis of MGMT expression levels in LN18 cells. GAPDH was used as the loading control. Representative results are shown here (from a total of four replicate experiments for scRNA and sgRNA-expressing lysates); additional negative control included in this blot is protein lysate from LN18 cells expressing dCas9-DNMT3A-CD fusion protein only, without scRNA or sgRNA construct (first lane). Abbreviations: scRNA = cells transduced with scrambled sgRNA, sgRNA = cells transduced with sgRNA 1, 2, 3 and 4. (1), (2) = replicate samples
Fig. 4
Fig. 4
Effects of dCas9-DNMT3A-CD/MGMT-specific sgRNA targeted methylation on the sensitivity of glioma cells to TMZ. MTT and clonogenic assays demonstrate effects of d3A/sgRNA CRISPR-based methylation on the survival of LN18 glioma cells treated with TMZ in vitro. The “n” indicates the number of separate experiments performed for each cell type. Results were normalized to the average negative control treatment condition (drug vehicle DMSO). TMZ concentrations ranged from 25 to 100 μM. Horizontal bars for all figures represent post hoc Tukey’s multiple comparisons test results for groups of interest following two-way ANOVA (“ns” indicates “p > 0.05”; * indicates p ≤ 0.05; ** indicates p ≤ 0.01; *** indicates p ≤ 0.001; **** indicates p ≤ 0.0001). Black bars = d3A/scRNA cells (negative control); gray bars = d3A/sgRNA cells (with full sgRNA constructs 1, 2, 3, and 4); white bars = Cas9/sgRNA1 + 2 cells (KO) (MGMT knockout via Cas9, with sgRNA constructs 1 and 2). a TMZ sensitivity measured via MTT survival assays in LN18 cells co-expressing d3A and MGMT-targeting sgRNAs compared to scRNA. Differences were observed between sgRNA treated cells (ANOVA, F(1, 74) = 213.3, p < 0.0001) and applied TMZ concentration (ANOVA, F(2, 74) = 93.52, p < 0.0001); an interaction was also observed between sgRNA/scRNA and TMZ (ANOVA, F(2, 74) = 86.92, p < 0.0001). MTT cell survival was calculated by subtracting 560 nm readings from 550 nm readings for TMZ-treated cells (25 and 100 μM, 5 days) versus DMSO treatment control condition, followed by normalization to the average control condition. b Effect of sgRNA methylation-mediated TMZ sensitivity (ANOVA, F(1, 8) = 134.9, p < 0.0001) was comparable between dCas9-DNMT3A-CD vs. Cas9-mediated MGMT knockout (KO) cells (ANOVA, F(1, 8) = 2.843, p = 0.1303) when evaluated via MTT survival assays. c Clonogenic assay revealed TMZ sensitivity results comparable to MTT (ANOVA, F(2, 56) = 186.2, p < 0.0001). Two-way ANOVA results revealed an effect of sgRNA treatment (F(1, 56) = 287.5, p < 0.0001) as well as an interaction between TMZ sensitivity and sgRNA treatment (F(2, 56) = 124.8, p < 0.0001). d Clonogenic assay demonstrated similar results to b with increased TMZ sensitivity in dCas9-DNMT3A-CD and Cas9-mediated MGMT knockout (KO) cells (ANOVA, F(1, 8) = 685.1, p < 0.0001). Two-way ANOVA also showed a difference between the dCas9 and Cas9 systems (F(1, 8) = 9.587, p = 0.0147) as well as an interaction between system and TMZ sensitivity (F(1, 8) = 9.587, p = 0.0147)
Fig. 5
Fig. 5
Validation of CRISPR-based dCas9-DNMT3A-CD targeted MGMT hypermethylation and differential RNA expression via correlation of Illumina EPIC 850K methylation array and RNA-Seq analysis. a Overview of the Illumina pipeline and generation of supervised hierarchical heatmaps. Raw data from the Illumina array (.idat files) were imported into R and matched to the Illumina annotation manifest by probe. Methylation values by probe were passed through a quality control check, CpG sites with single nucleotide polymorphisms (SNPs) were removed, and the data was normalized. These data were then clustered for methylation state by sample and probe ID using M-values with high variance (>2.5 SDs), for unsupervised heatmap generation. Probes were further isolated by adjusted p-value < 0.05 (linear fit and eBayes analysis) for supervised heatmap generation. “On Target” and “Off Target” probes were identified by further filtering the supervised differential methylation data by M-values with high variance across samples (>2 SDs) and a low control average M-value (<−1) and high sgRNA average M-value (>−1). These genes were cross referenced with bulk RNA-Seq differential expression data (evaluated via DESeq2) to determine functionally significant “On Target” and “Off Target” hits. Each step shows a donut plot of approximate percentage of genes from the total array that emerged from the filter criteria for that step, with hypermethylation shown in red, hypomethylation shown in blue, and no change (under that criterion) shown in gray. b Unsupervised hierarchical clustering of M-values by Illumina probe (rows) and LN18 cell treatment (columns). M-value variance (standard deviation) across cell type for each probe was calculated for the entire Illumina 850K array and probes with the highest level of variance (2.5 SDs > average M-value SD; N = 21,278) were isolated and plotted as a heatmap. Definition of nomenclature: (1), (2) = replicates; t0 = baseline harvest time point (corresponds to approximately 2 weeks after final lentiviral transduction, in this case, s/p GFP-sgRNA or GFP-scRNA transduction); t2 = harvested 2 months after t0; a = indicates samples run on first array batch; b = indicates samples run on second array batch, subsequent to first array. (We performed two separate arrays, at different times, distinguished here by a and b.) c Raw M-value distributions for all Illumina probes and cell samples. Control LN18 scRNA samples are shown by the blue traces (scRNA (1) t0 a, traces scRNA (1) t2 a, traces scRNA (1) t0 b) traces, while the LN18 sgRNA samples are shown by the magenta traces (sgRNA) (1) t0 a, (sgRNA) (1) t2 a, (sgRNA) (1) t0 b) and orange traces (sgRNA) (2) t0 a, (sgRNA) (2) t2 a, (sgRNA) (2) t0 b) traces. The approximate cutoff point for the first peak and “low methylation” threshold is indicated by the vertical gray line (−1). d Average trace of all control LN18 NSC samples, with the average M-value across all probes indicated by the vertical gray line. Vertical blue lines represent M-value standard deviations of varying degrees above and below this average. e Distribution of M-value variance for all Illumina probes across all samples, with summary statistics similar to panel d superimposed. These M-value distribution plots were used for establishing thresholds for determining large increases in methylation state between control LN18 scRNA and sgRNA samples. f Following validation via unsupervised hierarchical clustering and generation of an initial supervised heatmap (refer to pipeline in a and Methods), we applied additional filtering for hierarchical clustering of all CpG island probes found to be differentially methylated according to the following criteria: (1) p-adj < 0.05, (2) found in CpG island region, (3) exhibited an increase in methylation M-value from control LN18 scRNA to sgRNA cells greater than 2 standard deviations above the average M-value variance (SD) in all cells/probes, and (4) contained an average control LN18 scRNA methylation M-value of less than −1. Of these criteria, three probes within the MGMT gene were identified: cg12434587 (open star), cg01341123 (half-closed star), and cg12981137 (closed star), all of which were near sgRNA loci (see Fig. 1). g Of all the probes surveyed in a, 333 unique genes were identified and intersected with DESeq2 differential expression bulk RNA-Seq data (Wald test, p-adj < 0.05). Genes found in both data sets were deemed to be “On-Target and Off-Target” effects, which included MGMT and nine other genes (refer to Results main text for details)

Similar articles

Cited by

References

    1. Ceccarelli M, Barthel FP, Malta TM, et al. Molecular profiling reveals biologically discrete subsets and pathways of progression in diffuse glioma. Cell. 2016;164:550–563. doi: 10.1016/j.cell.2015.12.028. - DOI - PMC - PubMed
    1. Hegi ME, Diserens A-C, Gorlia T, et al. MGMT gene silencing and benefit from temozolomide in glioblastoma. N Engl J Med. 2005;352:997–1003. doi: 10.1056/NEJMoa043331. - DOI - PubMed
    1. Hegi ME, Liu L, Herman JG, et al. Correlation of O6-methylguanine methyltransferase (MGMT) promoter methylation with clinical outcomes in glioblastoma and clinical strategies to modulate MGMT activity. J Clin Oncol. 2008;26:4189–4199. doi: 10.1200/JCO.2007.11.5964. - DOI - PubMed
    1. Ostrom QT, Gittleman H, Liao P, et al. CBTRUS Statistical Report: Primary brain and other central nervous system tumors diagnosed in the United States in 2010–2014. Neuro Oncol. 2017;19:v1–v88. doi: 10.1093/neuonc/nox158. - DOI - PMC - PubMed
    1. Reifenberger G, Hentschel B, Felsberg J, et al. Predictive impact of MGMT promoter methylation in glioblastoma of the elderly. Int J Cancer. 2012;131:1342–1350. doi: 10.1002/ijc.27385. - DOI - PubMed

MeSH terms