. 2024 Apr 12;52(6):3050-3068.
doi: 10.1093/nar/gkae022.

Nucleolar detention of NONO shields DNA double-strand breaks from aberrant transcripts

Affiliations

Nucleolar detention of NONO shields DNA double-strand breaks from aberrant transcripts

Barbara Trifault et al. Nucleic Acids Res. .

Abstract

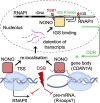
RNA-binding proteins emerge as effectors of the DNA damage response (DDR). The multifunctional non-POU domain-containing octamer-binding protein NONO/p54nrb marks nuclear paraspeckles in unperturbed cells, but also undergoes re-localization to the nucleolus upon induction of DNA double-strand breaks (DSBs). However, NONO nucleolar re-localization is poorly understood. Here we show that the topoisomerase II inhibitor etoposide stimulates the production of RNA polymerase II-dependent, DNA damage-inducible antisense intergenic non-coding RNA (asincRNA) in human cancer cells. Such transcripts originate from distinct nucleolar intergenic spacer regions and form DNA-RNA hybrids to tether NONO to the nucleolus in an RNA recognition motif 1 domain-dependent manner. NONO occupancy at protein-coding gene promoters is reduced by etoposide, which attenuates pre-mRNA synthesis, enhances NONO binding to pre-mRNA transcripts and is accompanied by nucleolar detention of a subset of such transcripts. The depletion or mutation of NONO interferes with detention and prolongs DSB signalling. Together, we describe a nucleolar DDR pathway that shields NONO and aberrant transcripts from DSBs to promote DNA repair.


Figures

Graphical Abstract
Graphical Abstract
Figure 1.
Figure 1.
DNA damage induces RNAPII-dependent nucleolar transcripts in U2OS cells. (A) Imaging and quantitation (line scans) of HA-NONO variants and fibrillarin. Arrowhead, co-localization; R = Pearson correlation. (B) Scheme of human rDNA array (∼80 repeats on chromosomes 13, 14, 15, 21, 22). IGS 20–42, probe positions in kilobases downstream of the rDNA TSS. (C) Scatter plot displaying mNET-seq reads for the IGS (left) and the top 1000 expressed protein-coding genes (right). Green box, induced transcripts. (D) mNET-seq browser tracks for IGS consensus region 20–28 from inputs (IN, merged) or after IP with CTD S2P-selective antibody ± etoposide. Grey, Alu element; green, induced region. (E) CTD S2P ChIP with site-specific primers. (F) Immunoblots detecting total RNAPII, CTD S2P and γH2A.X. Vinculin = loading control. (G) RT–qPCR assessing transcript levels from total RNA ± etoposide or pre-treatment with ATM inhibitor. (H) Imaging of Quasar570 RNA-FISH signals originating at IGS-22 upon ectopic expression of GFP–NPM1. (I) as in (H) without ectopic expression of GFP–NPM1. White box, zoom. (J) Quantitation of (H) and (I). Each dot represents the percentage of cells with Quasar570-positive signals as the average from two acquisitions. More than 100 cells were assessed. *P-value < 0.05; **P-value < 0.001; two-tailed t-test; n.d., not detected. Error bar, mean ± SD. Representative images are shown. n = number of biological replicates.
Figure 2.
Figure 2.
Elevated levels of H3K4me3 marks and R-loops correlate with NONO IGS occupancy in U2OS cells. (A) H3K4me3 ChIP using site-specific primers. (B) Imaging and quantitation of PLA signals (left) or indirect immunofluorescence signals (right) for H3K4me3/NCL. Each dot represents one acquisition. n, number of cells; white box, zoom. (C and D) Quantitative PCR of DNA immunopurified from DRIP-qPCR using S9.6 antibody and region-specific primers upon etoposide pulse–chase (C) or RNase H digestion/pre-treatment with THZ1 (D). (E) DRIP-qPCR using V5 antibody and region-specific primers after transient transfection with ppyCAG-V5-RNaseH1 D210N plasmid. (F) NONO ChIP using site-specific primers. (G) Pull-down assay displaying recombinant (rec)-NONO by immunoblotting after IP with biotin end-labelled (Bio) and immobilized gapmers. Silver stain and immunoblot of input (IN), loading controls; StrAv, streptavidin. (H) Pull-down assay displaying [γ-32P]ATP-end-labelled (32P*) gapmers by autoradiography after IP with immobilized HA-NONO variants FL and ΔRRM1, and PAGE separation. Silver stain and immunoblot, loading controls; dashed line, background; a.u., arbitrary units. *P-value < 0.05; **P-value < 0.001; two-tailed t-test. Error bar, mean ± SD. Representative images are shown. n = number of biological replicates.
Figure 3.
Figure 3.
DNA damage reduces promoter-associated occupancy of NONO and RNAPII activity in U2OS cells. (A) Imaging (left) and quantitation (right) of PLA signals for NONO/RNAPII or NONO/SPT5. Each dot represents one acquisition. n, number of cells; a.u., arbitrary units. (B) NONO CUT&RUN-seq at the TSS of the top 1000 expressed genes. Red, promoter region. (C) Browser tracks of NONO and histone H3 Lys4 tri-methylation (H3K4me3) CUT&RUN-seq. Red, promoter region. (D) 4sU-seq read counts for the gene body of 863 highly expressed genes. *P-value < 0.05; **P-value < 0.001; two-tailed t-test. Error bar, mean ± SD. Representative images are shown. n = number of biological replicates.
Figure 4.
Figure 4.
NONO mediates the nucleolar accumulation of transcripts in U2OS cells. (A) Schematic displaying APEX-seq in U2OS:GFP-APEX2-NIK3 cells. StrAv, streptavidin; H2O2, hydrogen peroxide. (B) Imaging (left) and RGB profiler line scans (right) of GFP and NONO in U2OS:GFP-APEX2-NIK3 cells. R = Pearson correlation; n.d., not detected; arrowhead, pan-nuclear NONO. Representative images are shown. (C) Immunoblots detecting NONO, SFPQ, PSPC1, GFP–APEX2-NIK3 and fibrillarin upon incubation with biotin–phenol, H2O2 from whole-cell lysates (WCLs) or upon immunoselection with streptavidin-coated beads. (D–F) Volcano plots displaying the relative abundance of transcripts as ratios of reads. Red, over-represented; blue, under-represented; n = number of transcripts. (G) NONO eCLIP-seq peak distribution genome wide (left) and at the gene body (right). (H) Browser tracks for NONO eCLIP-seq reads at the CDKN1A (left) and PURPL (right) locus. Red, increased binding.
Figure 5.
Figure 5.
NONO regulates transcript levels at the CDKN1A locus in U2OS cells. (A) NONO ChIP using site-specific primers. (B) RIP–RT–qPCR using region-selective primers. IgG, immunoglobulin, control IP. (C) RT–qPCR using site-specific primers ± NONO depletion/etoposide. (D) Autoradiograph (left) and quantitation (middle) displaying signals upon northern blot hybridization using region-specific, radiolabelled CDKN1A exon probe. EtBr, ethidium bromide loading control (right); dotted box, area of quantification. (E) Browser tracks (left) and quantitation (right) depicting V5-RNaseH1 CUT&RUN-seq reads for CDKN1A± NONO depletion/etoposide. Red box, region of increase; dashed line, background. (F) S9.6 DRIP using site-specific primers. Signals are shown as ratios of the percentage of inputs from the CDKN1A intronic site over the TSS site. *P-value < 0.05; **P-value < 0.001; two-tailed t-test. Error bar, mean ± SD. n = number of biological replicates.
Figure 6.
Figure 6.
Impairment of NONO interferes with DSB signalling in U2OS cells. (A) Immunoblots (left) and quantitation (middle) of NONO, total ATM, phospho-(p)ATM and γH2A.X ± NONO depletion/etoposide via siRNA (left, middle) or shRNA (right). Vinculin, loading control; a.u., arbitrary units. (B) Immunoblots detecting total ATM, pATM, pATM/ATR substrates, γH2A.X, HA-NONO and endogenous NONO upon depletion of endogenous NONO and re-expression of HA-NONO variants. (C) BLISS-seq metagene profiles (left) and signal sum (right) detecting DSBs at the TSS of genes which are expressed at high and low levels. Dashed line, background. (D and E) CUT&RUN-seq metagenes displaying histone H2B Lys120 acetylation (H2BK120ac) chromatin occupancy at TSSs of the top 1000 highly expressed genes ± NONO depletion/etoposide (D) and upon re-expression of mCherry–NONO (E). (F) XRCC4 ChIP using site-specific primers ± NONO depletion/etoposide. *P-value < 0.05; **P-value < 0.001; two-tailed t-test. Error bar, mean ± SD. n = number of biological replicates.
Figure 7.
Figure 7.
Model illustrating our findings. See main text for details.

References

    1. Jackson S.P., Bartek J.. The DNA-damage response in human biology and disease. Nature. 2009; 461:1071–1078. - PMC - PubMed
    1. Ciccia A., Elledge S.J.. The DNA damage response: making it safe to play with knives. Mol. Cell. 2010; 40:179–204. - PMC - PubMed
    1. Groelly F.J., Fawkes M., Dagg R.A., Blackford A.N., Tarsounas M.. Targeting DNA damage response pathways in cancer. Nat. Rev. Cancer. 2023; 23:78–94. - PubMed
    1. Marnef A., Legube G.. R-loops as Janus-faced modulators of DNA repair. Nat. Cell Biol. 2021; 23:305–313. - PubMed
    1. García-Muse T., Aguilera A. R loops: from physiological to pathological roles. Cell. 2019; 179:604–618. - PubMed