

Identifying subgroups of eating behavior traits unrelated to obesity using functional connectivity and feature representation learning
- PMID: 38224537
- PMCID: PMC10789215
- DOI: 10.1002/hbm.26581
Identifying subgroups of eating behavior traits unrelated to obesity using functional connectivity and feature representation learning
Abstract
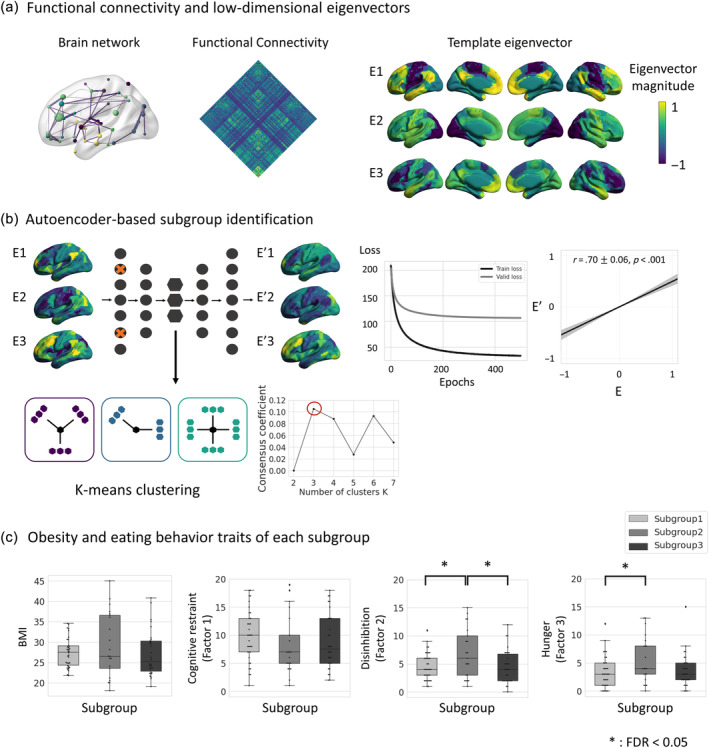
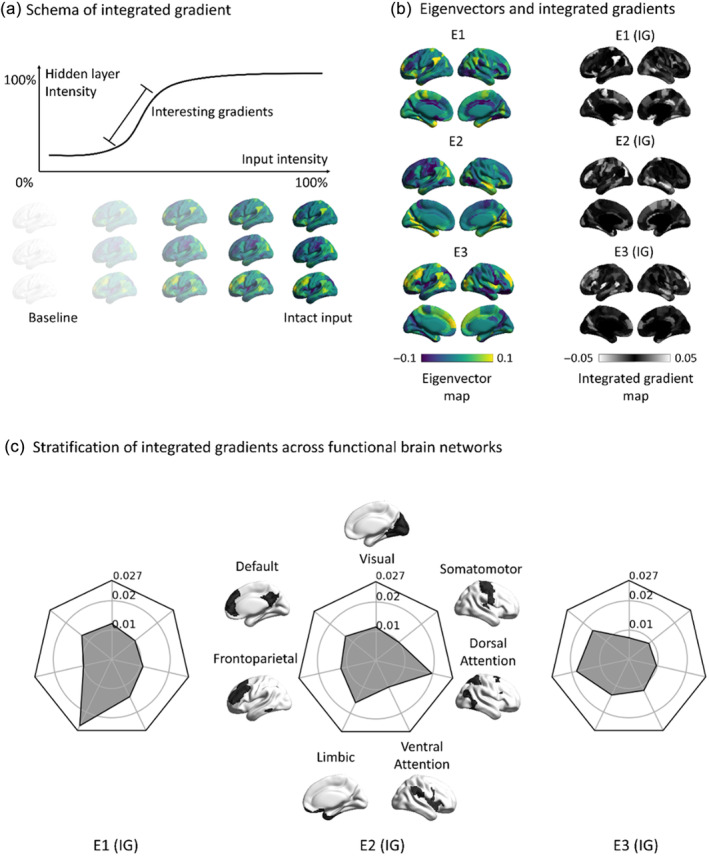
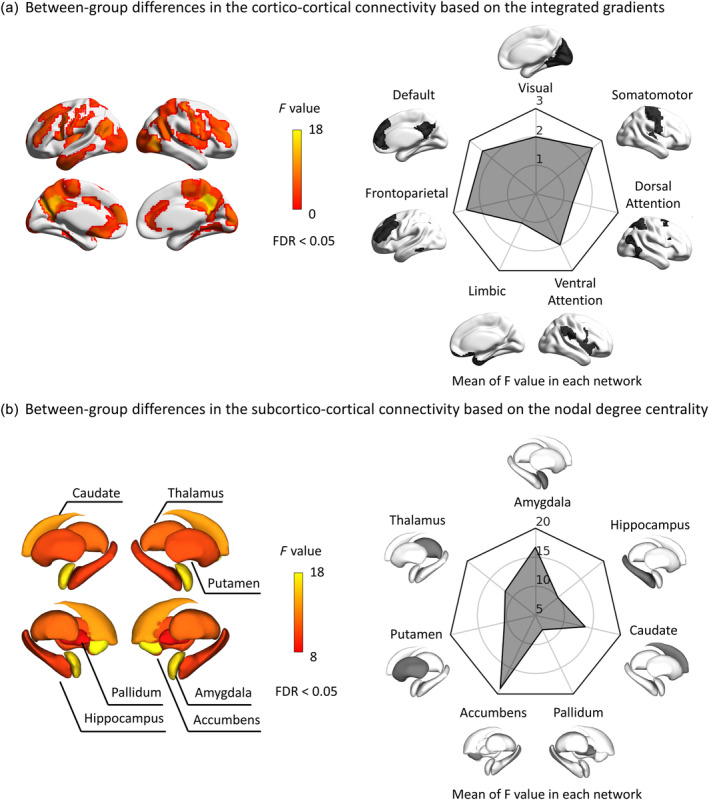
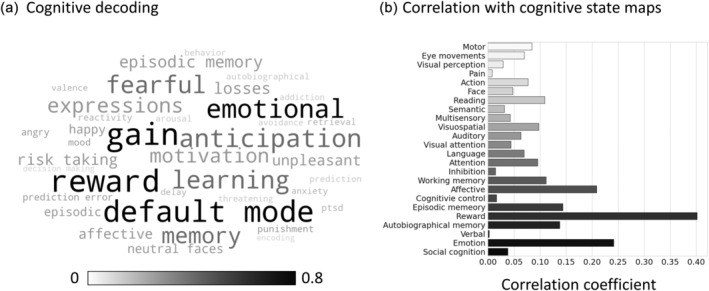
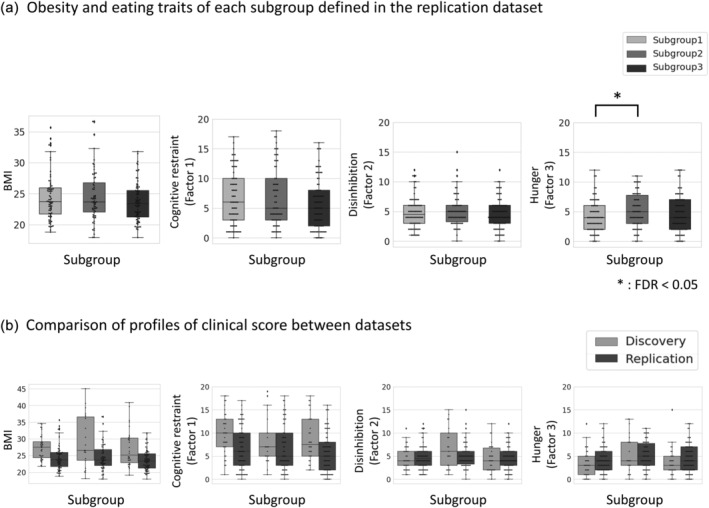
Eating behavior is highly heterogeneous across individuals and cannot be fully explained using only the degree of obesity. We utilized unsupervised machine learning and functional connectivity measures to explore the heterogeneity of eating behaviors measured by a self-assessment instrument using 424 healthy adults (mean ± standard deviation [SD] age = 47.07 ± 18.89 years; 67% female). We generated low-dimensional representations of functional connectivity using resting-state functional magnetic resonance imaging and estimated latent features using the feature representation capabilities of an autoencoder by nonlinearly compressing the functional connectivity information. The clustering approaches applied to latent features identified three distinct subgroups. The subgroups exhibited different levels of hunger traits, while their body mass indices were comparable. The results were replicated in an independent dataset consisting of 212 participants (mean ± SD age = 38.97 ± 19.80 years; 35% female). The model interpretation technique of integrated gradients revealed that the between-group differences in the integrated gradient maps were associated with functional reorganization in heteromodal association and limbic cortices and reward-related subcortical structures such as the accumbens, amygdala, and caudate. The cognitive decoding analysis revealed that these systems are associated with reward- and emotion-related systems. Our findings provide insights into the macroscopic brain organization of eating behavior-related subgroups independent of obesity.
Keywords: autoencoder; eating behavior; functional connectivity; integrated gradient; manifold learning; representation learning; subgroup.
© 2024 The Authors. Human Brain Mapping published by Wiley Periodicals LLC.
Conflict of interest statement
The authors declare no competing interests.
Figures
Similar articles
-
Eating in the absence of hunger in young children is related to brain reward network hyperactivity and reduced functional connectivity in executive control networks.Pediatr Obes. 2019 Jun;14(6):e12502. doi: 10.1111/ijpo.12502. Epub 2019 Jan 18. Pediatr Obes. 2019. PMID: 30659756 Free PMC article.
-
Abnormal Regional Neural Activity and Reorganized Neural Network in Obesity: Evidence from Resting-State fMRI.Obesity (Silver Spring). 2020 Jul;28(7):1283-1291. doi: 10.1002/oby.22839. Epub 2020 Jun 8. Obesity (Silver Spring). 2020. PMID: 32510870
-
Integration of Neural Reward Processing and Appetite-Related Signaling in Obese Females: Evidence From Resting-State fMRI.J Magn Reson Imaging. 2019 Aug;50(2):541-551. doi: 10.1002/jmri.26576. Epub 2019 Jan 17. J Magn Reson Imaging. 2019. PMID: 30653786
-
A review of the relationship between eating behavior, obesity and functional brain network organization.Soc Cogn Affect Neurosci. 2020 Nov 10;15(10):1157-1181. doi: 10.1093/scan/nsz085. Soc Cogn Affect Neurosci. 2020. PMID: 31680149 Free PMC article. Review.
-
Machine learning in resting-state fMRI analysis.Magn Reson Imaging. 2019 Dec;64:101-121. doi: 10.1016/j.mri.2019.05.031. Epub 2019 Jun 5. Magn Reson Imaging. 2019. PMID: 31173849 Free PMC article. Review.
References
-
- Babayan, A. , Erbey, M. , Kumral, D. , Reinelt, J. D. , Reiter, A. M. F. , Röbbig, J. , Schaare, H. L. , Uhlig, M. , Anwander, A. , Bazin, P. L. , Horstmann, A. , Lampe, L. , Nikulin, V. V. , Okon‐Singer, H. , Preusser, S. , Pampel, A. , Rohr, C. S. , Sacher, J. , Thöne‐Otto, A. , … Villringer, A. (2019). Data descriptor: A mind‐brain‐body dataset of MRI, EEG, cognition, emotion, and peripheral physiology in young and old adults. Scientific Data, 6, 180308. 10.1038/sdata.2018.308 - DOI - PMC - PubMed
MeSH terms
Grants and funding
- NRF-2020M3E5D2A01084892/National Research Foundation of Korea
- NRF-2021R1F1A1052303/National Research Foundation of Korea
- NRF-2022R1A5A7033499/National Research Foundation of Korea
- 2019-0-00421/Institute for Information and Communications Technology Promotion
- IITP-2023-2020-0-01821/Institute for Information and Communications Technology Promotion
LinkOut - more resources
Full Text Sources
Medical
