

Diet-Stimulated Marrow Adiposity Fails to Worsen Early, Age-Related Bone Loss
- PMID: 38224679
- PMCID: PMC10987189
- DOI: 10.1159/000536159
Diet-Stimulated Marrow Adiposity Fails to Worsen Early, Age-Related Bone Loss
Abstract
Introduction: Longitudinal effect of diet-induced obesity on bone is uncertain. Prior work showed both no effect and a decrement in bone density or quality when obesity begins prior to skeletal maturity. We aimed to quantify long-term effects of obesity on bone and bone marrow adipose tissue (BMAT) in adulthood.
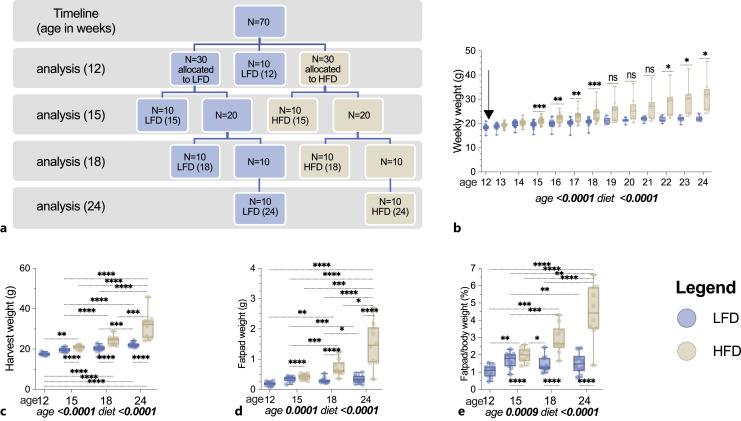
Methods: Skeletally mature, female C57BL/6 mice (n = 70) aged 12 weeks were randomly allocated to low-fat diet (LFD; 10% kcal fat; n = 30) or high-fat diet (HFD; 60% kcal fat; n = 30), with analyses at 12, 15, 18, and 24 weeks (n = 10/group). Tibial microarchitecture was analyzed by µCT, and volumetric BMAT was quantified via 9.4T MRI/advanced image analysis. Histomorphometry of adipocytes and osteoclasts, and qPCR were performed.
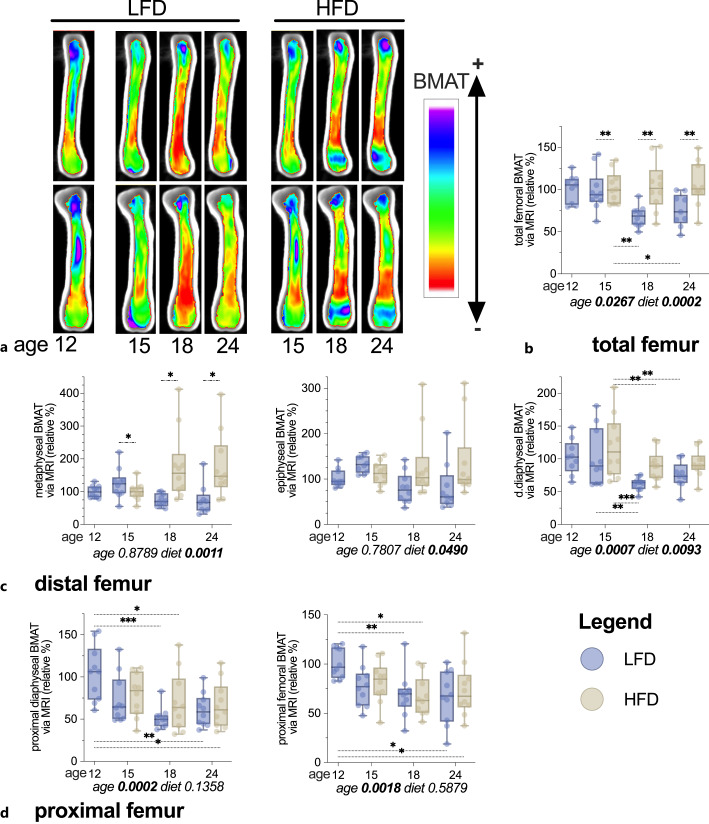
Results: Body weight and visceral white adipose tissue accumulated in response to HFD started in adulthood. Trabecular bone parameters declined with advancing experimental age. BV/TV declined 22% in LFD (p = 0.0001) and 17% in HFD (p = 0.0022) by 24 weeks. HFD failed to appreciably alter BV/TV and had negligible impact on other microarchitecture parameters. Both dietary intervention and age accounted for variance in BMAT, with regional differences: distal femoral BMAT was more responsive to diet, while proximal femoral BMAT was more attenuated by age. BMAT increased 60% in the distal metaphysis in HFD at 18 and 24 weeks (p = 0.0011). BMAT in the proximal femoral diaphysis, unchanged by diet, decreased 45% due to age (p = 0.0002). Marrow adipocyte size via histomorphometry supported MRI quantification. Osteoclast number did not differ between groups. Tibial qPCR showed attenuation of some adipose, metabolism, and bone genes. A regulator of fatty acid β-oxidation, cytochrome C (CYCS), was 500% more abundant in HFD bone (p < 0.0001; diet effect). CYCS also increased due to age, but to a lesser extent. HFD mildly increased OCN, TRAP, and SOST.
Conclusions: Long-term high fat feeding after skeletal maturity, despite upregulation of visceral adiposity, body weight, and BMAT, failed to attenuate bone microarchitecture. In adulthood, we found aging to be a more potent regulator of microarchitecture than diet-induced obesity.
Keywords: Advanced image analysis (MRI-CT); Aging; Obesity; Osteoporosis; Translational research.
© 2024 The Author(s). Published by S. Karger AG, Basel.
Conflict of interest statement
The authors have no conflicts of interest to declare.
Figures


Similar articles
-
High Fructose and High Fat Exert Different Effects on Changes in Trabecular Bone Micro-structure.J Nutr Health Aging. 2018;22(3):361-370. doi: 10.1007/s12603-017-0933-0. J Nutr Health Aging. 2018. PMID: 29484349 Free PMC article.
-
Diet-induced obesity impairs endometrial stromal cell decidualization: a potential role for impaired autophagy.Hum Reprod. 2016 Jun;31(6):1315-26. doi: 10.1093/humrep/dew048. Epub 2016 Apr 6. Hum Reprod. 2016. PMID: 27052498 Free PMC article.
-
Sertindole for schizophrenia.Cochrane Database Syst Rev. 2005 Jul 20;2005(3):CD001715. doi: 10.1002/14651858.CD001715.pub2. Cochrane Database Syst Rev. 2005. PMID: 16034864 Free PMC article.
-
Nutritional interventions for survivors of childhood cancer.Cochrane Database Syst Rev. 2016 Aug 22;2016(8):CD009678. doi: 10.1002/14651858.CD009678.pub2. Cochrane Database Syst Rev. 2016. PMID: 27545902 Free PMC article.
-
Systemic pharmacological treatments for chronic plaque psoriasis: a network meta-analysis.Cochrane Database Syst Rev. 2017 Dec 22;12(12):CD011535. doi: 10.1002/14651858.CD011535.pub2. Cochrane Database Syst Rev. 2017. Update in: Cochrane Database Syst Rev. 2020 Jan 9;1:CD011535. doi: 10.1002/14651858.CD011535.pub3. PMID: 29271481 Free PMC article. Updated.
Cited by
-
Evaluation of bone marrow glucose uptake and adiposity in male rats after diet and exercise interventions.Front Endocrinol (Lausanne). 2024 Jun 14;15:1422869. doi: 10.3389/fendo.2024.1422869. eCollection 2024. Front Endocrinol (Lausanne). 2024. PMID: 38948514 Free PMC article.
-
Bone Marrow Adipocytes as Novel Regulators of Metabolic Homeostasis: Clinical Consequences of Bone Marrow Adiposity.Curr Obes Rep. 2025 Jan 14;14(1):9. doi: 10.1007/s13679-024-00594-9. Curr Obes Rep. 2025. PMID: 39808256 Review.
-
Ketogenic diet and β-hydroxybutyrate in osteoporosis: current progress and controversy.Front Nutr. 2025 Jan 23;12:1508695. doi: 10.3389/fnut.2025.1508695. eCollection 2025. Front Nutr. 2025. PMID: 39917743 Free PMC article. Review.
References
-
- Reid IR. Fat and bone. Arch Biochem Biophys. 2010;503(1):20–7. - PubMed
-
- Lecka-Czernik B, Stechschulte LA, Czernik PJ, Dowling AR. High bone mass in adult mice with diet-induced obesity results from a combination of initial increase in bone mass followed by attenuation in bone formation; implications for high bone mass and decreased bone quality in obesity. Mol Cell Endocrinol. 2015;410:35–41. - PubMed
-
- Gandham A, Mesinovic J, Jansons P, Zengin A, Bonham MP, Ebeling PR, et al. . Falls, fractures, and areal bone mineral density in older adults with sarcopenic obesity: a systematic review and meta‐analysis. Obes Rev. 2021;22(5):e13187. - PubMed
MeSH terms
Grants and funding
LinkOut - more resources
Full Text Sources
Medical
Miscellaneous
