Review
. 2024 May 7;45(3):379-413.
doi: 10.1210/endrev/bnad037.

The Basis for Weekly Insulin Therapy: Evolving Evidence With Insulin Icodec and Insulin Efsitora Alfa

Affiliations
Review

The Basis for Weekly Insulin Therapy: Evolving Evidence With Insulin Icodec and Insulin Efsitora Alfa

Julio Rosenstock et al. Endocr Rev. .

Erratum in

Abstract

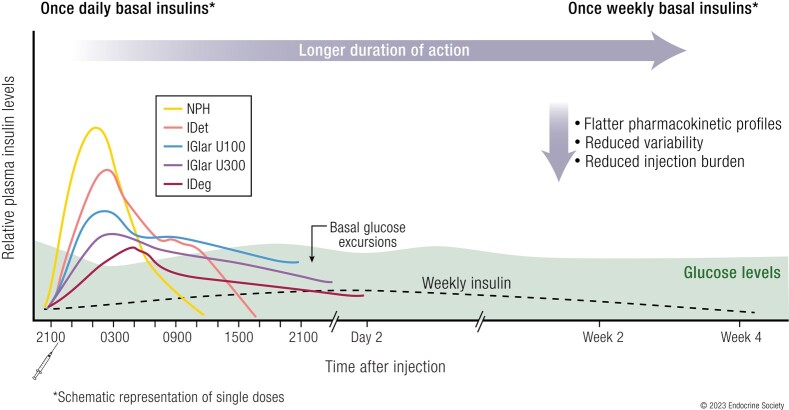
Basal insulin continues to be a vital part of therapy for many people with diabetes. First attempts to prolong the duration of insulin formulations were through the development of suspensions that required homogenization prior to injection. These insulins, which required once- or twice-daily injections, introduced wide variations in insulin exposure contributing to unpredictable effects on glycemia. Advances over the last 2 decades have resulted in long-acting, soluble basal insulin analogues with prolonged and less variable pharmacokinetic exposure, improving their efficacy and safety, notably by reducing nocturnal hypoglycemia. However, adherence and persistence with once-daily basal insulin treatment remains low for many reasons including hypoglycemia concerns and treatment burden. A soluble basal insulin with a longer and flatter exposure profile could reduce pharmacodynamic variability, potentially reducing hypoglycemia, have similar efficacy to once-daily basal insulins, simplify dosing regimens, and improve treatment adherence. Insulin icodec (Novo Nordisk) and insulin efsitora alfa (basal insulin Fc [BIF], Eli Lilly and Company) are 2 such insulins designed for once-weekly administration, which have the potential to provide a further advance in basal insulin replacement. Icodec and efsitora phase 2 clinical trials, as well as data from the phase 3 icodec program indicate that once-weekly insulins provide comparable glycemic control to once-daily analogues, with a similar risk of hypoglycemia. This manuscript details the technology used in the development of once-weekly basal insulins. It highlights the clinical rationale and potential benefits of these weekly insulins while also discussing the limitations and challenges these molecules could pose in clinical practice.

Keywords: basal insulin; hypoglycemia; insulin efsitora; insulin icodec; once-weekly insulin; peak-to-trough ratio.


Figures

Graphical Abstract
Graphical Abstract
Figure 1.
Figure 1.
Insulin pharmacokinetics. Schematic PK/PD profile for basal insulin after administration of a single dose after maintenance phase (steady state) has been achieved highlighting key PK/PD parameters. P/T ratio: difference between the highest and lowest concentration of injected insulin at steady state; and t1/2: the time it takes for 50% of the drug to be eliminated relative to the Cmax. AUC, area under the curve; Cmax, peak insulin concentration reached; GIR, glucose infusion rate; GIRmax, time of maximum glucose infusion rate; INS, insulin (analogue) concentration; PD, pharmacodynamic; PK, pharmacokinetic; Tmax, time when peak insulin concentration is reached. Reproduced with permission from Heise and Meneghini (9).
Figure 2.
Figure 2.
PK profiles of rapid-acting insulin and basal insulins. A, PK profile of a rapid-acting insulin analogue with a t1/2 of 1.3 hours (left) and basal insulins (right) with a t1/2 of 6 hours (NPH insulin), 12.5 hours (insulin glargine U100), or 25 hours (insulin degludec). B, Effect of missed dosing and double dosing on PK profiles of rapid-acting insulin and basal insulins at steady state. As shown in the figure, the effects of missed or double dosing are greatest with basal insulin having a shorter half-life. NPH, neutral protamine Hagedorn; PK, pharmacokinetic. Reproduced with permission from Heise and Meneghini (9).
Figure 3.
Figure 3.
Metabolic pathway for endogenous insulin. Left, The distribution of endogenous insulin through the body. Endogenous insulin is produced in the pancreas. It is then transported to the liver through portal circulation. The majority of insulin (40%-80%) is cleared by the liver by hepatocytes with approximately 50% cleared through first-pass extraction from the portal vein. The insulin exiting the liver is distributed to the adipose tissue muscle and kidney, where it controls the utilization of glucose and free fatty acids for energy. Any insulin that is not distributed to the parenchyma is either filtered by the kidney (∼25%) or recycled back to the liver by the arterial blood flow, where an additional approximately 30% is cleared. Right, Generalized mechanism for insulin intracellular degradation via IR-mediated endocytosis in the liver. Insulin binds to the IR and forms a complex inducing internalization into the cell via 2 routes, clatherin-dependent or caveolar endocytosis. Receptor-bound insulin is released in the acidic early endosome and is degraded by enzymes that include protein disulfide isomers, insulin-degrading enzyme, and cathepsin D. The IR is recycled back to the cell surface by the rapid IR recycling and endosome IR recycling compartment pathways. Any degraded IR and insulin fragments are routed to the lysosome for further degradation. IR, insulin receptor.
Figure 4.
Figure 4.
Pore theory of insulin transport pathways. Insulin molecules, based on their hydrodynamic size, can use multiple paths to reach circulation from A, the subcutaneous space and B, the parenchymal tissue from the circulation. Insulins may use vesicular-vacuolar organelle transport, or transcytosis through binding to insulin receptors for transcellular transport. Insulin molecules with a hydrodynamic size less than 3 nm such as human insulin and unbound icodec can also use adherens junctions for paracellular transport. Very large insulin molecules such as efsitora (molecular weight 64.1 kDa) and HSA-bound icodec (molecular weight ∼73 kDa) are thought to predominantly use the large pores (25-30 nm). Both are likely absorbed from the subcutaneous depot via the slow-flowing lymphatic system due to their large hydrodynamic size, which slows the release into the circulation and limits parenchymal exposure. HSA, human serum albumin.
Figure 5.
Figure 5.
Daily basal insulin analogues. Adapted with permission from Hirsch et al (1). A, Left: Mechanism of protraction of IGlar U100 through pH-induced precipitation at the SC space. Right: PK profiles of IGlar U100 compared to NPH (each 0.3 U/kg) from a euglycemic clamp study in 20 individuals with T1D. Data from Lepore et al (55). B, Left: Mechanism of protraction of IGlar U300 through pH-induced precipitation at the SC space. Mechanism is the same as for IGlar U100 but with a more sustained release due to the more concentrated formulation resulting in slower release of insulin glargine from the precipitate. Right: PK profile of IGlar U300 compared to IGlar U100 (each 0.4 U/kg) from a euglycemic clamp study in 18 individuals with T1D. Data from Becker et al (13). C, Left: Mechanism of protraction of IDet through di-hexamer formation in the SC space and binding to albumin. Right: PK profile of IDet compared to IGlar U100 (both 0.35 U/kg) from a euglycemic clamp study in 12 patients with T1D. Data from Porcellati et al (58). D, Left: Mechanism of protraction of IDeg through sustained release from multihexamer formation and binding to albumin. Right: PK profile of IDeg compared to IGlar U100 (both 0.4 U/kg) in 22 patients with T1D. Data from Heise et al (11). NPH, neutral protamine Hagedorn; PK, pharmacokinetic; SC, subcutaneous; T1D, type 1 diabetes.
Figure 6.
Figure 6.
Insulin icodec. A, Icodec is an acylated insulin analogue with 3 amino acid changes (TyrA14Glu, TyrB16His, and PheB25His; orange) relative to human insulin to facilitate stability and reduce IR affinity. The reduced IR affinity tempers receptor-mediated clearance. A C20 icosane diacid is added with a spacer and enables strong and reversible HSA-binding to prolong plasma half-life. B, Delayed icodec absorption from the subcutaneous is achieved by diffusion controlled hexameric dissociation and binding of monomers to HSA. C, Icodec circulates primarily in an HSA-bound state with limited concentration of unbound icodec. The reduced insulin receptor affinity of icodec regulates binding to the IR by requiring higher local concentration for IR engagement; thus, providing more control of glucose uptake in the parenchyma. HSA, human serum albumin; IR, insulin receptor.
Figure 7.
Figure 7.
Insulin efsitora alfa. A, Efsitora is an insulin receptor agonist that is composed of a novel single-chain variant of insulin fused to a human IgG2 Fc domain. The insulin molecule has amino acid changes as shown in the figure to modulate IR affinity and reduce postreceptor clearance, as well as facilitate chemical stability and manufacturability. The reduced insulin IR affinity of efsitora regulates binding to the IR by requiring higher local concentration for IR engagement; thus, providing more control of glucose uptake in the parenchyma. B, Once injected, circulating efsitora binds to FcRn within the endothelial cells (insert). As seen in the insert, FcRn-bound efsitora is protected from degradation and is recycled back to the cell surface and into the blood. This creates a reservoir of insulin and prolongs circulating exposure. This protection/recycling system is controlled by pH switching where in the acidic endosome (∼pH 5.8) the Fc domain/FcRn binding is favored. However, at extracellular neutral pH environment such as in the blood (pH ∼7.2), efsitora release from the FcRn is favored. The reduced IR affinity of efsitora regulates binding to the IR by requiring higher local concentration for IR engagement; thus, providing more control of glucose uptake in the parenchyma. FcRn, Fc receptor; IR, insulin receptor.
Figure 8.
Figure 8.
Icodec dosing and build-up to efficacious exposure. A, Schematic depiction of the distribution of insulin icodec (red hexagons) bound to albumin (gray) in the different biological compartments over time from initiation of once-weekly dosing (injection 1) through injection 5, showing the accumulation of insulin icodec in the intercellular space. B, Modeling of insulin icodec concentration when dosed without a loading dose (black dashed) and with a loading dose (black solid) compared to once-daily insulin glargine U100 (gray).
Figure 9.
Figure 9.
Pharmacokinetic and pharmacodynamic profiles of icodec in people with type 2 diabetes. A, Mean (SE) total serum icodec concentrations for 12, 20, 24 nmol/kg doses during week 5 of once-weekly dosing. PK results showed that icodec reached tmax at 16 hours after dosing, with a mean t1/2 of 196 hours. B: The PD effect of insulin icodec over a weekly dosing interval as derived from the observed data using a PK/PD model. The highest activity occurs at day 3 (∼16%), while on day 7 it is approximately 12%. An equal distribution across the 7 days of 14.3% per day is showed by the solid line. AUCGIR, area under curve for glucose infusion rate; HSA, human serum albumin; PD, pharmacodynamic; PK, pharmacokinetic; t1/2, half-life; tmax, time to peak insulin concentration. Data from Nishimura et al (86).
Figure 10.
Figure 10.
Efsitora dosing and build-up to efficacious exposure. A, Schematic depiction of the distribution of efsitora in the different biological compartments over time from initiation of once-weekly dosing (injection 1) through injection 8, showing the gradual movement of insulin efsitora from the subcutis through the blood to the intercellular space where build-up occurs. B, Model of insulin efsitora concentration when dosed without a loading dose (black dashed) and with a loading dose (black solid) compared to once-daily insulin glargine U100 (gray).
Figure 11.
Figure 11.
Pharmacokinetic properties of efsitora in people with type 2 diabetes. A, Mean plasma efsitora concentrations following a single subcutaneous dose (10, 20, and 35 mg doses) in people with T2D. PK results showed that efsitora reached tmax at 4 days after dosing, with a mean t1/2 of approximately 17 days. B, Mean plasma efsitora concentrations following dosing for 1, 2, 5, and 10 mg doses from a 6-week ascending dose study in people with T2D. The peak-to-trough ratio was determined to be 1.14. t1/2, half-life; tmax, time to peak insulin concentration. Data from Heise et al (108).
Figure 12.
Figure 12.
Schematic representation of the potential effect of sleep, exercise, and overnight and extended fasting (red boxes) on icodec and efsitora dosed once-weekly compared to IGlar U100 dosed at 2100 hours daily. A, Following dosing at 2100 hours, peak IGlar U100 concentration would be expected in the early morning hours, whereas with weekly icodec or efsitora, there would be minimal difference in insulin exposure. B, A 30-minute period of exercise at around 0700 hours is depicted. In this example, exercise would occur either at the peak action or shortly thereafter of an IGlar U100 dose administered at 2100 hours. With icodec or efsitora given the constant exposure of insulin concentrations without a peak, the effect of the exercise on glucose levels would be more predictable. C, With overnight fasting, IGlar U100 could have a peak in the early morning hours that could increase the risk of hypoglycemia and a dose reduction of the IGlar on the night of the fast may be prudent. With icodec and efsitora no change in dose will be needed. D, With a prolonged fast, for example, following major abdominal surgery or similar event, where the person is dependent on endogenous glucose or an exogenous glucose source, based on target range of glucose for the patient, with weekly insulins no intervention may be acceptable. With IGlar, multiple dose adjustments may be required.

Similar articles

Cited by

References

    1. Hirsch IB, Juneja R, Beals JM, Antalis CJ, Wright EE Jr. The evolution of insulin and how it informs therapy and treatment choices. Endocr Rev. 2020;41(5):733‐755. - PMC - PubMed
    1. Beals JM, DeFelippis MR, Paavola CD, Allen DP, Garg A. Bruce Baldwin D. Insulin. In: Crommelin DJA Sindelar RD and Meibohm B (eds.), Pharmaceutical Biotechnology: Fundamentals and Applications. Springer International Publishing; 2019:403‐427.
    1. Heinemann L, Linkeschova R, Rave K, Hompesch B, Sedlak M, Heise T. Time-action profile of the long-acting insulin analog insulin glargine (HOE901) in comparison with those of NPH insulin and placebo. Diabetes Care. 2000;23(5):644‐649. - PubMed
    1. Riddle MC, Rosenstock J, Gerich J; Insulin Glargine 4002 Study Investigators . The treat-to-target trial: randomized addition of glargine or human NPH insulin to oral therapy of type 2 diabetic patients. Diabetes Care. 2003;26(11):3080‐3086 - PubMed
    1. Yki-Järvinen H, Dressler A, Ziemen M; HOE 901/3002 Study Group . Less nocturnal hypoglycemia and better post-dinner glucose control with bedtime insulin glargine compared with bedtime NPH insulin during insulin combination therapy in type 2 diabetes. HOE 901/3002 Study Group. Diabetes Care. 2000;23(8):1130‐1136 - PubMed

Publication types

MeSH terms

Grants and funding