. 2024 Jan 15;15(1):53.
doi: 10.1038/s41419-024-06432-z.

Tolerable glycometabolic stress boosts cancer cell resilience through altered N-glycosylation and Notch signaling activation

Affiliations

Tolerable glycometabolic stress boosts cancer cell resilience through altered N-glycosylation and Notch signaling activation

Shungo Iwamoto et al. Cell Death Dis. .

Abstract

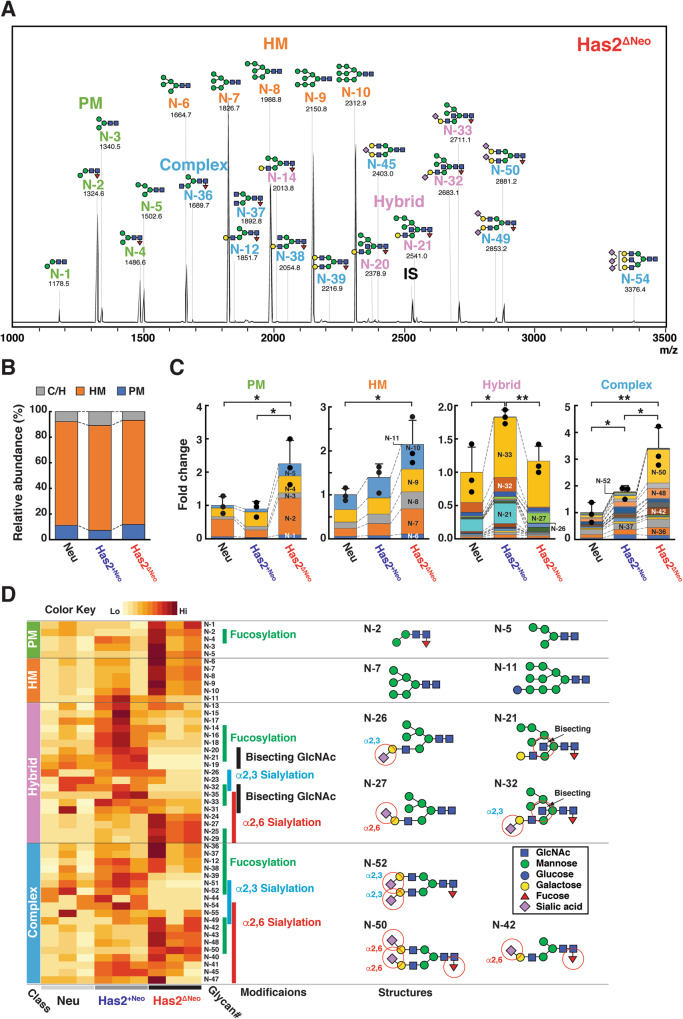
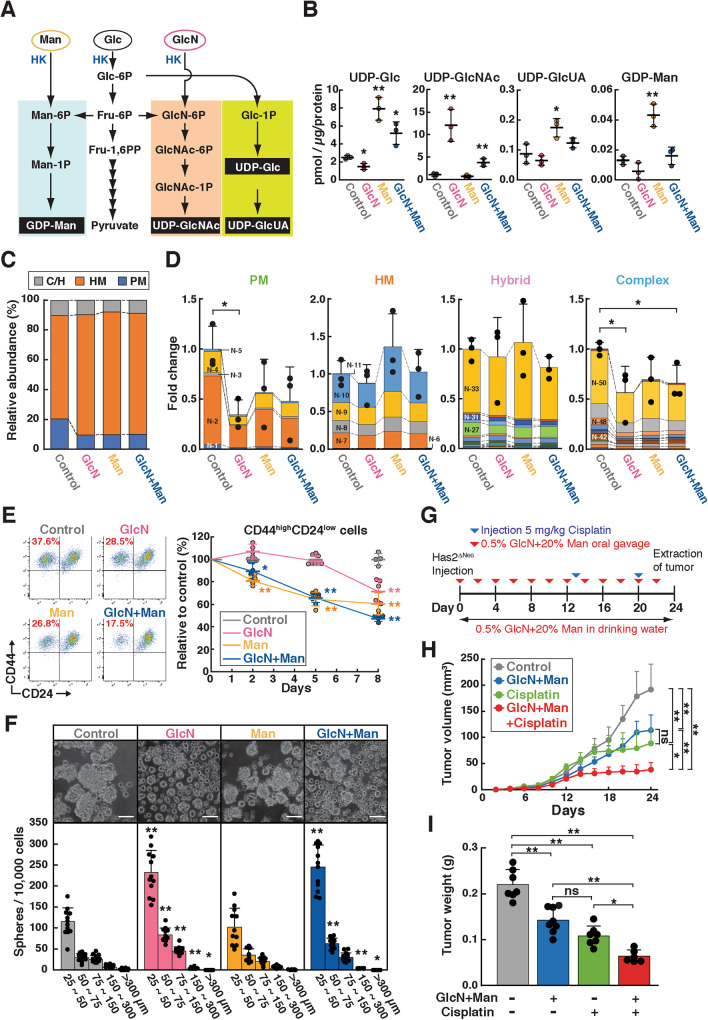
Chronic metabolic stress paradoxically elicits pro-tumorigenic signals that facilitate cancer stem cell (CSC) development. Therefore, elucidating the metabolic sensing and signaling mechanisms governing cancer cell stemness can provide insights into ameliorating cancer relapse and therapeutic resistance. Here, we provide convincing evidence that chronic metabolic stress triggered by hyaluronan production augments CSC-like traits and chemoresistance by partially impairing nucleotide sugar metabolism, dolichol lipid-linked oligosaccharide (LLO) biosynthesis and N-glycan assembly. Notably, preconditioning with either low-dose tunicamycin or 2-deoxy-D-glucose, which partially interferes with LLO biosynthesis, reproduced the promoting effects of hyaluronan production on CSCs. Multi-omics revealed characteristic changes in N-glycan profiles and Notch signaling activation in cancer cells exposed to mild glycometabolic stress. Restoration of N-glycan assembly with glucosamine and mannose supplementation and Notch signaling blockade attenuated CSC-like properties and further enhanced the therapeutic efficacy of cisplatin. Therefore, our findings uncover a novel mechanism by which tolerable glycometabolic stress boosts cancer cell resilience through altered N-glycosylation and Notch signaling activation.


Conflict of interest statement

The authors declare no competing interests.

Figures

Fig. 1
Fig. 1. N-glycan profiles in mammary carcinoma cell lines with different HA-producing abilities.
A Typical MALDI-TOF MS spectra of N-glycans in HA-high Has2ΔNeo cells. The estimated N-glycan structures are shown. IS, internal standard. B N-glycan composition of parental Neu, HA-low Has2+Neo, and HA-high Has2ΔNeo cells. The N-glycan composition was expressed as the ratio of each glycan type to the total N-glycans. C Relative amounts of PM, HM, and C/H-type N-glycans. The colors representing each glycoform are listed in Supplementary Table S1. Data are the mean ± SD from n = 3. Two-tailed Student’s t-test. *p < 0.05, **p < 0.01. D Heatmap analysis based on the quantitative glycomic profiles of N-glycans. The heatmap represents the normalized abundance of N-glycans in Neu, Has2+Neo, and Has2ΔNeo cells. The complete structures of the N-glycans are shown in Supplementary Table S1. The bars on the right side of the heatmap indicate modifications of the N-glycan. Selected glycan structures are shown on the right, with important modifications (red circles).
Fig. 2
Fig. 2. Cellular levels of nucleotide sugars and LLOs in mammary carcinoma cell lines with different HA-producing abilities.
A, B Ion-pair reversed-phase HPLC profiles (A) and cellular levels (B) of nucleotide sugars in HA-low Has2+Neo and HA-high Has2ΔNeo cells. Data are the mean ± SD from n = 3. Two-tailed Student’s t-test. *p < 0.05, **p < 0.01. C Schematic diagram of nucleotide sugar biosynthesis. UDP-GlcNAc and GDP-Man are synthesized de novo from a common glycolytic intermediate, fructose-6-phosphate (Fru-6P), in the hexosamine biosynthetic pathway (orange) and GDP-Man biosynthetic pathway (blue), respectively. UDP-GlcUA is produced by a three-step reaction (yellow‒green): conversion of glucose-6-phosphate (Glc-6P) into glucose-1-phosphate (Glc-1P), conversion of Glc-1P into UDP-Glc, and oxidation of UDP-Glc. UDP-GlcNAc and UDP-GlcUA are utilized for HA biosynthesis. D Schematic diagram of LLO biosynthesis. The assembly of LLO precursors is initiated by the addition of GlcNAc-phosphate to dolichol-phosphate (Dol-P) from UDP-GlcNAc on the cytosolic face of the ER membrane. After translocation into the ER lumen, the mature form of LLOs, Glc3Man9GlcNAc2-PP-Dol, is synthesized and transferred onto asparagine residues within nascent polypeptide acceptors by the oligosaccharyltransferase (OST) complex. E‒G HPLC profiles (E) and quantification (F, G) of LLO glycans prepared from Neu, Has2+Neo, and Has2ΔNeo cells. Data are the mean ± SD from n = 4. Tukey’s test. *p < 0.05, **p < 0.01.
Fig. 3
Fig. 3. Low-dose TM preconditioning partially interferes with LLO biosynthesis and N-glycan assembly.
A HPLC profiles and cellular levels of LLO glycans. Low-HA Has2+Neo cells were treated with 0.1 or 0.2 μg/ml TM for 8 days and analyzed for cellular LLO levels. Data are the mean ± SD from n = 3. Tukey’s test. *p < 0.05, **p < 0.01. B N-glycan composition of TM-treated and untreated cells. Low-HA Has2+Neo cells were treated with 0.1 or 0.2 μg/ml TM for 8 days and analyzed for N-glycan compositions. N-glycan composition is expressed as the ratio of each glycan type to the total N-glycans. C Relative amounts of PM, HM, and C/H-type N-glycans. The colors representing each glycoform are listed in Supplementary Table S2. Data are the mean ± SD from n = 3. Two-tailed Student’s t-test. *p < 0.05, **p < 0.01. D Hierarchical clustering analysis based on the quantitative glycomic profiles of N-glycans. The hierarchical clustering heatmap represents the normalized abundance of N-glycans in the TM-treated and untreated cells. The Neu, Has2+Neo, and Has2ΔNeo cell datasets were reused from Fig. 1D. The complete structures of the N-glycans are shown in Supplementary Tables S1 and S2. The bars on the right side of the heatmap indicate N-glycan modifications. Selected glycan structures are shown on the right, with important modifications (red circles).
Fig. 4
Fig. 4. Low-dose TM and 2-DG preconditioning increases the number of CD44high/CD24low CSC-like cells.
A, B FACS analysis of CD44high/CD24low CSC-like cells in TM-preconditioned cancer cells. (A) Low-HA Has2+Neo cells were treated with different doses of TM for 8 days and analyzed for CD24 and CD44 expression by flow cytometry. Data are the mean ± SD from n = 4. Two-tailed Student’s t-test. **p < 0.01. (B) Low-HA Has2+Neo cells were treated with 0.1 or 0.2 μg/ml TM for 8 days and further cultured in the absence of TM for an additional 8 days. The numbers of CD44high/CD24low CSC-like cells were counted at different time points. Data are the mean ± SD from n = 3. Two-tailed Student’s t-test. *p < 0.05, **p < 0.01. C Effects of GlcN supplementation on the number of CD44high/CD24low cells. Low-HA Has2+Neo cells were treated with 0.1 µg/ml TM and/or 500 µM GlcN for 8 days and then analyzed for CD24 and CD44 expression by flow cytometry. Data are the mean ± SD from n = 3. Two-tailed Student’s t-test. *p < 0.05. D Mammosphere formation. Has2+Neo cells were treated with low-dose TM for 8 days and cultured for an additional 7 days in ultralow attachment surface 24-well plates with spheroid-forming medium containing the same concentrations of TM. Representative images of mammospheres were taken, and the mammosphere number was counted under a phase-contrast microscope. Scale bar: 100 µm. Data are the mean ± SD from n = 3. Two-tailed Student’s t-test. *, #p < 0.05, **, ##p < 0.01. E The effects of 2-DG preconditioning on the number of CD44high/CD24low CSC-like cells. Low-HA Has2+Neo cells were treated with different doses of 2-DG for 8 days and analyzed for CD24 and CD44 expression by flow cytometry. Data are the mean ± SD from n = 4. Two-tailed Student’s t-test. *p < 0.05, **p < 0.01.
Fig. 5
Fig. 5. Low-dose TM and 2-DG preconditioning enhances cisplatin resistance.
A Cisplatin-induced apoptosis in HA-low Has2+Neo and HA-high Has2ΔNeo cells. Has2ΔNeo and Has2+Neo cells were treated with 0-50 µM cisplatin for 16 h. After staining with fluorescent Annexin V and PI, apoptotic cells were analyzed by flow cytometry. Early and late apoptotic cells were represented as Annexin V+/PI- and Annexin V+/PI+ subpopulations, respectively. Data are the mean ± SD from n = 4. Two-tailed Student’s t-test. *p < 0.05, **p < 0.01. B, C Cisplatin-induced apoptosis in Has2+Neo cells pretreated with low-dose TM or 2-DG. HA-low Has2+Neo cells were treated with 0.1 μg/ml TM (B) or 0.1 mM 2-DG (C) for 8 days. Before staining with fluorescent Annexin V and PI, the cells were treated with 0-50 µM cisplatin for 16 h. Data are mean ± SD from n = 8 for (B) and n = 4 for (C). Two-tailed Student’s t-test. *p < 0.05, **p < 0.01.
Fig. 6
Fig. 6. RNA-seq and GSEA of TM- and 2-DG-preconditioned cancer cells.
A RNA-seq was performed on samples collected after preconditioning HA-low Has2+Neo cells with 0.1 μg/ml TM or 0.1 mM 2-DG. RNA-seq data were compared with those from untreated cells (untreated control, UT). Heatmap of hierarchical clustering indicating DEGs between preconditioned and untreated cells (|log2FC | ≥ 2 and FDR < 0.1). Red and green indicate the upregulated and downregulated genes, respectively. B Number of DEGs between samples in each treatment group. The red and blue bars represent the number of upregulated and downregulated genes in each pair, respectively. C GSEA hallmark analysis of the pathways significantly upregulated in TM-preconditioned cells versus UT cells. D KEGG pathway analysis of RNA-seq data. Red and green indicate the upregulated and downregulated genes, respectively. E qRT-PCR analysis of Notch3 expression in Has2ΔNeo and Has2+Neo cells. Has2+Neo cells were treated with 0.1 μg/ml TM or 0.1 mM 2-DG for 8 days and analyzed for Notch 3 expression by qRT‒PCR. The relative expression of Notch 3 mRNA was normalized to that of GAPDH. Data are the mean ± SD from n = 4. Two-tailed Student’s t-test. **p < 0.01. F Induction of cell surface Notch 3 expression by TM- and 2-DG preconditioning. Has2+Neo cells were treated with 0.1 μg/ml TM or 0.1 mM 2-DG for 8 days and analyzed for cell surface Notch 3 expression by flow cytometry. Data are the mean ± SD from n = 3. Two-tailed Student’s t-test. **p < 0.01. G Suppression of mammosphere formation by Notch signaling inhibition. Has2ΔNeo cells were cultured for 7 days in ultra-low attachment surface 24-well plates in spheroid-forming medium containing 50 µM LY411575, 50 µM LY3039478, 20 µM DAPT, or 1 µM LLNLe. The mammospheres were counted under a phase-contrast microscope. Scale bar: 100 µm. Data are the mean ± SD from n = 4. Two-tailed Student’s t-test. *p < 0.05, **p < 0.01. H Enhancement of cisplatin-induced apoptosis by inhibition of Notch signaling. Has2ΔNeo cells were treated with 50 µM LY411575 for 8 days. Before staining with fluorescent Annexin V and PI, the cells were treated with 0-50 µM cisplatin for 16 h. Early and late apoptotic cells were represented as Annexin V+/PI- and Annexin V+/PI+ subpopulations, respectively. Data are the mean ± SD from n = 4. Two-tailed Student’s t-test. *p < 0.05, **p < 0.01.
Fig. 7
Fig. 7. GlcN and Man supplementation suppresses CSC-like properties and augments the therapeutic efficacy of cisplatin.
A Schematic diagram of nucleotide sugar biosynthesis. B Cellular levels of nucleotide sugars. Has2ΔNeo cells were supplemented with 500 μM GlcN and/or 20 mM Man for 24 h and analyzed for cellular levels of nucleotide sugars using ion-pair reversed-phase HPLC. Data are the mean ± SD from n = 3. Two-tailed Student’s t-test. *p < 0.05, **p < 0.01. C, D N-glycan composition (C) and relative amounts of PM, HM, and C/H-type N-glycans (D). Has2ΔNeo cells were supplemented with 500 μM GlcN and/or 20 mM Man for 8 days and analyzed for N-glycan composition using MALDI-TOF-MS. Colors representing each glycoform are listed in Supplementary Table S4. Data are the mean ± SD from n = 3. Two-tailed Student’s t-test. *p < 0.05. E Effects of GlcN and Man supplementation on the number of CD44high/CD24low CSC-like cells. Has2ΔNeo cells were supplemented with 500 μM GlcN and/or 20 mM Man for 8 days and analyzed for CD24 and CD44 expression by flow cytometry. Data are the mean ± SD from n = 4. Two-tailed Student’s t-test. *p < 0.05, **p < 0.01. F Mammosphere formation. Has2ΔNeo cells were supplemented with 500 μM GlcN and/or 20 mM Man for 8 days and cultured for an additional 7 days in ultralow attachment surface 24-well plates with spheroid-forming medium containing the same concentrations of GlcN and/or Man. Representative images of mammospheres were obtained, and the mammosphere number was counted under a phase-contrast microscope. Scale bar: 100 µm. Data are the mean ± SD from n = 12. Two-tailed Student’s t-test. *p < 0.05, **p < 0.01. G Schematic representation of the animal experiment process. H Tumor growth of Has2ΔNeo cells in BALB/c nude mice following GlcN and Man supplementation. Tumor sizes were measured at the indicated time points for 24 days, and tumor volumes were calculated as described in the Methods section (n = 3-4 mice per group). Tukey’s test. *p < 0.05, **p < 0.01. I Tumor weight at the end of the experiments (n = 3-4 mice per group). Tukey’s test. *p < 0.05, **p < 0.01.

References

    1. DeBerardinis RJ, Chandel NS. Fundamentals of cancer metabolism. Sci Adv. 2016;2:e1600200. doi: 10.1126/sciadv.1600200. - DOI - PMC - PubMed
    1. Daniel Y, Lelou E, Aninat C, Corlu A, Cabillic F. Interplay between Metabolism Reprogramming and Epithelial-to-Mesenchymal Transition in Cancer Stem Cells. Cancers (Basel) 2021;13:1973. doi: 10.3390/cancers13081973. - DOI - PMC - PubMed
    1. Sancho P, Barneda D, Heeschen C. Hallmarks of cancer stem cell metabolism. Br J Cancer. 2016;114:1305–12. doi: 10.1038/bjc.2016.152. - DOI - PMC - PubMed
    1. Lee E, Yang J, Ku M, Kim NH, Park Y, Park CB, et al. Metabolic stress induces a Wnt-dependent cancer stem cell-like state transition. Cell Death Dis. 2015;6:e1805. doi: 10.1038/cddis.2015.171. - DOI - PMC - PubMed
    1. Nardy AF, Freire-de-Lima L, Freire-de-Lima CG, Morrot A. The Sweet Side of Immune Evasion: Role of Glycans in the Mechanisms of Cancer Progression. Front Oncol. 2016;6:54. doi: 10.3389/fonc.2016.00054. - DOI - PMC - PubMed

Publication types