. 2024 Jan 15;15(1):528.
doi: 10.1038/s41467-023-44680-3.

Large scale plasma proteomics identifies novel proteins and protein networks associated with heart failure development

Affiliations

Large scale plasma proteomics identifies novel proteins and protein networks associated with heart failure development

Amil M Shah et al. Nat Commun. .

Abstract

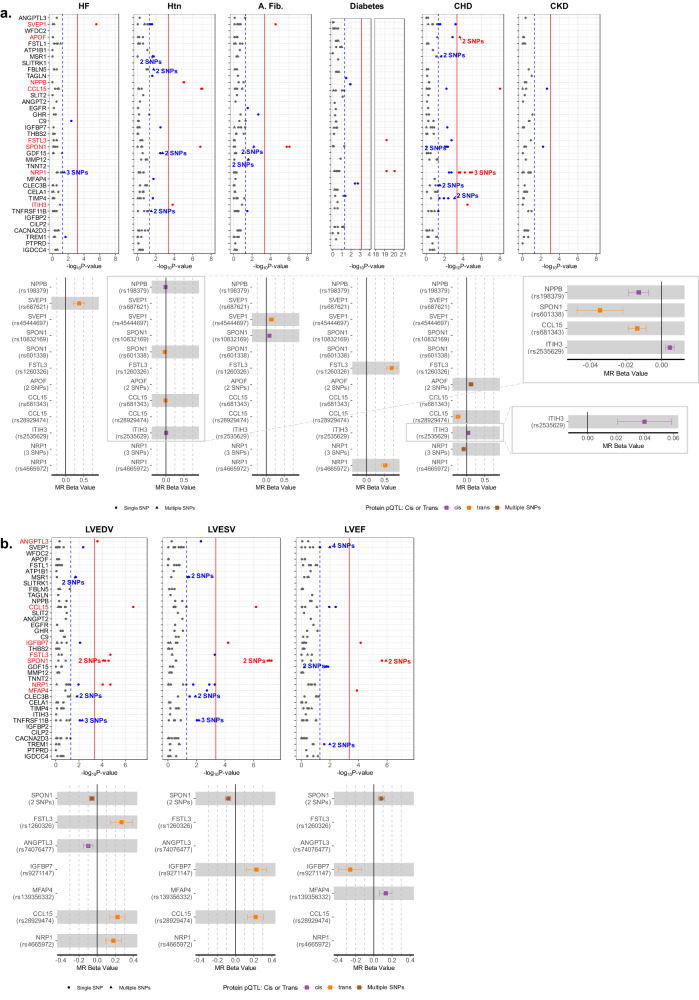
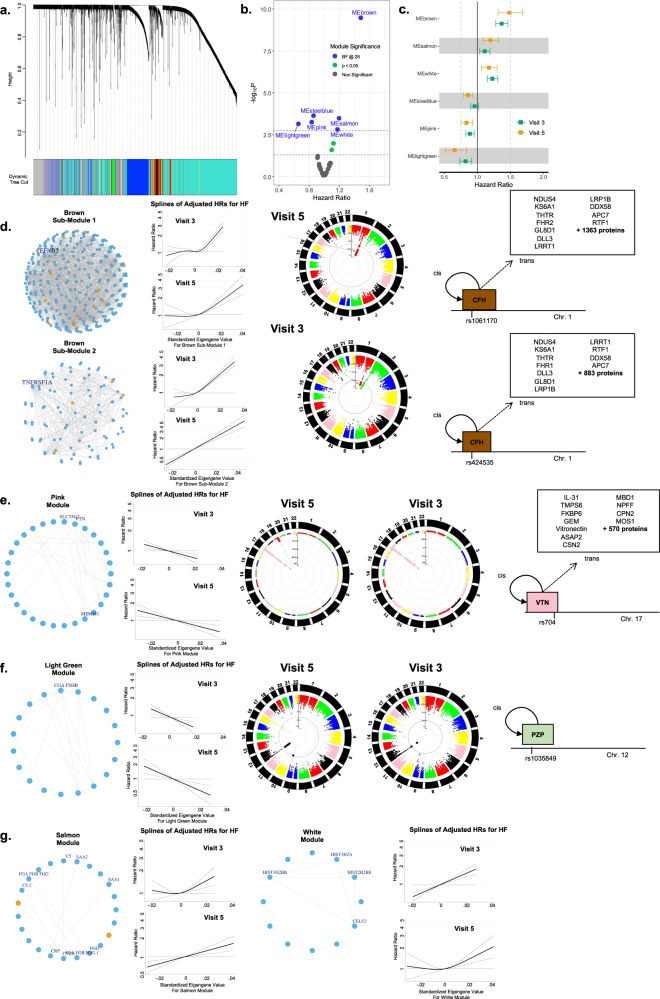
Heart failure (HF) causes substantial morbidity and mortality but its pathobiology is incompletely understood. The proteome is a promising intermediate phenotype for discovery of novel mechanisms. We measured 4877 plasma proteins in 13,900 HF-free individuals across three analysis sets with diverse age, geography, and HF ascertainment to identify circulating proteins and protein networks associated with HF development. Parallel analyses in Atherosclerosis Risk in Communities study participants in mid-life and late-life and in Trøndelag Health Study participants identified 37 proteins consistently associated with incident HF independent of traditional risk factors. Mendelian randomization supported causal effects of 10 on HF, HF risk factors, or left ventricular size and function, including matricellular (e.g. SPON1, MFAP4), senescence-associated (FSTL3, IGFBP7), and inflammatory (SVEP1, CCL15, ITIH3) proteins. Protein co-regulation network analyses identified 5 modules associated with HF risk, two of which were influenced by genetic variants that implicated trans hotspots within the VTN and CFH genes.


Conflict of interest statement

The Atherosclerosis Risk in Communities study has been funded in whole or in part with Federal funds from the National Heart, Lung, and Blood Institute, National Institutes of Health, Department of Health and Human Services, under Contract nos. (HHSN268201700001I, HHSN268201700002I, HHSN268201700003I, HHSN268201700005I, HHSN268201700004I). Dr Shah was supported by NIH/NHLBI grants R01HL135008, R01HL143224, R01HL150342, R01HL148218, R01HL160025, and K24HL152008. Drs Myhre and Omland were supported by Research Council of Norway grant 296357/TOE. Dr Buckley was supported by NIH/NHLBI grant K23HL150311. Dr. Ballantyne was supported by NIH/NHLBI grant R01HL134320. Dr. Yu was in part supported by R01HL148218, R01 HL160793 and the JLH Foundation. The funder had no role design and conduct of this study; collection, management, analysis, and interpretation of the data; preparation, review, or approval of the manuscript; and decision to submit the manuscript for publication. Dr. Shah reports research support from Novartis through Brigham and Women’s Hospital and consulting fees from Philips Ultrasound and Janssen. Dr. Myhre has consulted for and/or received speaker honoraria from Amarin, AmGen, Bayer, AstraZeneca, Boehringer-Ingelheim, Novartis, Novo Nordisk, Pharmacosmos, and Us2.ai. Dr Dalen holds positions at Centre for Innovative Ultrasound Solutions (CIUS) and Precision Health Center for optimized cardiac care (ProCardio) - both Norwegian Research Council (NRC) centers for research-based innovation, where GE Healthcare, Horten, Norway is one of the institutional partners, has research contracts with GE Healthcare, and acts as research advisor for Boehringer Ingelheim. Dr. Hoogeveen reports research support from Denka Seiken through Baylor College of Medicine and consulting fees from Denka Seiken. Dr Ballantyne reports grant/research support from Abbott Diagnostic, Akcea, Amgen, Arrowhead, Esperion, Ionis, Merck, Novartis, Novo Nordisk, Regeneron, Roche Diagnostic, NIH, AHA, and ADA, and is a consultant for 89Bio, Abbott Diagnostics, Alnylam Pharmaceuticals, Althera, Amarin, Amgen, Arrowhead, Astra Zeneca, Denka Seiken, Esperion, Genentech, Gilead, Illumina, Ionis, Matinas BioPharma Inc, Merck, New Amsterdam, Novartis, Novo Nordisk, Pfizer, Regeneron, Roche Diagnostic. Dr. Coresh is a scientific advisor to Soma Logic. The remaining authors report no competing interests.

Figures

Fig. 1
Fig. 1. Schematic overview of study design.
The three analysis sets are: ARIC Visit 3 (1993-1995; age 60 ± 5 years, 54% women, 21% Black race), ARIC Visit 5 (2011-2013; age 75 ± 5 years, 58% women, 17% Black race), and HUNT cycle 3 (2006-2008; age 65 ± 10 years, 39% women, 0% Black race). For Mendelian randomization analysis, protein quantitative trait loci (pQTLs) were obtained from the INTERVAL, AGES, and Fenland studies as instrumental variables (IV). Summary statistics for heart failure were from the HERMES study and summary statistics for cardiac structure and function were from UK Biobank.
Fig. 2
Fig. 2. Association of individual proteomic measures with risk of developing HF.
Hazard ratios are based on single protein, multivariable Cox proportional hazard models adjusting for age, BMI, eGFR by CKD-EPI, race, sex, current smoking status, prevalent CAD, prevalent DM, prevalent AF, and prevalent hypertension. a Volcano plots of the associations of individual plasma proteins with incident HF in ARIC late-life (Visit 5), ARIC mid-life (Visit 3), and HUNT in models adjusted for demographics and clinical HF risk factors. Green – significant at FDR p < 0.05, Blue –Bonferroni (BF) significance (p < 1×10⁻⁵). b Hazard ratio-Hazard ratio plots demonstrating consistency of associations of proteins with incident HF identified in Panel A across analysis sets. Green – significant at FDR p < 0.05, Blue –Bonferroni significance (p < 1×10⁻⁵) in X-axis analysis set; Circle – significant at FDR p < 0.05, Triangle –Bonferroni significance (p < 1×10⁻⁵) in Y-axis analysis set. c Random forest (RF) analysis. Venn diagram demonstrating the number of proteins retained by RF analysis [see Methods] in each analysis set, and the overlap between analysis sets. Orange – ARIC late-life baseline (Visit 5), Green – ARIC mid-life baseline (Visit 3), Blue – HUNT. Table shows 16 proteins retained in parallel random forest analysis performed in each analysis set. Light blue indicates proteins not significant at FDR p < 0.05 in all three analysis sets in single protein Cox regression models. d Forest plot of hazard ratios with 95% confidence intervals for associations with incident HF for proteins associated with HF at FDR p < 0.05 or Bonferroni significance in all three analysis sets or retained in random forest analysis in all three analysis sets. Estimates to the left of the horizontal line are associated with a lower risk of incident HF while those to the right are associated with higher risk. Orange – ARIC late-life baseline (Visit 5, n = 4483), Green – ARIC mid-life baseline (Visit 3, n = 10,638), Blue – HUNT (n = 3262). Source data are provided as a Source Data file.
Fig. 3
Fig. 3. Associations of HF-related proteins with HF-risk factors.
Heatmap showing the associations of HF-associated proteins (Fig. 2d above) assessed at ARIC mid-life baseline (Visit 3) with the risk of incident diseases that are recognized as HF-risk factors post-Visit 3. Color shading indicates hazard ratio as indicated in the scale. Gray indicates non-significant association. Cox proportional hazard models adjusted for age, BMI, eGFR by CKD-EPI, race, sex, current smoking status, prevalent CAD, prevalent DM, prevalent AF, and prevalent hypertension, excluding the outcome variable from the adjustment, with FDR p-value < 0.05 considered significant. Color of the bar below the heatmap signifies the observed association of protein levels with incident HF risk. Red – higher protein level associates with higher risk of incident HF; Blue – higher protein level associates with lower risk of incident HF. Proteins were ordered using hierarchical clustering based on associations with incident HF risk factor development. Source data are provided as a Source Data file.
Fig. 4
Fig. 4. Associations of HF-related proteins with cardiac and non-cardiac function and incident HF phenotype in late-life.
a Heatmap showing the cross-sectional associations of HF-associated protein levels with measures of cardiac structure and function, arterial properties, pulmonary function, fat mass, grip strength, and anemia. Proteins were ordered using hierarchical clustering based on associations with cardiovascular and non-cardiovascular function. Linear regression models adjusted for age, BMI, eGFR by CKD-EPI, race, sex, current smoking status, prevalent CAD, prevalent DM, prevalent AF, and prevalent hypertension, and additionally for heart rate and systolic blood pressure for echocardiographic outcomes. Color shading indicates hazard ratio as indicated in the scale. Gray indicates non-significant association. FDR p-value < 0.05 was considered statistically significant after adjusting for multiple testing. Color of the bar below the heatmap signifies the observed association of protein levels with incident HF risk. Red – higher protein level associates with higher risk of incident HF; Blue – higher protein level associates with lower risk of incident HF. Proteins were ordered using hierarchical clustering based on associations with cardiovascular and non-cardiovascular function. b Hazard ratio-Hazard ratio plot demonstrating consistency of associations of candidate proteins with incident HFpEF (X axis) and HFrEF (Y axis) in the ARIC late-life analysis set (Visit 5). Hazard ratios (HRs) are based on single protein, multivariable Cox proportional hazard models adjusting for age, BMI, eGFR by CKD-EPI, race, sex, current smoking status, prevalent CAD, prevalent DM, prevalent AF, and prevalent hypertension. Color indicates outcomes for which statistically significant associations were observed (Orange – HFrEF, Green – HFpEF, Purple – Both, Gray – neither), which shape indicates strength of association (Triangle – FDR < 0.05, Circle – Bonferroni-corrected (BF) significance level). Source data are provided as a Source Data file.
Fig. 5
Fig. 5. Results of two-sample Mendelian randomization (MR) analyses.
a Manhattan plots of MR analyses of protein candidates with HF and HF risk factors. pQTLs are single SNP markers unless otherwise labeled. Hatched line indicates nominal significance (p < 0.05). Solid red line indicates significance after Bonferroni multiple testing correction. Gray pQTLs – non-significant, Blue – nominally significant, Red – significant after multiple testing correction. Forest plots demonstrate direction and magnitude of effect (MR beta estimate and 95% confidence interval) of genetically higher protein levels for significant pQTLs. Purple – Cis pQTL, Orange – Trans pQTL, Brown multi-SNP pQTL comprising both cis and trans SNPs. pQTLs were obtained from the INTERVAL (n = 3301), AGES (n = 5368), and Fenland (n = 10,708) studies. The summary statistics for HF were obtained from the HERMES consortium (n = 977,323). Summary statistics for atrial fibrillation were obtained from a GWAS meta-analysis of 6 studies (n = 1,030,836), for CHD were from UK Biobank and replicated using CARDIoGRAMplusC4D data (n = 296,525), for CKD were from a 43 study GWAS meta-analysis (n = 117,165), for DM were from a GWAS meta-analysis of 3 studies (n = 655,666), and for hypertension were from a UK Biobank GWAS (n = 463,010). b Manhattan plots of Mendelian randomization analyses of protein candidates with measures of left ventricular size and function (LVEDV, LVESV, LVEF). Forest plots show causal estimates with 95% confidence intervals. Summary statistics for LVEDV, LVESV and LVEF were obtained from UK Biobank (n = 36,041). See Methods. Source data are provided as a Source Data file.
Fig. 6
Fig. 6. ARIC late-life participant clusters based on the 10 proteins with significant associations in MR analyses derived using consensus clustering algorithm.
a Plot of the mean standard difference in the 10 proteins values in each cluster versus the overall sample. Hatched red lines indicate standard differences of 0.5 and −0.5. b Kaplan-Meier curves for incident HF after the ARIC late-life baseline by cluster assignment and adjusted hazard ratios for incident HF associated with clusters 2 and 3 with cluster 1 as reference. The Cox proportional hazards model was adjusted for age, gender, Field Center, hypertension, diabetes, BMI, atrial fibrillation, smoking status, CHD, and eGFR. Source data are provided as a Source Data file.
Fig. 7
Fig. 7. Weighted correlation network analysis.
a Hierarchical clustering dendrogram of plasma proteins from the ARIC late-life baseline (Visit 5) using dynamic tree cut identifies 28 protein modules. b Volcano plot showing the associations of module eigengene values with incident HF in Cox proportional hazard models adjusted for age, BMI, eGFR by CKD-EPI, race, sex, current smoking status, prevalent CAD, prevalent DM, prevalent AF, and prevalent hypertension. Green – modules significant at FDR p < 0.05, Blue – modules significant at Bonferroni-corrected significance level. c Forest plot demonstrating hazard ratios (HRs) with 95% confidence intervals for incident HF for HF-associated modules in the ARIC late-life baseline (Visit 5; orange; n = 4483) when applied to the ARIC mid-life baseline (Visit 3; green; n = 10,638) analysis set. HRs adjustment as in (b). d Brown module, submodules 1 and 2 network diagram, incidence rate splines for association with incident HF, and GWAS Manhattan plots. Both submodule eigengenes were consistently associated with greater risk of incident HF. Orange network nodes indicate HF-associated proteins identified in candidate analysis (Fig. 2). GWAS of submodule 1 eigengene value at Visit 3 and Visit 5 identified consistent genetic associations with SNPs in the complement factor H (CFH) gene on chromosome 1. Independent SNPs for two identified LD-based SNP clumps included a missense variant rs1061170 for Clump1 and rs424535 for Clump 2. Both demonstrated cis effects on CFH and trans effects on many proteins. e Pink module. Module eigengene was associated with consistently lower risk of incident HF. GWAS of the eigengene value at Visit 3 and Visit 5 identified consistent genetic associations with 34 independent SNPs in the vitronectin (VTN) gene on chromosome 17, including rs704 which demonstrated cis effects on VTN and trans effects on many proteins. f Light green module. Higher eigengene values were associated with consistently lower risk of developing HF. GWAS identified consistent associations with 2 SNPs in high LD in the pregnancy zone protein (PZP) gene on chromosome 12, which demonstrated cis effect on PZP. g Salmon and White modules. Both modules demonstrated consistent associations with higher risk of incident HF. Source data are provided as a Source Data file.

References

    1. Mozaffarian D, et al. Heart disease and stroke statistics-−2015 update: a report from the American Heart Association. Circulation. 2015;131:e29–e322. - PubMed
    1. Shah AM, et al. Heart Failure Stages Among Older Adults in the Community: The Atherosclerosis Risk in Communities Study. Circulation. 2017;135:224–240. doi: 10.1161/CIRCULATIONAHA.116.023361. - DOI - PMC - PubMed
    1. Loffredo FS, et al. Growth differentiation factor 11 is a circulating factor that reverses age-related cardiac hypertrophy. Cell. 2013;153:828–839. doi: 10.1016/j.cell.2013.04.015. - DOI - PMC - PubMed
    1. Swinney DC, Anthony J. How were new medicines discovered? Nat. Rev. Drug Discov. 2011;10:507–519. doi: 10.1038/nrd3480. - DOI - PubMed
    1. Nayor M, et al. Aptamer-Based Proteomic Platform Identifies Novel Protein Predictors of Incident Heart Failure and Echocardiographic Traits. Circ. Heart Fail. 2020;13:e006749. doi: 10.1161/CIRCHEARTFAILURE.119.006749. - DOI - PMC - PubMed