. 2024 May;45(5):900-913.
doi: 10.1038/s41401-023-01197-1. Epub 2024 Jan 15.

Corynoxine promotes TFEB/TFE3-mediated autophagy and alleviates Aβ pathology in Alzheimer's disease models

Affiliations

Corynoxine promotes TFEB/TFE3-mediated autophagy and alleviates Aβ pathology in Alzheimer's disease models

Xin-Jie Guan et al. Acta Pharmacol Sin. 2024 May.

Abstract

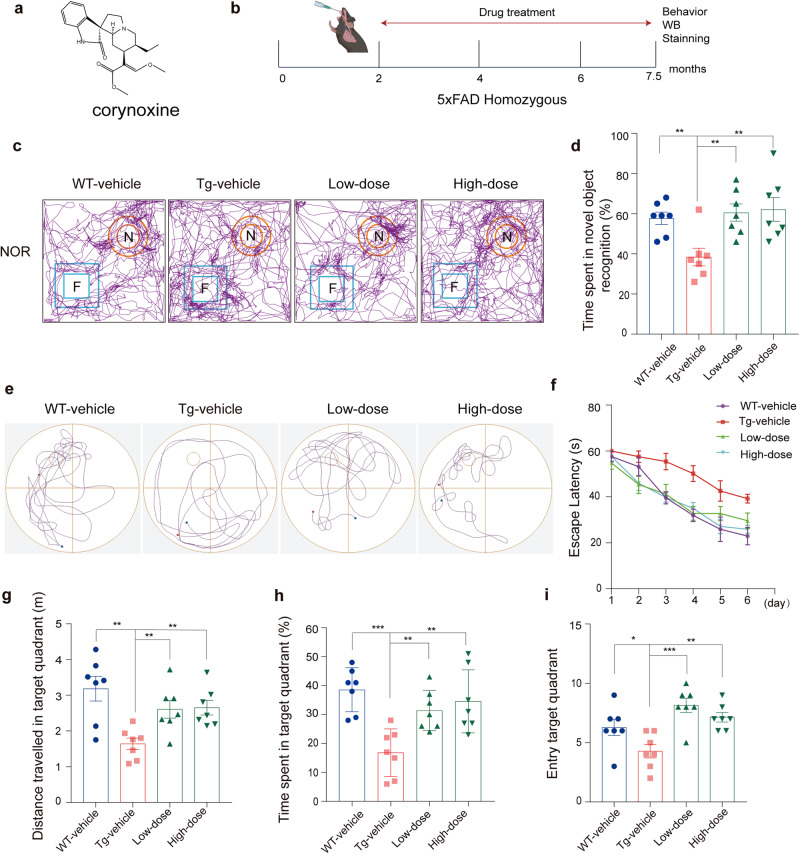
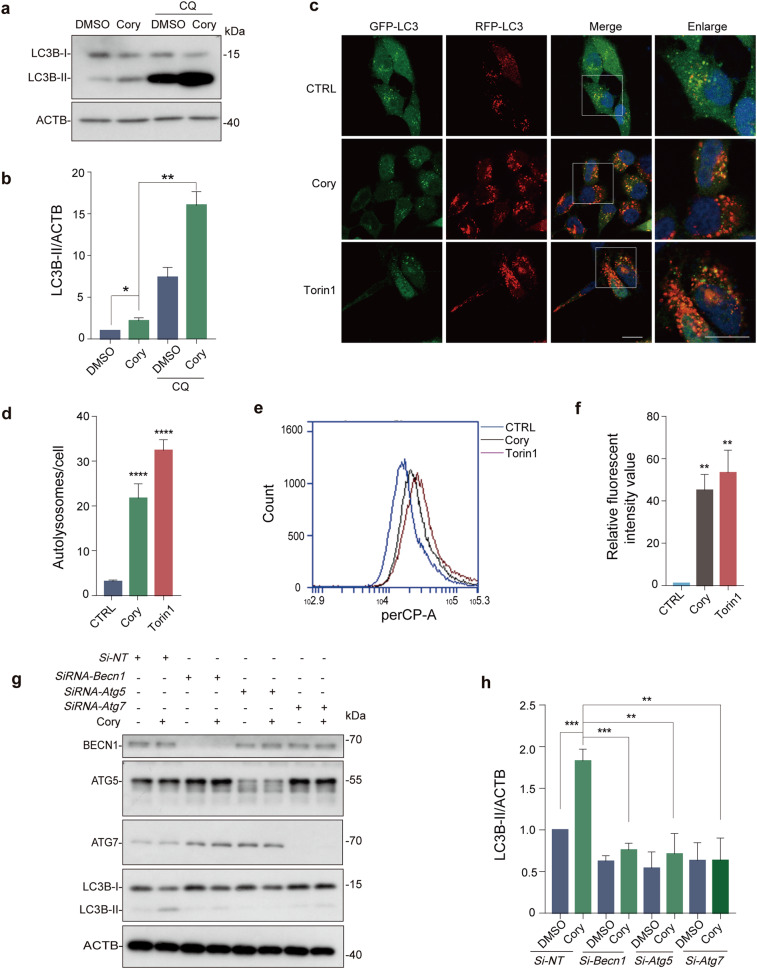
Autophagy impairment is a key factor in Alzheimer's disease (AD) pathogenesis. TFEB (transcription factor EB) and TFE3 (transcription factor binding to IGHM enhancer 3) are nuclear transcription factors that regulate autophagy and lysosomal biogenesis. We previously showed that corynoxine (Cory), a Chinese medicine compound, protects neurons from Parkinson's disease (PD) by activating autophagy. In this study, we investigated the effect of Cory on AD models in vivo and in vitro. We found that Cory improved learning and memory function, increased neuronal autophagy and lysosomal biogenesis, and reduced pathogenic APP-CTFs levels in 5xFAD mice model. Cory activated TFEB/TFE3 by inhibiting AKT/mTOR signaling and stimulating lysosomal calcium release via transient receptor potential mucolipin 1 (TRPML1). Moreover, we demonstrated that TFEB/TFE3 knockdown abolished Cory-induced APP-CTFs degradation in N2aSwedAPP cells. Our findings suggest that Cory promotes TFEB/TFE3-mediated autophagy and alleviates Aβ pathology in AD models.

Keywords: Alzheimer’s disease; TFEB/TFE3; autophagy; calcium; corynoxine.


Conflict of interest statement

The authors declare no competing interests.

Figures

Fig. 1
Fig. 1. Cory improves cognitive functions and rescues memory deficiency in 5xFAD mice.
a The chemical structure of corynoxine (Cory). b Schedule of Cory treatment and behavior experiments in 5xFAD mice (5, 10 mg/kg). c Representative tracks of WT, Tg and Cory-treated 5xFAD mice in novel object recognition test. (N means novel, F means familiar). d Time spent exploring the novel object. Data are presented as mean ± SEM. (n = 7). **, P < 0.01 vs. Tg-vehicle. e Representative swimming tracks of mice in the Morris water maze. f Escape latency over 6 days of training. Data are presented as mean ± SEM. (n = 7). g Distance travelled to reach the target quadrant. Data are presented as mean ± SEM, (n = 7). **, P < 0.01 vs. Tg-vehicle. h Each point in the graph represents the average value of three trials per day for each mouse, reflecting the time spent in the target quadrant in 60 s duration. (n = 7). **, P < 0.01, *** P < 0.001 vs. Tg-vehicle. i Each point in the graph represents the average value of three trials per day for each mouse, reflecting the frequency of entering the target quadrant. (n = 7). *, P < 0.05, **, P < 0.01, *** P < 0.001 vs. Tg-vehicle.
Fig. 2
Fig. 2. Cory enhances autophagy and reduces APP/CTFs accumulation in 5xFAD mice.
a Western blot analysis of Fl-APP and CTFs protein expression. b, c The relative intensity of Fl-APP and CTFs was normalized to ACTB. *, P < 0.05, **, P < 0.01 vs. Tg-vehicle. d Immunofluorescence staining of Aβ with 4G8 antibody. Green dots represent Aβ. Scan bar: 250 μm. e Quantification of Aβ in the hippocampus. *, P < 0.05 vs. Tg-vehicle. f Western blot analysis of SQSTM1 and LC3B protein expression. g, h The relative intensity of SQSTM1 and LC3B-II was normalized to ACTB. *, P < 0.05, **, P < 0.01 vs. Tg-vehicle. Samples were obtained from 5xFAD hippocampus, n = 6.
Fig. 3
Fig. 3. Cory enhances autophagy flux and lysosomal biogenesis in neuronal cell.
a, b Western blot analysis of LC3B-II levels in N2a cells treated with Cory (25 μM) with or without CQ (20 μM) treatment. LC3B-II expression was normalized to ACTB. *, P < 0.05, **, P < 0.01 vs. Cory group. Representative images are shown from three independent experiments. c, d Representative images from a tf-LC3 stable cell line after Cory (25 μM) treatment show the formation of autolysosomes captured using a fluorescent microscope. Statistically significant increase in autolysosomal formation is indicated. ****, P < 0.0001 vs. Ctrl group. Scan bar: 5 μm. e, f Lysosome biogenesis was assessed by detecting lysotracker dye intensity in N2a cells treated with Cory (25 μM) or Torin1 (250 nM) for 16 h. Representative images and relative fluorescence intensity of Cory and Torin1 treatments compared to the control group are shown. **, P < 0.01 vs. Ctrl group. g, h Western blot analysis of LC3B-II, BECN1, ATG5, and ATG7 levels after knockdown of indicated siRNA for 72 h with/without Cory (25 μM) treatment. LC3B-II expression was normalized to ACTB. **, P < 0.01, ***, P < 0.001 vs. Si-NT + Cory group. Data are presented as the mean ± SEM from three independent experiments.
Fig. 4
Fig. 4. Cory-induced autophagy was through the nuclear translocation of TFEB/TFE3.
a Representative images are presented after being treated with Cory (25 μM) and Torin1 (250 nM) at different time. Green fluorescence reflects TFEB/TFE3. Blue fluorescence reflects the DAPI. Scan bar: 25 μm. b, c The relative quantification of TFEB/TFE3 nuclear localization. ***, P < 0.001, ****, P < 0.0001 vs. Ctrl group. d The expression of LAMP1, SQSTM1, LC3B-II, TFEB, and TFE3 were detected after transfection of cells with indicated siRNAs for 72 h and Cory treatment for 6 h in N2a cells. Si-NT means siRNA-no target. eg Quantification data show that knockdown of TFEB/TFE3 changes Cory-induced expression of LAMP1, SQSTM1, LC3B-II levels. *, P < 0.05, ***, P < 0.001 vs.Cory treatment group with or without Si- TFEB/TFE3.
Fig. 5
Fig. 5. The translocation of Cory-mediated TFEB/TFE3 into the nucleus is dependent on the AKT/mTOR pathway.
a Cells lysates were analyzed for phospho and total AKT, mTOR, TFEB Ser142, RPS6KB1 by Western blotting after the treatment of 25 μM Cory for different time. bd Quantifications of p-AKT/t-AKT, p-mTOR/t-mTOR, and p-TFEB/ACTB ratios were shown. *, P < 0.05, **, P < 0.01 vs. DMSO group. e The expressions of LAMP1, SQSTM1, LC3B-II, and AKT were detected by Western blot after Myr-AKT overexpression for 48 h in N2a cells and treated with 25 μM Cory for 6 h. fg The expression of SQSTM1 and LC3B-II were normalized to ACTB. *, P < 0.05, **, P < 0.01 vs. DMSO group. h The protein expression level of TFEB/TFE3 in cytosol and nucleus were analysed by Western blotting after AKT-Myr overexpression for 48 h in N2a cells and treated with 25 μM Cory for 6 h. Data are analysed as mean ± SEM from three independent experiments.
Fig. 6
Fig. 6. TRPML1 inhibition hinders Cory-induced TFEB/TFE3 nuclear translocation and autophagy activation.
a Representative images of TFEB/TFE3 nuclear translocation. Cells were stained with TFEB/TFE3 antibody (green) and DAPI (blue). Scan bar: 25 μm. b Quantification of TFEB and TFE3 nuclear translocation. **, P < 0.01, ***, P < 0.001 vs. Cory group. c Western blot analysis of SQSTM1, LC3B-II expression with 25 μM Cory, with or without BAPTA-AM treatment. d, e Relative intensity of SQSTM1, LC3B-II normalized to ACTB. *, P < 0.05, **, P < 0.01 vs. DMSO group. f Western blot analysis of SQSTM1, LC3B-II expression in cell lysates treated with 25 μM Cory, with or without ML-SI1 treatment. g, h Relative intensity of SQSTM1, LC3B-II normalized to ACTB. *, P < 0.05 vs. DMSO group. i Fura-2 AM probe diluted in Ca2+-free HBSS was used to detect cytoplasmic Ca2+ concentration, with Cory added before detection. The peak of the 340/380 nm excitation ratio of Fura-2 was quantified from at least 100 cells and the experiment was repeated three times. j Western blot analysis of LC3B-II expression in cell lysates treated with 25 μM Cory or DMSO for 6 h after TRPML1 knockdown for 72 h. k Relative intensity of LC3B-II normalized to ACTB. *, P < 0.05 vs. Si-NT group. Data are presented as mean ± SEM from three independent experiments.
Fig. 7
Fig. 7. Cory reduces APP and CTFs protein levels in N2aSwedAPP cells.
a Western blot analysis was used to detect the expression levels of APP, CTFs, and LC3B-II after treatment with Cory (25 μM) in N2S cells. b, c The relative intensity of APP and CTFs was normalized to ACTB. Statistical significance is indicated by *, P < 0.05, **, P < 0.01 vs. DMSO group. d Western blot analysis was performed to detect the protein expression level of APP and CTFs after Cory (25 μM) treatment with or without CQ (20 μM) in N2S cells (CQ was added to cells 30 min before adding Cory). e, f The relative intensity of APP and CTFs was normalized to ACTB, and statistical significance is indicated by *, P < 0.05 vs. DMSO group. g Western blot analysis was used to detect the expression levels of APP and CTFs after Tfeb and Tfe3 knockdown for 72 h with or without Cory (25 μM) in N2S cells. h, i The relative intensity of APP and CTFs was normalized to ACTB. *, P < 0.05, **, P < 0.01 vs. Si-NT group. Data are presented as the mean ± SEM from three independent experiments.
Fig. 8
Fig. 8. Cory activates TFEB/TFE3 in the hippocampus of 5xFAD mice.
a Western blot showed the protein level of TFEB/TFE3 in cytosol and nucleus in the hippocampus lysates of 5xFAD mice. b Western blot analysis of TFEB Ser 142 protein expression. c The relative intensity of TFEB Ser 142 was normalized to ACTB. **, P < 0.01, ***, P < 0.001 vs. Tg-vehicle. Samples were obtained from 5xFAD hippocampus, n = 6. d Western blot analysis was used to detect the expression level of p-AKT/AKT, p-mTOR/mTOR in vivo. e, f The relative intensity of p-AKT and p-mTOR were normalized to AKT and mTOR. *, P < 0.05, ***, P < 0.001 vs. Tg vehicle.
Fig. 9
Fig. 9. Schematic illustration of the mechanism in Cory-mediated autophagy.
This schematic illustrates the underlying mechanism of Cory-mediated autophagy. Our findings demonstrate that Cory facilitates the nuclear translocation of TFEB/TFE3 with the involvement of AKT/mTOR and TRPML1. Our study underscores the essential role of TFEB and TFE3 in regulating autophagy and promoting the degradation of disease-prone proteins when autophagy is induced. Additionally, our research confirms the neuroprotective effects of Cory in AD, expanding its potential application in treating neurodegenerative diseases.

References

    1. Haque RU, Levey AI. Alzheimer’s disease: A clinical perspective and future nonhuman primate research opportunities. Proc Natl Acad Sci USA. 2019;116:26224–9. - PMC - PubMed
    1. Zhang F, Zhong RJ, Cheng C, Li S, Le WD. New therapeutics beyond amyloid-beta and tau for the treatment of Alzheimer’s disease. Acta Pharmacol Sin. 2021;42:1382–9. doi: 10.1038/s41401-020-00565-5. - DOI - PMC - PubMed
    1. Baumann KN, Sneideriene G, Sanguanini M, Schneider M, Rimon O, Gonzalez Diaz A, et al. A kinetic map of the influence of biomimetic lipid model membranes on Abeta(42) aggregation. ACS Chem Neurosci. 2022;14:323–9. - PMC - PubMed
    1. Lane CA, Hardy J, Schott JM. Alzheimer’s disease. Eur J Neurol. 2018;25:59–70. doi: 10.1111/ene.13439. - DOI - PubMed
    1. Zhang Z, Yang X, Song YQ, Tu J. Autophagy in Alzheimer’s disease pathogenesis: Therapeutic potential and future perspectives. Ageing Res Rev. 2021;72:101464. doi: 10.1016/j.arr.2021.101464. - DOI - PubMed

MeSH terms

Substances

LinkOut - more resources