. 2024 May;45(5):959-974.
doi: 10.1038/s41401-023-01222-3. Epub 2024 Jan 15.

Macrophages promote the transition from myocardial ischemia reperfusion injury to cardiac fibrosis in mice through GMCSF/CCL2/CCR2 and phenotype switching

Affiliations

Macrophages promote the transition from myocardial ischemia reperfusion injury to cardiac fibrosis in mice through GMCSF/CCL2/CCR2 and phenotype switching

Shi-Chun Shen et al. Acta Pharmacol Sin. 2024 May.

Abstract

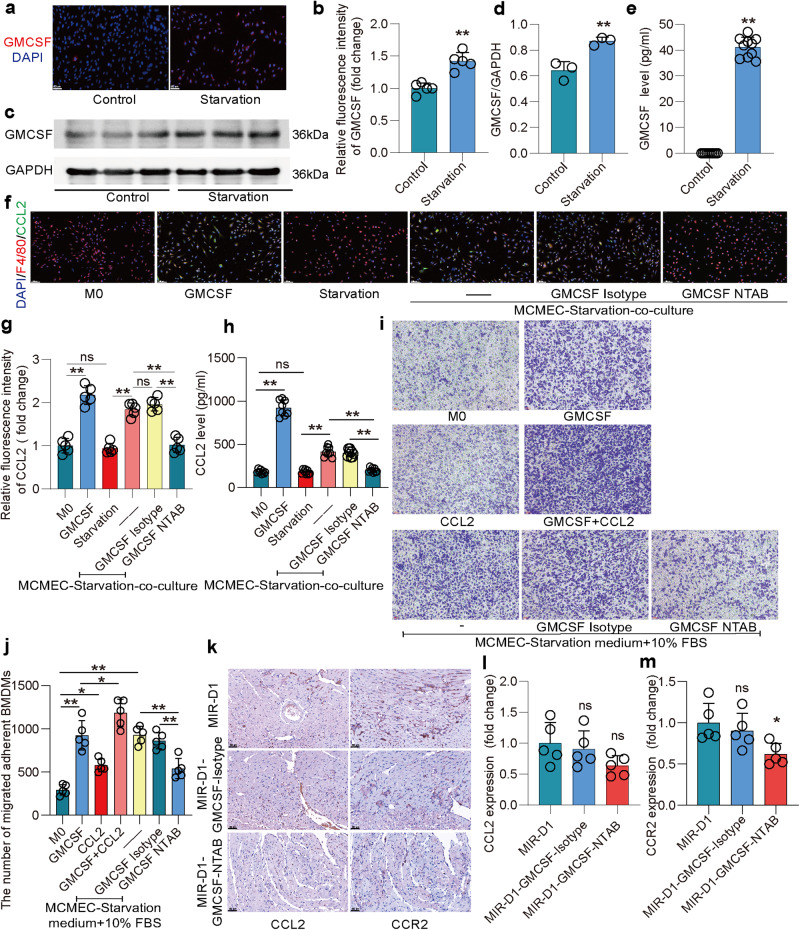
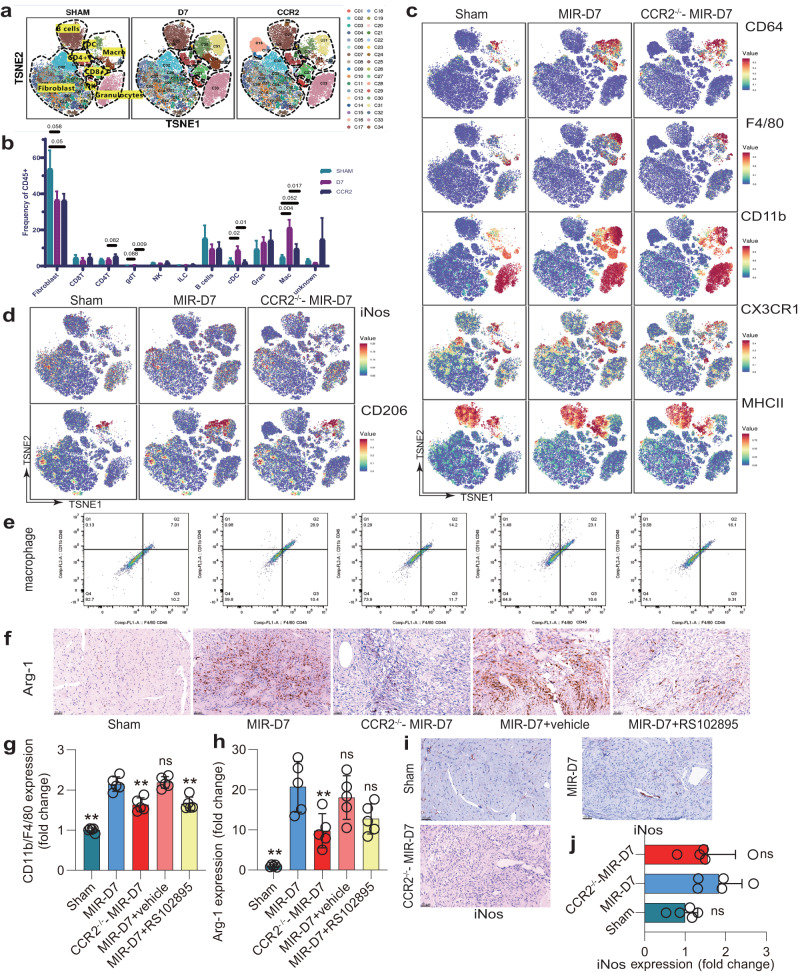
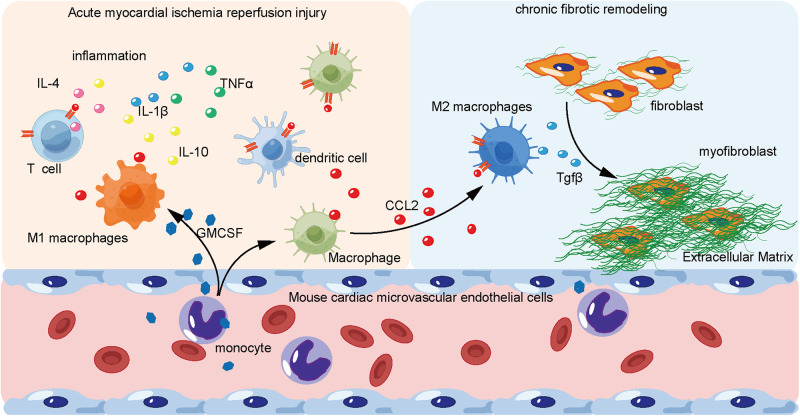
Following acute myocardial ischemia reperfusion (MIR), macrophages infiltrate damaged cardiac tissue and alter their polarization phenotype to respond to acute inflammation and chronic fibrotic remodeling. In this study we investigated the role of macrophages in post-ischemic myocardial fibrosis and explored therapeutic targets for myocardial fibrosis. Male mice were subjected to ligation of the left coronary artery for 30 min. We first detected the levels of chemokines in heart tissue that recruited immune cells infiltrating into the heart, and found that granulocyte-macrophage colony-stimulating factor (GMCSF) released by mouse cardiac microvascular endothelial cells (MCMECs) peaked at 6 h after reperfusion, and c-c motif chemokine ligand 2 (CCL2) released by GMCSF-induced macrophages peaked at 24 h after reperfusion. In co-culture of BMDMs with MCMECs, we demonstrated that GMCSF derived from MCMECs stimulated the release of CCL2 by BMDMs and effectively promoted the migration of BMDMs. We also confirmed that GMCSF promoted M1 polarization of macrophages in vitro, while GMCSF neutralizing antibodies (NTABs) blocked CCL2/CCR2 signaling. In MIR mouse heart, we showed that GMCSF activated CCL2/CCR2 signaling to promote NLRP3/caspase-1/IL-1β-mediated and amplified inflammatory damage. Knockdown of CC chemokine receptor 2 gene (CCR2-/-), or administration of specific CCR2 inhibitor RS102895 (5 mg/kg per 12 h, i.p., one day before MIR and continuously until the end of the experiment) effectively reduced the area of myocardial infarction, and down-regulated inflammatory mediators and NLRP3/Caspase-1/IL-1β signaling. Mass cytometry confirmed that M2 macrophages played an important role during fibrosis, while macrophage-depleted mice exhibited significantly reduced transforming growth factor-β (Tgf-β) levels in heart tissue after MIR. In co-culture of macrophages with fibroblasts, treatment with recombinant mouse CCL2 stimulated macrophages to release a large amount of Tgf-β, and promoted the release of Col1α1 by fibroblasts. This effect was diminished in BMDMs from CCR2-/- mice. After knocking out or inhibiting CCR2-gene, the levels of Tgf-β were significantly reduced, as was the level of myocardial fibrosis, and cardiac function was protected. This study confirms that the acute injury to chronic fibrosis transition after MIR in mice is mediated by GMCSF/CCL2/CCR2 signaling in macrophages through NLRP3 inflammatory cascade and the phenotype switching.

Keywords: CCL2/CCR2; GMCSF; cardiac fibrosis; macrophages polarization; myocardial ischemia reperfusion; transforming growth factor-β.


Conflict of interest statement

The authors declare no competing interests.

Figures

Fig. 1
Fig. 1. Macrophages infiltration during the transition from acute MIR injury to fibrosis.
a Representative images of heart HE staining at each time point before and after MIR. Scale bars = 50 µm, n = 5. b Masson staining detect the fibrosis level of each group. Scale bars = 500 µm, n = 5. c Sirius red staining detects the fibrosis level of each group. Scale bars = 50 µm, n = 5. df Hearts were harvested in each group and heart sections immunostained with anti-CD68, iNos, and Arg-1. Scale bars = 50 µm, n = 5. gi Quantification of CD68, iNos, and Arg-1-positive area as performed in (df), n = 5. ns no significance; **P < 0.01 compared to Sham group, one-way ANOVA.
Fig. 2
Fig. 2. Cytokine levels in mouse heart tissue at different time points after MIR.
a Quantification of heart chemokine concentrations at different time points after MIR injury and Sham group, n = 3. ns no significance; *P < 0.05; **P < 0.01 compared to D1, one-way ANOVA. bg Hearts were harvested at each group and heart sections immunostained with anti-GMCSF, CCL2, and CCR2, and Quantification of GMCSF, CCL2, and CCR2-positive area. Scale bars = 50 µm, n = 5. ns no significance; *P < 0.05; **P < 0.01 compared to Sham, one-way ANOVA. h the concentration of GMCSF and CCL2 in heart at different time points within 24 h after MIR injury and Sham group, n = 5. ns no significance; *P < 0.05; **P < 0.01 compared to Sham, one-way ANOVA. i On the 1st day post MIR, heart tissue was digested into a single-cell suspension and subjected to cell sorting to explore the source of GMCSF. n = 5. j Representative immunofluorescence images of anti-CD68, CCL2, CCR2 co-staining of sham or 2, 6, 12, 24 h post MIR in damaged heart tissues. Yellow arrows indicate the co-localization of CCR2+CD68+ cells and CCL2 in the heart. Scale bars = 50 µm, n = 5.
Fig. 3
Fig. 3. MCMECs releases GMCSF under starvation treatment, inducing macrophage migration and releasing CCL2.
a Detection of GMCSF expression level in MCMECs by immunofluorescence and b Quantification of GMCSF-positive area as performed in (a). Scale bars = 50 µm, n = 5. ns no significance; **P < 0.01 compared to control, Student’s t-test. c Western blot of GMCSF in MCMECs and d quantified and normalized to GAPDH. n = 3. ns no significance; **P < 0.01 compared to control, Student’s t-test. e Released GMCSF levels in MCMEC culture supernatants, n = 8. ns no significance; **P < 0.01 compared to control, Student’s t-test. f The CCL2 expression level in BMDMs after treatment for 24 h with exogenous recombinant mouse GMCSF, co-cultured with MCMECs with or without GMCSF NTAB. Scale bars = 50 µm, n = 5. g Quantification of CCL2-positive area as performed in (f). n = 5. ns no significance; **P < 0.01, one-way ANOVA. h Released CCL2 levels in BMDMs culture supernatants, n = 8. ns no significance; **P < 0.01, one-way ANOVA. i, j The numbers of Transwell migrated adherent BMDMs after 24 h of GM‐CSF (50 ng/mL) and/or CCL2 (50 ng/mL) treatments, cultured with MCMEC medium with/without GMCSF NTAB. Scale bars = 100 µm, n = 5. ns no significance; *P < 0.05; **P < 0.01, one-way ANOVA. km The expression levels of CCL2 and CCR2 in mouse treated with GMCSF NTAB and isotype controls after MIR were measured. Scale bars = 50 µm, n = 5. ns no significance; *P < 0.05 compared to MIR-D1, one-way ANOVA.
Fig. 4
Fig. 4. GMCSF/CCL2/CCR2 promotes the transition from MIR injury to cardiac fibrosis through the NLRP3 signaling pathway.
a, b Evans blue and TTC staining detect the infarct size and area at risk after MIR in WT mice treated with CCR2 inhibitor or not and CCR2−/− mice, n = 5. ns no significance; *P < 0.05; **P < 0.01 compared to WT-MIR, one-way ANOVA. c, d The serum level of cTnI, CKMB, and LDH was detected at 1st day after MIR in WT mice treated with CCR2 inhibitor (RS102895) or not and CCR2−/− mice, n = 8. ns no significance; *P < 0.05; **P < 0.01 compared to WT-MIR, one-way ANOVA. e Inflammatory factor levels in mouse after MIR, n = 3. ns no significance; *P < 0.05; **P < 0.01, Student’s t-test. f, g Western blots of GMCSF, CCL2, NLRP3, Caspase-1, and IL-1β and the quantification of expression on 1st day after MIR and sham group. n = 5. ns no significance; **P < 0.01 compared to WT-MIR, one-way ANOVA. h, i Western blots of NLRP3, Caspase-1, and IL-1β and the quantification of expression on 1st day after MIR. n = 5. ns no significance; *P < 0.05, **P < 0.01 compared to WT-MIR group, one-way ANOVA.
Fig. 5
Fig. 5. CCL2 reverses M1 macrophage-induced by GMCSF to the M2 macrophage, which releases Tgf-β to promote the transformation of fibroblasts into myofibroblasts.
a The expression level of iNos in BMDMs after 24 h of GMCSF (50 ng/mL) and/or CCL2 (50 ng/mL) treatments. Scale bars, 50 µm, n = 5. b Quantification of iNos-positive area as performed in Fig. 5a, n = 5. ns no significance; **P < 0.01, one-way ANOVA. c Western blot of Arg-1 in BMDMs and d quantified and normalized to GAPDH, n = 5. ns no significance; **P < 0.01, one-way ANOVA. e The concentration of Tgf-β in heart at different time points after MIR injury and Sham group, n = 5. ns no significance; **P < 0.01 compared to Sham, one-way ANOVA. f Mouse experiencing macrophage depletion showed changes in Tgf-β post MIR and g quantified and normalized to GAPDH, n = 5. ns no significance; *P < 0.05, **P < 0.01 compared to WT-MIR, one-way ANOVA. h The expression level of Tgf-β in BMDMs after 24 h of recombinant mouse GMCSF (50 ng/mL) and/or CCL2 (50 ng/mL) treatments. Scale bars = 50 µm, n = 5. i Quantification of Tgf-β-positive area as performed in (h), n = 5. ns no significance; *P < 0.05, **P < 0.01, one-way ANOVA. j The expression level of Col1α1 in PCFs co-cultured with BMDMs. Scale bars = 50 µm, n = 5. k, l Quantification of myofibroblast size and Col1α1-positive area as performed in (j), n = 5. ns no significance; **P < 0.01, one-way ANOVA.
Fig. 6
Fig. 6. The effect of inhibiting CCR2 on fibrosis and cardiac function after MIR injury.
a Heart sections were immunostained with anti-Col1α1 (green), anti-Tgf-β (red), and DAPI (identifies nuclei, blue). Scale bars = 50 µm, n = 5. b, c Quantification of Col1α1 and Tgf-β-positive area as performed in (a), n = 5. ns no significance; **P < 0.01, one-way ANOVA. d, e Masson staining of heart at 7th days after MIR and Quantification of fibrosis size. Scale bars = 500 µm, n = 5. ns no significance; **P < 0.01, one-way ANOVA. f, g Masson staining of heart at 14th day after MIR and Quantification of fibrosis size. Scale bars = 500 µm, n = 5. ns no significance; **P < 0.01, one-way ANOVA. h Representative M-mode echocardiographic images at 30th day after MIR. ik LVESV/LVED, LVEF, and FS as performed in (h), n = 5. ns no significance; *P < 0.05; **P < 0.01 compared to MIR-D30, one-way ANOVA. l Heart weight index was presented as heart weight/body weight at 30th day after MIR, n = 5. ns no significance; **P < 0.01 compared to MIR-D30, one-way ANOVA.
Fig. 7
Fig. 7. Mass cytometry detection of the cardiac immune microenvironment status of mouse on the seventh day after MIR.
a Representative TSNE plot showing unsupervised clustering of cardiac immune cells. b Quantification of each cell in Sham and MIR conditions, n = 9. Each dot represents a single cell in the TSNE plot. c, d Representative TSNE plots from CyTOF data showing colored expression in arbitrary units (AU) of CD64, F4/80, CD11b, CX3CR1, MHC-II, CD206, and iNos in cardiac immune cells in Sham and MIR conditions, n = 9. e Representative flow cytometry plots and g quantification of cardiac macrophages in Sham and 7th day after MIR in mice. n = 5. ns no significance; **P < 0.01 compared to MIR-D7, one-way ANOVA. f Hearts were harvested at Sham and MIR group and heart sections immunostained with anti-Arg-1 and h quantification of Arg-1-positive area as performed in (f). Scale bars = 50 µm, n = 5. ns no significance; **P < 0.01 compared to MIR-D7, one-way ANOVA. i Hearts were harvested at Sham and MIR condition and heart sections immunostained with anti-Arg-1. Scale bars = 50 µm, n = 5. j Quantification of Arg-1-positive area as performed in (i), n = 5. ns no significance; *P < 0.05; **P < 0.01 compared to MIR-D7, one-way ANOVA.
Fig. 8
Fig. 8. Mass cytometry detection of the cardiac immune microenvironment status of mouse on the 7th day after MIR.
a Representative TSNE plots from CyTOF data showing colored expression in arbitrary units (AU) of CD11c, Ly6g, CD3e, and CD19 in cardiac immune cells in Sham and MIR conditions, n = 9. b Representative flow cytometry plots and f quantification of cardiac dendritic cells in Sham and 7th days after MIR in mouse. n = 5. ce Hearts were harvested at sham and MIR group and heart sections immunostained with anti-Ly6g, CD3e, and CD19. Scale bars = 50 µm, n = 5. gi Quantification of Ly6g, CD3e, and CD19-positive area as performed in (ce), n = 5. ns no significance; **P < 0.01 compared to MIR-D7, one-way ANOVA.
Fig. 9
Fig. 9. After myocardial ischemic injury, cardiac microvascular endothelial cells release a large amount of GMCSF to attract monocytes to migrate to the heart, which differentiate into macrophages and transform into pro-inflammatory M1 phenotype under GMCSF induction, releasing a large amount of inflammatory factors and CCL2.
CCL2 recruits a large number of CCR2+ cells to infiltrate the damaged myocardial tissue, releasing inflammatory mediators to promote inflammatory response. CCL2 stimulates CCR2+ macrophages to transform into reparative M2 phenotype, which releases Tgf-β to promote the transformation of fibroblasts into myofibroblasts and release a large amount of extracellular matrix, leading to fibrosis (by Figdraw).

References

    1. Prabhu SD, Frangogiannis NG. The biological basis for cardiac repair after myocardial infarction: from inflammation to fibrosis. Circ Res. 2016;119:91–112. doi: 10.1161/CIRCRESAHA.116.303577. - DOI - PMC - PubMed
    1. Savarese G, Lund LH. Global public health burden of heart failure. Card Fail Rev. 2017;3:7–11. doi: 10.15420/cfr.2016:25:2. - DOI - PMC - PubMed
    1. Chiu J-J, Chien S. Effects of disturbed flow on vascular endothelium: pathophysiological basis and clinical perspectives. Physiol Rev. 2011;91:327–87. doi: 10.1152/physrev.00047.2009. - DOI - PMC - PubMed
    1. Zuidema MY, Zhang C. Ischemia/reperfusion injury: the role of immune cells. World J Cardiol. 2010;2:325–32. doi: 10.4330/wjc.v2.i10.325. - DOI - PMC - PubMed
    1. Venugopal H, Hanna A, Humeres C, Frangogiannis NG. Properties and functions of fibroblasts and myofibroblasts in myocardial infarction. Cells. 2022;11:1386. doi: 10.3390/cells11091386. - DOI - PMC - PubMed

MeSH terms

LinkOut - more resources