. 2024 Aug;20(8):1012-1021.
doi: 10.1038/s41589-023-01529-6. Epub 2024 Jan 15.

Vaccine design via antigen reorientation

Affiliations

Vaccine design via antigen reorientation

Duo Xu et al. Nat Chem Biol. 2024 Aug.

Abstract

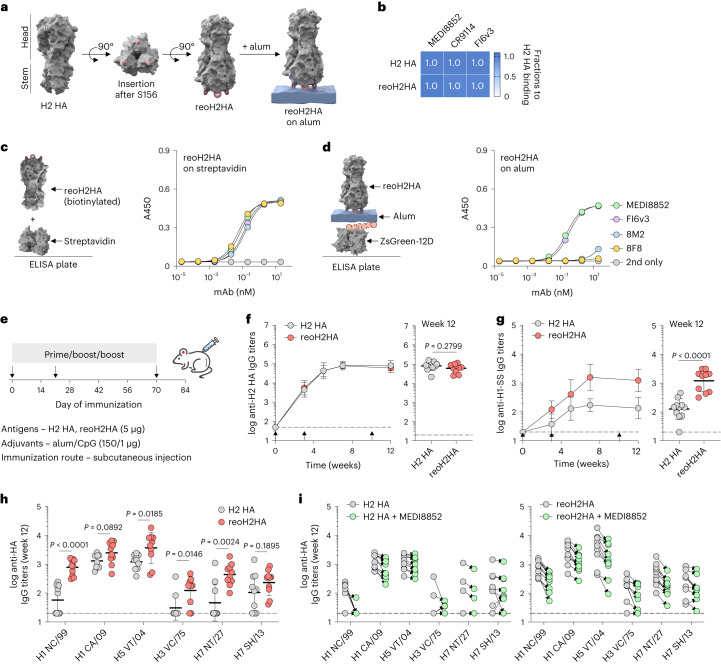
A major challenge in creating universal influenza vaccines is to focus immune responses away from the immunodominant, variable head region of hemagglutinin (HA-head) and toward the evolutionarily conserved stem region (HA-stem). Here we introduce an approach to control antigen orientation via site-specific insertion of aspartate residues that facilitates antigen binding to alum. We demonstrate the generalizability of this approach with antigens from Ebola, severe acute respiratory syndrome coronavirus 2 (SARS-CoV-2) and influenza viruses and observe enhanced neutralizing antibody responses in all cases. We then reorient an H2 HA in an 'upside-down' configuration to increase the exposure and immunogenicity of HA-stem. The reoriented H2 HA (reoH2HA) on alum induced stem-directed antibodies that cross-react with both group 1 and group 2 influenza A subtypes. Electron microscopy polyclonal epitope mapping (EMPEM) revealed that reoH2HA (group 1) elicits cross-reactive antibodies targeting group 2 HA-stems. Our results highlight antigen reorientation as a generalizable approach for designing epitope-focused vaccines.


Conflict of interest statement

D.X., P.A.B.W. and P.S.K. are named as inventors on a patent application applied for by Stanford University and the Chan Zuckerberg Biohub on engineering antigen binding and orientation on alum adjuvants. P.A.B.W. is an employee of Vaccine Company, Inc., and P.S.K. is a co-founder and member of the Board of Directors of Vaccine Company, Inc. All other authors declare no competing interests.

Figures

Fig. 1
Fig. 1. OligoD insertion enables antigen binding to alum and enhances neutralizing antibody responses.
a, Site-specific insertion of oligoD of different lengths (2, 4, 8 or 12 aspartate residues, pink) at the C-terminus of Ebola GP (Protein Data Bank ID: 5JQ3). b, Thermal melting profiles of wild-type or oligoD-modified GP measured by differential scanning fluorimetry. c, Analysis of GP-specific mAb binding of wild-type or oligoD-modified GP by BLI. Shifts in nanometers of mAb-binding to oligoD-modified GP were normalized as a fraction of shifts to wild-type GP binding. Fractions were calculated based on data in Supplementary Fig. 1. d,e, Detection and quantification of alum-bound GP by western blot analysis (d) and ELISA (e). Upon separation, alum-bound GP was detected by mAb114 on the western blot, and unbound GP was quantified by ELISA as in Extended Data Fig. 1f. The dashed line indicates 100% binding to alum in e. Data are presented as mean ± s.d. (n = 3 samples per group). f, A single-dose immunization study with GP or GP-12D adjuvanted with alum via subcutaneous injection in BALB/c mice. g, Serum GP-specific IgG titers over time. Antibody titers at weeks 6 and 12 after immunization are plotted on the right for comparison of the two groups (n = 6 mice per group). h, Serum NT50 against EBOVs over time. i, NT50 of weeks 6 and 12 from the two groups are shown for comparison (n = 6 mice per group). Dashed lines indicate the limit of quantification in gi. Data are presented as geometric mean ± s.d. of the log10‐transformed values (gi). Comparison of IgG titers (g) or NT50 (h) over time was performed using two-way ANOVA followed by a Bonferroni test. Comparison of two groups was performed using the two-tailed Mann–Whitney U-test (g,i). P values of 0.05 or less were considered significant. Source data
Fig. 2
Fig. 2. OligoD-modified GP stimulates a robust GC response.
a, Immunization schedule for the analysis of GC responses in draining lymph nodes. BALB/c mice were immunized with GP or GP-12D adjuvanted with alum. Antibody titers and GC responses were measured before immunization and 7 d, 14 d or 21 d after immunization. b, Serum GP-specific IgG1 titers over time (n = 10 mice per antigen per timepoint). Data are presented as geometric mean ± s.d. of the log10‐transformed values. Dashed lines indicate the limit of quantification. c,d, Analysis of GC B cell (c) and TFH cell (d) responses after immunization. Each circle represents a single mouse (n = 10 mice per antigen per timepoint). Data are presented as mean ± s.d. Comparison of two groups was performed using the two-tailed Mann–Whitney U-test (bd). P values of 0.05 or less were considered significant. Source data
Fig. 3
Fig. 3. OligoD insertion into spike enhances neutralizing antibody responses.
a, Insertion of oligoD (12D) at the C-terminus of SARS-CoV-2 spike (Protein Data Bank ID: 6VXX). b, BLI binding analysis of spike or spike-12D with ACE2–Fc and three spike-specific mAbs. c, A three-dose immunization study with spike or spike-12D adjuvanted with alum via subcutaneous injection in BALB/c mice. d,e, Serum spike-specific (d) or RBD-specific (e) IgG titers over time (n = 10 mice per group). Endpoint (week 9) antibody titers are plotted on the right for comparison of the two groups. f, Serum NT50 against SARS-CoV-2 spike-pseudotyped lentiviruses over time (n = 10 mice per group). Endpoint (week 9) NT50 are plotted on the right for comparison of the two groups. g, Endpoint (week 9) NT50 against SARS-CoV-2 variants of concern from the two groups. Each circle represents a single mouse (n = 10 mice per group). Dashed lines indicate the limit of quantification in dg. Arrows in df indicate prime and boost immunizations. Data are presented as geometric mean ± s.d. of the log10‐transformed values. Comparison of IgG titers (d,e) or NT50 (f) over time was performed using two-way ANOVA followed by a Bonferroni test. Comparison of two groups was performed using the two-tailed Mann–Whitney U-test (dg). P values of 0.05 or less were considered significant. Source data
Fig. 4
Fig. 4. OligoD insertion into HA enhances neutralizing antibody responses.
a, Insertion of oligoD (12D) at the C-terminus of H1 HA (Protein Data Bank ID: 1RU7 for reference). b, BLI binding analysis of H1 HA or H1 HA-12D with HA-specific mAbs. c, A prime-boost immunization study with H1 HA or H1 HA-12D adjuvanted with alum via subcutaneous injection in BALB/c mice. d, Serum H1 HA-specific IgG titers over time (n = 10 mice per group). Antibody titers of week 8 and week 14 from the two groups are plotted on the right for comparison (each circle represents a single mouse). e, Serum NT50 against authentic H1N1 A/NC/20/99 viruses over time (n = 10 mice per group). NT50 at weeks 8 and 14 are plotted on the right for comparison (each circle represents a single mouse). f, Serum binding titers to H1 HA in the presence of competing mAbs. Each circle represents a single mouse. Fold change is indicated by arrows with numbers. Dashed lines indicate the limit of quantification in df. Arrows in d,e indicate prime and boost immunizations. Data are presented as geometric mean ± s.d. of the log10‐transformed values. Comparison of IgG titers (d) or NT50 (e) over time was performed using two-way ANOVA followed by a Bonferroni test. Comparison of two groups was performed using the two-tailed Mann–Whitney U-test (d,e). Comparison of multiple groups was performed using one-way ANOVA followed by a Bonferroni test (f). P values of 0.05 or less were considered significant. Source data
Fig. 5
Fig. 5. Reorientation of H2 HA enabled immunofocusing on HA-stem.
a, Insertion of oligoD into the head of H2 HA (A/Japan/305/1957) after residue S156 (Protein Data Bank ID: 2WRE). Three oligoD motifs on HA-head allowed for its tri-valent anchoring on alum. b, BLI binding analysis of H2 HA or reoH2HA with HA-stem-specific mAbs. c,d, Binding of stem-directed (MEDI8852 and FI6v3) or head-directed (8F8 and 8M2) mAbs to reoH2HA on streptavidin-coated (c) or alum-coated (d) ELISA plates. Data are presented as mean ± s.d. (n = 4 technical replicates). e, A three-dose immunization study with H2 HA or reoH2HA adjuvanted with alum/CpG in BALB/c mice. f,g, Serum H2 HA-specific (f) or stem-specific (g) IgG titers over time (n = 10 mice per group). Stem-specific IgG titers were measured with the H1-SS protein. Endpoint (week 12) antibody titers from the two groups are plotted on the right for comparison (each circle represents a single mouse). h, Cross-reactive binding of group 1 (H1 NC/99, H1 CA/09 and H5 VT/04) and group 2 (H3 VC/75, H7 NT/27 and H7 SH/13) HAs by week 12 antisera. Each circle represents a single mouse (n = 10 mice per group). i, Serum binding titers to group 1 and group 2 HAs in the presence of competing mAb—MEDI8852. Each circle represents a single mouse (n = 10 mice per group). Arrows indicate prime and boost immunizations in f,g. Dashed lines indicate the limit of quantification in fi. Data are presented as geometric mean ± s.d. of the log10‐transformed values (fi). Comparison of two groups was performed using the two-tailed Mann–Whitney U-test. P values of 0.05 or less were considered significant. Source data
Fig. 6
Fig. 6. Cross-reactive antibodies elicited by reoH2HA recognize group 2 HA-stem.
a, A three-dose immunization study with H2 HA or reoH2HA adjuvanted with a higher dose of CpG with alum in BLAB/c mice. b, Serum stem-specific IgG titers over time (n = 10 mice per group). Arrows indicate prime and boost immunizations in b. c, Cross-reactive binding of group 1 (H1 NC/99, H1 CA/09 and H5 VT/04) and group 2 (H3 VC/75, H7 NT/27 and H7 SH/13) HAs by week 7 antisera. Each circle represents a single mouse (n = 10 mice per group). Dashed lines indicate the limit of quantification in b,c. Data are presented as geometric mean ± s.d. of the log10‐transformed values (b,c). Comparison of two groups was performed using the two-tailed Mann–Whitney U-test. P values of 0.05 or less were considered significant. d,e, nsEMPEM analyses for week 12 (d) or week 7 (e) pooled antisera raised against H2 HA (top row) or reoH2HA (bottom row). Composite maps generated from negative-stain reconstructions of polyclonal immune complexes with H2 HA, H7 HA or H3 HA are shown for each group. Representative 2D class averages with the polyclonal Fab labeled are shown for immune complexes in low abundance, in which dotted lines highlight the likely position for the Fab population. Source data
Extended Data Fig. 1
Extended Data Fig. 1. OligoD insertion into Ebola GP.
a, Size-exclusion purification and gel electrophoresis of wild-type and oligoD-modified GP. Gel was stained with Coomassie brilliant blue. b, Size-exclusion chromatography coupled with multi-angle light scattering (SEC-MALS) analysis of GP and GP-12D on a Superdex 200 column. UV and LS indicate absorbance at 280 nm and light scattering signals, respectively. c, Thermal melting temperature (Tm) of wild-type and oligoD-modified GP. Data are presented as mean ± s.d. (n = 3 samples per group). d, Alum-binding assay for wild-type or oligoD-modified GP. GP proteins were pre-mixed with alum for 1 h at room temperature and then incubated in PBS containing naïve mouse serum for 24 h at 37 °C. Upon centrifugation, the concentrations of unbound GP in the supernatant were quantified by ELISA. The rinsed pellet was analyzed by Western blotting to detect alum‐bound GP. e, Standard curve established with known concentrations of GP for reference. Data are presented as mean ± s.d. (n = 3 samples per group). f, Concentrations of unbound GP in the supernatant of GP-alum mixtures. Data are presented as mean ± s.d. (n = 3 samples per group). g, Immunogold labeling of alum complexed with GP or GP-12D. Alum alone and alum incubated with naïve mouse serum served as controls. Arrows indicate alum pellets after staining. Scale bar, 1 cm. h, Representative transmission electron micrographs of antigen-alum complexes prepared from g. Scale bar, 100 nm. i, Thermal melting profiles (left) and Tm (right) of wild-type or oligoD-modified GP in the presence of alum. Data are presented as mean ± s.d. (n = 3 samples per group). j, Detection of Adju-Phos-bound GP by Western-blot analysis. Adju-Phos was used instead of Alhydrogel in the antigen-binding assay. Source data
Extended Data Fig. 2
Extended Data Fig. 2. OligoD insertion into flexible loop regions on GP and immunogenicity of oligoD-modified GP in vivo.
a, Screening of oligoD insertion into flexible loop regions on Ebola GP by Western-blot analysis. Insertions (2,4,8 or 12D) were made after residues R200, T294 or A309 as indicated. Supernatant from transient transfection was used for the analysis, and blots were detected by mAb114. b, Size-exclusion purification and gel electrophoresis of oligoD-modified GP after purification. Gel was stained with Coomassie brilliant blue. c, Thermal melting profiles and Tm of wild-type and oligoD-modified GP. Data are presented as mean ± s.d. in the dot plot (n = 3 samples per group). d, Quantification of the alum-bound fraction of oligoD-modified GP by ELISA (n = 3 samples per group). The dashed line indicates 100% binding to alum. e, Serum binding titers of GP or C-terminal tags (C-Tag-1 = ZsGreen-Avi-His-12D; C-Tag-2 = GFP-GCN4-His) by ELISA. The dashed line indicates the limit of quantification. Data are presented as the geometric mean ± s.d. of the log10‐transformed values (n = 6 mice per group). f, Validation of the neutralization assay against Ebola GP-pseudotyped lentiviruses (EBOVs) with the five GP-specific mAbs. c13C6 is known to be non-neutralizing and serves as a control. Data are presented as mean ± s.d. (n = 4 technical replicates). Source data
Extended Data Fig. 3
Extended Data Fig. 3. Analysis of germinal center responses.
a, Serum GP-specific IgG2a or IgG2b titers 7 d, 14 d or 21 d post-immunization (n = 10 mice per antigen per time point). Dashed lines indicate the limit of quantification. Data are presented as the geometric mean ± s.d. of the log10‐transformed values. b, Gating strategy for the analysis of germinal center B cells (CD19+CD95+CD38), IgG+ germinal center B cells and T follicular helper cells (CD3+CD4+PD1+CXCR5+) in the draining lymph nodes. c, Analysis of IgG+ GC B cell responses after immunization. Each circle represents a single mouse (n = 10). Data are presented as mean ± s.d. Comparison of two groups was performed using the two-tailed Mann–Whitney U-test. P values of 0.05 or less were considered significant. Source data
Extended Data Fig. 4
Extended Data Fig. 4. OligoD insertion into SARS-CoV-2 spike.
a, Size-exclusion purification and gel electrophoresis of wild-type or oligoD-modified spike. Gel was stained with Coomassie brilliant blue. b, SEC-MALS analysis of spike and spike-12D on a Superdex 200 column. UV and LS indicate absorbance at 280 nm and light scattering signals, respectively. c,d, Thermal melting profiles and Tm of wild-type and oligoD-modified spike in the absence (c) or presence (d) of alum (spike: alum = 1:10, w/w in d) (n = 3 samples per group). e, BLI binding profiles of wild-type or oligoD-modified spike with ACE2-Fc and three Spike-specific mAbs (COVA2-15, CB6 and CR3022). A GP-specific mAb (mAb114) served as a negative control. Vertical dashed lines indicate the beginning of dissociation. Source data
Extended Data Fig. 5
Extended Data Fig. 5. Neutralization of SARS-CoV-2 pseudoviruses.
a-c, Serum neutralization titers (NT50) of SARS-CoV-2 variants of concern over time, including B.1.351 (a), B.1.617.2 (b) and B.1.617.2/AY1 (c) (n = 10 mice per group). Data are presented as the geometric mean ± s.d. of the log10‐transformed values in NT50. Dashed lines indicate the limit of quantification of NT50. Comparison of NT50 over time was performed using two-way ANOVA followed by a Bonferroni test. Comparison of two groups was performed using the two-tailed Mann–Whitney U-test. P values of 0.05 or less were considered significant. d,e, Serum neutralization profiles of Omicron variants B.1.1.529.1 (d) and B.1.1.529.2 (e). Each curve is derived from a single mouse (n = 10). Data are presented as mean ± s.d. of technical duplicates in neutralization curves. Source data
Extended Data Fig. 6
Extended Data Fig. 6. OligoD insertion into H1 HA.
a, Size-exclusion purification and gel electrophoresis of wild-type or oligoD-modified H1 HA. Gel was stained with Coomassie brilliant blue. b, SEC-MALS analysis of H1 HA and H1 HA-12D on a Superdex 200 column. UV and LS indicate absorbance at 280 nm and light scattering signals, respectively. c, Thermal melting profiles and Tm of wild-type and oligoD-modified H1 HA. Data are presented as mean ± s.d. (n = 3 samples per group). d, Serum binding titers to different group 1 HAs (H1 CA/09 – A/California/07/2009, H2 JP/57 – A/Japan/305/1957, H5 VT/04 – A/Vietnam/1203/2004) (n = 10 mice per group). Each circle represents a single mouse (n = 10 mice per group). Dashed lines indicate the limit of quantification. Data are presented as the geometric mean ± s.d. of the log10-transformed values. Comparison of two groups was performed using the two-tailed Mann–Whitney U-test. P values of 0.05 or less were considered significant. Source data
Extended Data Fig. 7
Extended Data Fig. 7. OligoD insertion into HA-head of H2 HA.
a, Location of the oligoD insertion site (S156) on the head of H2 HA. b, Size-exclusion purification and gel electrophoresis of H2 HA and reoH2HA. Gels were stained with Coomassie brilliant blue. c, SEC-MALS analysis of H2 HA and reoH2HA on a Superdex 200 column. UV and LS indicate absorbance at 280 nm and light scattering signals, respectively. d, Thermal melting profiles and Tm of H2 HA and reoH2HA. Data are presented as mean ± s.d. in the dot plots (n = 3 samples per group). e, Epitopes targeted by head-directed (8F8 and 8M2) and stem-directed mAbs (MEDI8852 and FI6v3) on H2 HA. Red spheres indicated oligoD insertion sites (S156). f, Binding of head-directed (8F8 and 8M2) or stem-directed mAbs (MEDI8852 and FI6v3) to H2 HA or H2 HA-12D (H2 HA with 12D inserted at its C-terminus) on streptavidin-coated (left) or alum-coated (right) ELISA plates. Data are presented as mean ± s.d. (n = 4 technical replicates). g, Immunogold labeling (left, scale bar, 1 cm) and TEM imaging (right, scale bar, 100 nm) of alum complexed with H2 HA or reoH2HA. Source data
Extended Data Fig. 8
Extended Data Fig. 8. Immunization of oligoD-modified HA.
a, A prime-boost immunization study with H7 HA-12D adjuvanted with alum alone or alum/CpG via subcutaneous injection in BALB/c mice (n = 5 mice per group). b, Serum H7 HA-specific IgG titers over time. Antibody titers of weeks 3 and 7 from the two groups are plotted on the right for comparison. c, Cross-reactive binding of different group 1 (H1 NC/99, H1 CA/09, H2 JP/57, H5 VT/04) and group 2 HAs (H3 VC/75, H7 NT/27, H7 SH/13) by week-7 antisera (n = 10 mice per group from the immunization study in Fig. 5e). d, Serum H2 HA-specific IgG titers over time (n = 10 mice per group from the immunization study in Fig. 6a). e, Cross-reactive binding of different group 1 (H1 NC/99, H1 CA/09, H2 JP/57, H5 VT/04) and group 2 HAs (H3 VC/75, H7 NT/27, H7 SH/13) by week-12 antisera (n = 10 mice per group from the immunization study in Fig. 6a). f,g, IgG subtypes of week-12 sera raised from low- (f) or high-dose (g) CpG coupled with alum. Dashed lines indicate the limit of quantification in b-g. IgG titers are presented as the geometric mean of the log10-transformed values in b-g. Comparison of two groups was performed using the two-tailed Mann–Whitney U-test in b,c,e. P values of 0.05 or less were considered significant. Source data
Extended Data Fig. 9
Extended Data Fig. 9. Polyclonal epitope mapping with negative-stain electron microscopy (nsEMPEM).
a-f, 3D negative-stain reconstructions with representative 2D class averages of polyclonal immune complexes with H2 HA (a,b), H7 HA (c,d) or H3 HA (e,f). Immune complexes generated with antisera against H2 HA or reoH2HA were shown in a,d,f or b,c,e, respectively.
Extended Data Fig. 10
Extended Data Fig. 10. Cross-neutralization of a heterosubtypic H1N1 virus.
a, Validation of the IAV microneutralization assay with three stem-directed bnAbs (MEDI8852, CR9114 and FI6v3) against authentic A/California/7/2009 (H1N1 A/CA/7/09) viruses. A GP-specific mAb (mAb114) served as a negative control. Data are presented as mean ± s.d. (n = 4 technical replicates). b, Neutralization of H1N1 A/CA/7/09 viruses by IgG purified from pooled antisera against H2 HA or reoH2HA. IgG purified from pre-immune sera served as a control. Week-12 antisera raised from Fig. 6a were used for analysis. Data are presented as mean ± s.d. (n = 4 technical replicates). Source data

Similar articles

Cited by

References

    1. Cox, N. J. & Subbarao, K. Global epidemiology of influenza: past and present. Annu. Rev. Med.51, 407–421 (2000). - PubMed
    1. Taubenberger, J. K., Kash, J. C. & Morens, D. M. The 1918 influenza pandemic: 100 years of questions answered and unanswered. Sci. Transl. Med.11, eaau5485 (2019). - PMC - PubMed
    1. DeGrace, M. M. et al. Defining the risk of SARS-CoV-2 variants on immune protection. Nature605, 640–652 (2022). - PMC - PubMed
    1. Kirkpatrick, E., Qiu, X., Wilson, P. C., Bahl, J. & Krammer, F. The influenza virus hemagglutinin head evolves faster than the stalk domain. Sci. Rep.8, 10432 (2018). - PMC - PubMed
    1. Krammer, F. et al. Influenza. Nat. Rev. Dis. Prim.4, 3 (2018). - PMC - PubMed

Publication types

MeSH terms