

Different vulnerability of fast and slow cortical oscillations to suppressive effect of spreading depolarization: state-dependent features potentially relevant to pathogenesis of migraine aura
- PMID: 38225575
- PMCID: PMC10789028
- DOI: 10.1186/s10194-023-01706-x
Different vulnerability of fast and slow cortical oscillations to suppressive effect of spreading depolarization: state-dependent features potentially relevant to pathogenesis of migraine aura
Abstract
Background: Spreading depolarization (SD), underlying mechanism of migraine aura and potential activator of pain pathways, is known to elicit transient local silencing cortical activity. Sweeping across the cortex, the electrocorticographic depression is supposed to underlie spreading negative symptoms of migraine aura. Main information about the suppressive effect of SD on cortical oscillations was obtained in anesthetized animals while ictal recordings in conscious patients failed to detect EEG depression during migraine aura. Here, we investigate the suppressive effect of SD on spontaneous cortical activity in awake animals and examine whether the anesthesia modifies the SD effect.
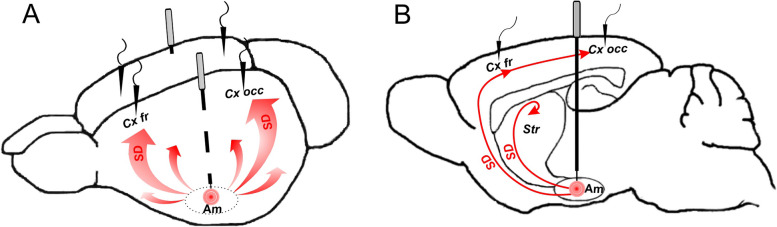
Methods: Spectral and spatiotemporal characteristics of spontaneous cortical activity following a single unilateral SD elicited by amygdala pinprick were analyzed in awake freely behaving rats and after induction of urethane anesthesia.
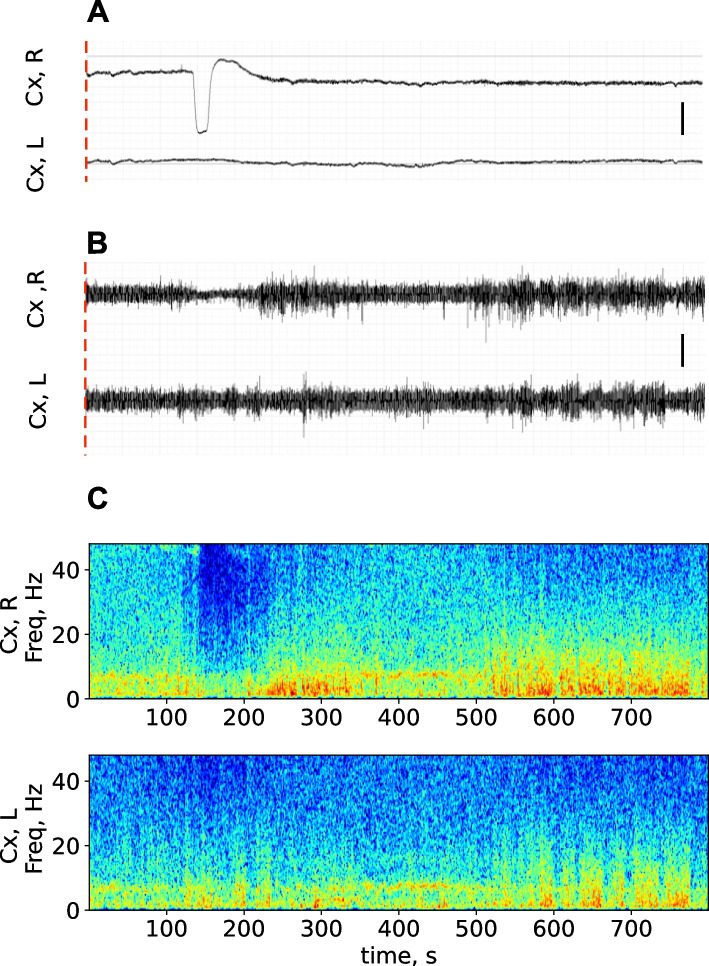
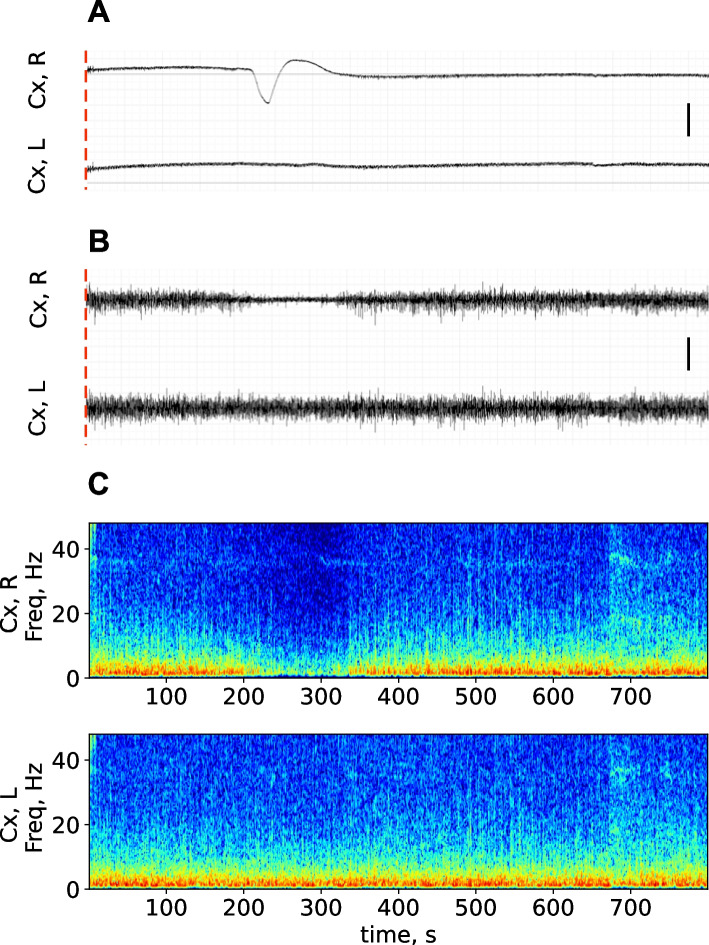
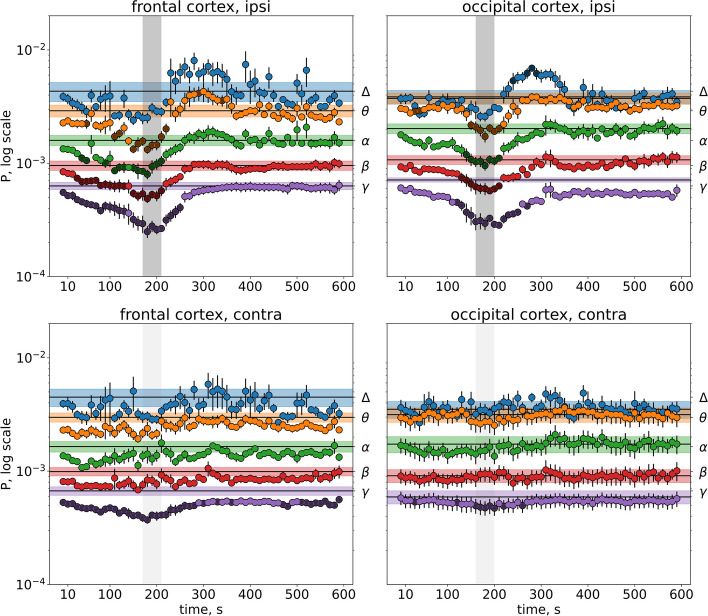
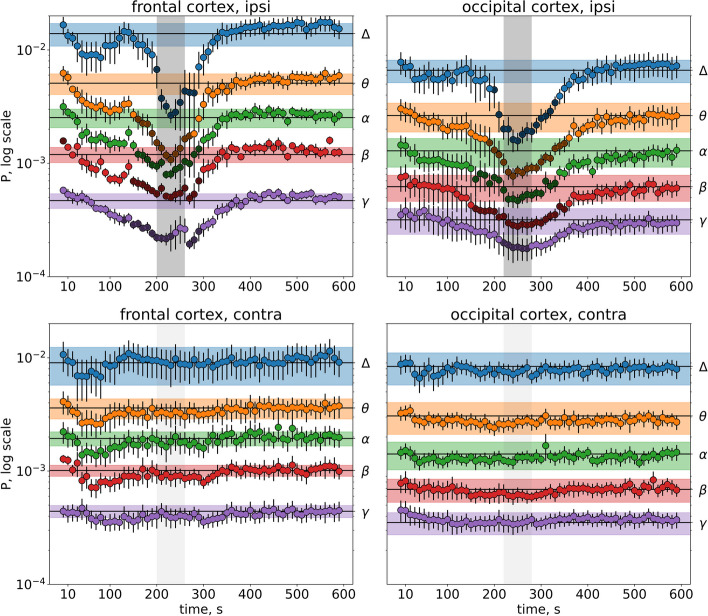
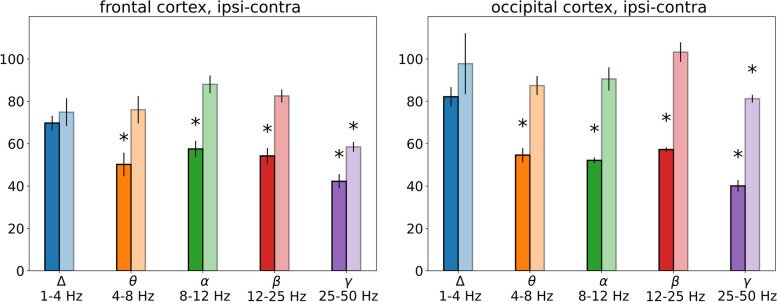
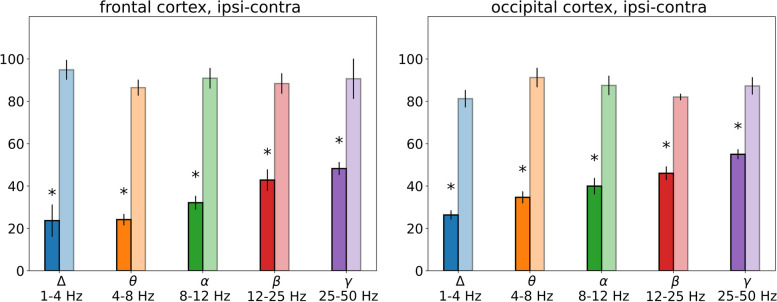
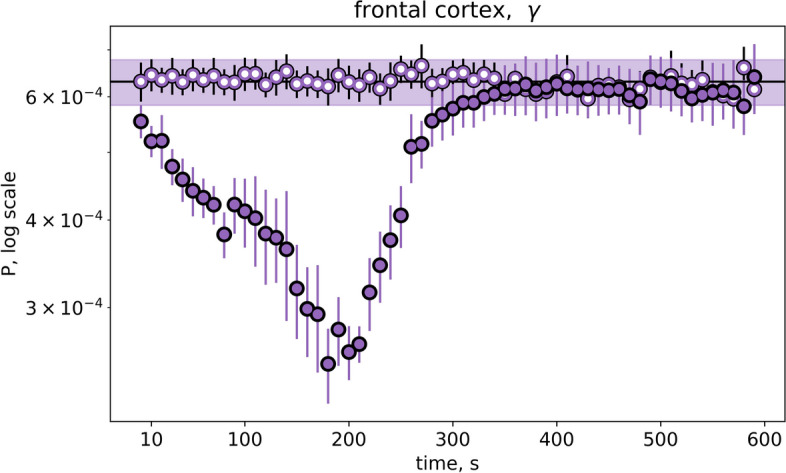
Results: In wakefulness, SD transiently suppressed cortical oscillations in all frequency bands except delta. Slow delta activity did not decline its power during SD and even increased it afterwards; high-frequency gamma oscillations showed the strongest and longest depression under awake conditions. Unexpectedly, gamma power reduced not only during SD invasion the recording cortical sites but also when SD occupied distant subcortical/cortical areas. Contralateral cortex not invaded by SD also showed transient depression of gamma activity in awake animals. Introduction of general anesthesia modified the pattern of SD-induced depression: SD evoked the strongest cessation of slow delta activity, milder suppression of fast oscillations and no distant changes in gamma activity.
Conclusion: Slow and fast cortical oscillations differ in their vulnerability to SD influence, especially in wakefulness. In the conscious brain, SD produces stronger and spatially broader depression of fast cortical oscillations than slow ones. The frequency-specific effects of SD on cortical activity of awake brain may underlie some previously unexplained clinical features of migraine aura.
Keywords: Animal models; Aura; Cortical spreading depression; Migraine; Spreading depolarization.
© 2024. The Author(s).
Conflict of interest statement
The authors declare no competing interests.
Figures
Similar articles
-
Transient loss of interhemispheric functional connectivity following unilateral cortical spreading depression in awake rats.Cephalalgia. 2021 Mar;41(3):353-365. doi: 10.1177/0333102420970172. Epub 2020 Nov 8. Cephalalgia. 2021. PMID: 33164563
-
Comparative potency of sensory-induced brainstem activation to trigger spreading depression and seizures in the cortex of awake rats: Implications for the pathophysiology of migraine aura.Cephalalgia. 2015 Oct;35(11):979-86. doi: 10.1177/0333102414565672. Epub 2014 Dec 16. Cephalalgia. 2015. PMID: 25516507
-
Signatures of migraine aura in high-density-EEG.Clin Neurophysiol. 2024 Apr;160:113-120. doi: 10.1016/j.clinph.2024.01.008. Epub 2024 Feb 18. Clin Neurophysiol. 2024. PMID: 38422969
-
Initiation of spreading depression by synaptic and network hyperactivity: Insights into trigger mechanisms of migraine aura.Cephalalgia. 2018 May;38(6):1177-1187. doi: 10.1177/0333102417724151. Epub 2017 Jul 27. Cephalalgia. 2018. PMID: 28750590 Review.
-
Aura and Stroke: relationship and what we have learnt from preclinical models.J Headache Pain. 2019 May 29;20(1):63. doi: 10.1186/s10194-019-1016-x. J Headache Pain. 2019. PMID: 31142262 Free PMC article. Review.
Cited by
-
Transient destabilization of interhemispheric functional connectivity induced by spreading depolarization.Netw Neurosci. 2024 Dec 10;8(4):1383-1399. doi: 10.1162/netn_a_00405. eCollection 2024. Netw Neurosci. 2024. PMID: 39735499 Free PMC article.
-
Inflammatory response of leptomeninges to a single cortical spreading depolarization.J Headache Pain. 2024 Jul 16;25(1):113. doi: 10.1186/s10194-024-01823-1. J Headache Pain. 2024. PMID: 39009958 Free PMC article.
References
-
- Charles A. The migraine aura. CONTINUUM: Lifelong Learn Neurol. 2018;24(4):1009–22. - PubMed
MeSH terms
Grants and funding
LinkOut - more resources
Full Text Sources
Medical
Miscellaneous
