. 2024 Jan 15;24(1):39.
doi: 10.1186/s12906-023-04318-9.

Comparison of the protective effects of CS/TPP and CS/HPMCP nanoparticles containing berberine in ethanol-induced hepatotoxicity in rat

Affiliations

Comparison of the protective effects of CS/TPP and CS/HPMCP nanoparticles containing berberine in ethanol-induced hepatotoxicity in rat

Maral Mahboubi Kancha et al. BMC Complement Med Ther. .

Abstract

Background: Alcoholic liver disease (ALD) is a globally critical condition with no available efficient treatments.

Methods: Herein, we generated chitosan (CS) nanoparticles cross-linked with two different agents, hydroxypropyl methylcellulose phthalate (HPMCP; termed as CS/HPMCP) and tripolyphosphate (TPP; termed as CS/TPP), and loaded them with berberine (BBr; referred to as CS/HPMCP/BBr and CS/TPP/BBr, respectively). Alongside the encapsulation efficiency (EE) and loading capacity (LC), the releasing activity of the nanoparticles was also measured in stimulated gastric fluid (SGF) and stimulated intestinal fluid (SIF) conditions. The effects of the prepared nanoparticles on the viability of mesenchymal stem cells (MSCs) were also evaluated. Ultimately, the protective effects of the nanoparticles were investigated in ALD mouse models.

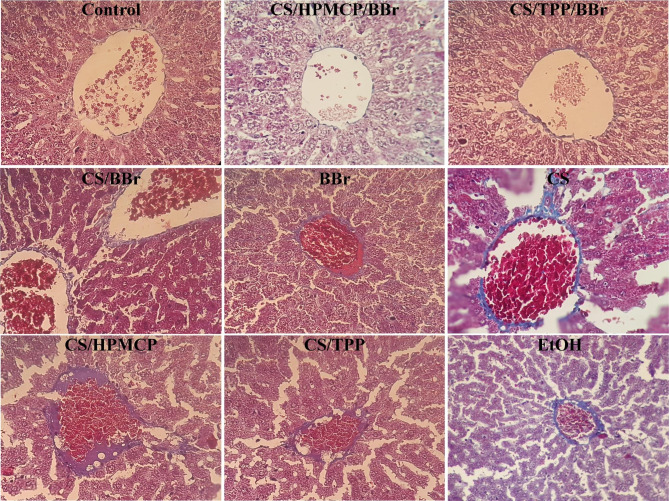
Results: SEM images demonstrated that CS/HPMCP and CS/TPP nanoparticles had an average size of 235.5 ± 42 and 172 ± 21 nm, respectively. The LC and EE for CS/HPMCP/BBr were calculated as 79.78% and 75.79%, respectively; while the LC and EE for CS/TPP/BBr were 84.26% and 80.05%, respectively. pH was a determining factor for releasing BBr from CS/HPMCP nanoparticles as a higher cargo-releasing rate was observed in a less acidic environment. Both the BBr-loaded nanoparticles increased the viability of MSCs in comparison with their BBr-free counterparts. In vivo results demonstrated CS/HPMCP/BBr and CS/TPP/BBr nanoparticles protected enzymatic liver functionality against ethanol-induced damage. They also prevented histopathological ethanol-induced damage.

Conclusions: Crosslinking CS nanoparticles with HPMCP can mediate controlled drug release in the intestine improving the bioavailability of BBr.

Keywords: Berberine; Chitosan; HPMCP; Hepatotoxicity; Nanoparticle; TPP.


Conflict of interest statement

The authors declare no competing interests.

Figures

Fig. 1
Fig. 1
The chemical structures of CS, HPMCP, TPP, and BBr used in the preparation of nanoparticles that were investigated in this study. a: CS. b: HPMCP. c: TPP. d: BBr.
Fig. 2
Fig. 2
SEM images of CS/HPMCP/BB and CS/TPP/BBr nanoparticles demonstrate the morphology and the average size of the prepared nanoparticles. a: CS/HPMCP/BBr nanoparticles. b: CS/TPP/BBr nanoparticles
Fig. 3
Fig. 3
FTIR spectra of the materials used in the preparation of investigated CS/HPMCP/BB and CS/TPP/BBr nanoparticles. a: spectra of CS, HPMCP, BBr, as well as CS/HPMCP and CS/HPMCP/BBr nanoparticles. b: spectra of CS, TPP, BBr, as well as CS/TPP and CS/TPP/BBr nanoparticles
Fig. 4
Fig. 4
The release graph and cell viability assay results of CS/HPMCP/BBr and CS/TPP/BBr nanoparticles. a: the release percentage of BBr from CS/HPMCP/BBr (left panel) and CS/TPP/BBr (right panel) nanoparticles over the course of 8 h in the SGF (pH = 1.2) and SIF (pH = 7.4) environments. BBr release percentage of CS/HPMCP/BBr and CS/TPP/BBr nanoparticles was significantly higher in SIF settings than those of CS/HPMCP/BBr and CS/TPP/BBr in SGF settings, respectively at all of the investigated time intervals except for the first 15 min (p < 0.0001). All experiments were carried out in triplicate (n = 3). b: the effects of the exposure of CS/HPMCP/BBr and CS/HPMCP nanoparticles on the viability of MSCs after 24 h (left panel) and 72 h (right panel). After 24 h, CS/HPMCP/BBr nanoparticle exposure resulted in significantly higher cell viability rates in comparison with CS/HPMCP at 0.0625, 0.125, 0.25, 0.5, 1 mg/mL concentrations (p < 0.0001 for all of the significant groups). After 72 h, CS/HPMCP/BBr nanoparticle exposure resulted in significantly higher cell viability rates in comparison with CS/HPMCP at all of the investigated concentrations (p < 0.0001 for all of the significant groups). c: the effects of the exposure of CS/TPP/BBr and CS/TPP nanoparticles on the viability of MSCs after 24 h (left panel) and 72 h (right panel). After 24 h, CS/TPP/BBr nanoparticle exposure resulted in significantly higher cell viability rates in comparison with CS/TPP at 0.0625, 0.125, 0.25, 0.5, and 1 mg/mL concentrations (p < 0.0001 for all of the significant groups). After 72 h, CS/TPP/BBr nanoparticle exposure resulted in significantly higher cell viability rates in comparison with CS/TPP at all of the investigated concentrations (p < 0.0001 for 0.015625 mg/mL concentration group and p < 0.0001 for the other groups). “ns” for statistically non-significant, *** for p < 0.001, and **** for p < 0.0001. All experiments were carried out in triplicate (n = 3)
Fig. 5
Fig. 5
The plasma level of AST, ALT, ALP, GGT, GPx, and MDA in rat models of alcohol-induced liver damage in different experimental groups. a: the plasma level of AST. b: the plasma level of ALT. c: the plasma level of ALP. d: the plasma level of GGT. e: the plasma level of GPx. f: the plasma level of MDA. Experimental groups are statistically compared with the control group. “ns” indicates statistically non-significant, * for p < 0.05, ** for p < 0.01, *** for p < 0.001, and **** for p < 0.0001. Data are presented as means ± SD (n = 3)
Fig. 6
Fig. 6
H&E staining of the liver of alcohol-induced liver damage rat models. The magnification of the images is ×40
Fig. 7
Fig. 7
Masson’s trichrome staining of the liver of alcohol-induced liver damage rat models. The magnification of the images is ×40

Similar articles

Cited by

References

    1. Yoon YH, Chen CM, Slater ME, Jung MK, White AM. Trends in premature deaths from alcoholic Liver Disease in the U.S., 1999–2018. Am J Prev Med. 2020;59(4):469–80. doi: 10.1016/j.amepre.2020.04.024. - DOI - PMC - PubMed
    1. O’Shea RS, Dasarathy S, McCullough AJ. Alcoholic Liver Disease. Hepatology. 2010;51(1):307–28. doi: 10.1002/hep.23258. - DOI - PubMed
    1. Tan HK, Yates E, Lilly K, Dhanda AD. Oxidative stress in alcohol-related Liver Disease. World J Hepatol. 2020;12(7):332–49. doi: 10.4254/wjh.v12.i7.332. - DOI - PMC - PubMed
    1. Torruellas C, French SW, Medici V. Diagnosis of alcoholic Liver Disease. World J Gastroenterol. 2014;20(33):11684–99. doi: 10.3748/wjg.v20.i33.11684. - DOI - PMC - PubMed
    1. Goldberg D, Ditah IC, Saeian K, Lalehzari M, Aronsohn A, Gorospe EC, et al. Changes in the prevalence of Hepatitis C virus Infection, nonalcoholic steatohepatitis, and alcoholic Liver Disease among patients with Cirrhosis or Liver Failure on the Waitlist for Liver Transplantation. Gastroenterology. 2017;152(5):1090–9e1. doi: 10.1053/j.gastro.2017.01.003. - DOI - PMC - PubMed