. 2024 Jan 30;96(4):1478-1487.
doi: 10.1021/acs.analchem.3c03759. Epub 2024 Jan 16.

Isotopic Depletion Increases the Spatial Resolution of FPOP Top-Down Mass Spectrometry Analysis

Affiliations

Isotopic Depletion Increases the Spatial Resolution of FPOP Top-Down Mass Spectrometry Analysis

Marek Polák et al. Anal Chem. .

Abstract

Protein radical labeling, like fast photochemical oxidation of proteins (FPOP), coupled to a top-down mass spectrometry (MS) analysis offers an alternative analytical method for probing protein structure or protein interaction with other biomolecules, for instance, proteins and DNA. However, with the increasing mass of studied analytes, the MS/MS spectra become complex and exhibit a low signal-to-noise ratio. Nevertheless, these difficulties may be overcome by protein isotope depletion. Thus, we aimed to use protein isotope depletion to analyze FPOP-oxidized samples by top-down MS analysis. For this purpose, we prepared isotopically natural (IN) and depleted (ID) forms of the FOXO4 DNA binding domain (FOXO4-DBD) and studied the protein-DNA interaction interface with double-stranded DNA, the insulin response element (IRE), after exposing the complex to hydroxyl radicals. As shown by comparing tandem mass spectra of natural and depleted proteins, the ID form increased the signal-to-noise ratio of useful fragment ions, thereby enhancing the sequence coverage by more than 19%. This improvement in the detection of fragment ions enabled us to detect 22 more oxidized residues in the ID samples than in the IN sample. Moreover, less common modifications were detected in the ID sample, including the formation of ketones and lysine carbonylation. Given the higher quality of ID top-down MSMS data set, these results provide more detailed information on the complex formation between transcription factors and DNA-response elements. Therefore, our study highlights the benefits of isotopic depletion for quantitative top-down proteomics. Data are available via ProteomeXchange with the identifier PXD044447.


Conflict of interest statement

The authors declare no competing financial interest.

Figures

Figure 1
Figure 1
Zoomed mass spectrum on a +14-charge state (m/z 842–851) showing an isotopic distribution of isotopically natural (IN-, A) and isotopically depleted (ID-, D) FOXO4-DBD. Fast photochemical oxidation of IN-FOXO4 without (B) and with (C) dsIRE. Fast photochemical oxidation of ID-FOXO4 without (E) and with (F) dsIRE.
Figure 2
Figure 2
Histograms displaying the number of quantified fragment ions generated by ECD fragmentation of singly oxidized precursor ions of IN-FOXO4-DBD and ID-FOXO4-DBD.
Figure 3
Figure 3
Zoomed ECD spectrum obtained upon fragmentation of isotopically natural (A) and isotopically depleted (B) FOXO4-DBD. The [c21]2+ is indicated with blue asterisks; the low-abundance [c57]6+ fragment ion is denoted by green squares; and its oxidized form, [c57+O]6+, is indicated by pink dots. The oxidized fragment ion [z38+O]4 is denoted by magenta triangles.
Figure 4
Figure 4
MS/MS spectrum zoomed in the m/z range 1008–1012.300. The control ECD spectrum of unmodified ID-FOXO4-DBD is colored in black in the top panel (A). The ECD spectrum of oxidized ID-FOXO4-DBD with (B) and without IRE (C) is colored in blue and in red. The isotopic distribution of both [c73]8+ and [c73+O]8+fragment ions is denoted by transparent asterisks. Yellow dots denote lysine carbonylation within the protein, represented by the loss of 1.013 Da, while the green dots represent the oxidation of protein to its keto form (+13.9793). An ECD MS/MS spectrum of IN-FOXO4-DBD without IRE (D) and with IRE (E) shows no visible lysine carbonylation or oxidation to keto form.
Figure 5
Figure 5
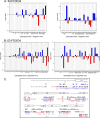
Plots indicating changes in oxidation rates between apo and holo forms of isotopically natural FOXO4 (A) and isotopically depleted FOXO4 (B); assessed by ECD fragmentation in multiCASI mode (Figure S5, Figure S8). Blue histograms represent changes in which region/residue was protected by IRE, and red histograms represent changes which resulted in deprotection of region/residue by IRE. (C) Changes obtained in ID-FOXO4-DBD were visualized into the differential oxidation map of FOXO4-DBD. The bold sequence represents spatial resolution achieved by fragmentation of isotopically depleted FOXO4-DBD. Colored residues were also detected by bottom-up analysis, as shown in Figure S11B and Table S1.
Figure 6
Figure 6
An in silico structural model of FOXO4-DBD·IRE (PDB template 3L2C) with the highlighted differently oxidized regions/residues detected by both top-down analyses for natural version (A) or depleted version (B) of FOXO4-DBD. The individual residues detected in either bottom-up approach or deduced from top-down were highlighted in the model and colored. Blue: regions/residues detected as more modified in apo form; red: regions/residues detected as more modified in holo form.

References

    1. Polák M.; Yassaghi G.; Kavan D.; Filandr F.; Fiala J.; Kukačka Z.; Halada P.; Loginov D. S.; Novák P. Utilization of Fast Photochemical Oxidation of Proteins and Both Bottom-up and Top-down Mass Spectrometry for Structural Characterization of a Transcription Factor–DsDNA Complex. Anal. Chem. 2022, 94 (7), 3203–3210. 10.1021/acs.analchem.1c04746. - DOI - PubMed
    1. Obsil T.; Obsilova V. Structural Basis for DNA Recognition by FOXO Proteins. Biochim. Biophys. Acta - Mol. Cell Res. 2011, 1813 (11), 1946–1953. 10.1016/j.bbamcr.2010.11.025. - DOI - PubMed
    1. Vacha P.; Zuskova I.; Bumba L.; Herman P.; Vecer J.; Obsilova V.; Obsil T. Detailed Kinetic Analysis of the Interaction between the FOXO4–DNA-Binding Domain and DNA. Biophys. Chem. 2013, 184, 68–78. 10.1016/j.bpc.2013.09.002. - DOI - PubMed
    1. Pandey P.; Hasnain S.; Ahmad S.. Protein-DNA Interactions. In Encyclopedia of Bioinformatics and Computational Biology; Elsevier, 2019; pp 142–154. 10.1016/B978-0-12-809633-8.20217-3. - DOI
    1. Lambert S. A.; Jolma A.; Campitelli L. F.; Das P. K.; Yin Y.; Albu M.; Chen X.; Taipale J.; Hughes T. R.; Weirauch M. T. The Human Transcription Factors. Cell 2018, 172 (4), 650–665. 10.1016/j.cell.2018.01.029. - DOI - PubMed

Publication types