Review
. 2024 Sep 3;147(9):2913-2933.
doi: 10.1093/brain/awae013.

Imaging chronic active lesions in multiple sclerosis: a consensus statement

Affiliations
Review

Imaging chronic active lesions in multiple sclerosis: a consensus statement

Francesca Bagnato et al. Brain. .

Abstract

Chronic active lesions (CAL) are an important manifestation of chronic inflammation in multiple sclerosis and have implications for non-relapsing biological progression. In recent years, the discovery of innovative MRI and PET-derived biomarkers has made it possible to detect CAL, and to some extent quantify them, in the brain of persons with multiple sclerosis, in vivo. Paramagnetic rim lesions on susceptibility-sensitive MRI sequences, MRI-defined slowly expanding lesions on T1-weighted and T2-weighted scans, and 18-kDa translocator protein-positive lesions on PET are promising candidate biomarkers of CAL. While partially overlapping, these biomarkers do not have equivalent sensitivity and specificity to histopathological CAL. Standardization in the use of available imaging measures for CAL identification, quantification and monitoring is lacking. To fast-forward clinical translation of CAL, the North American Imaging in Multiple Sclerosis Cooperative developed a consensus statement, which provides guidance for the radiological definition and measurement of CAL. The proposed manuscript presents this consensus statement, summarizes the multistep process leading to it, and identifies the remaining major gaps in knowledge.

Keywords: MRI-defined slowly evolving lesions; chronic active lesions; iron; microglia; multiple sclerosis; paramagnetic rim lesions.


Conflict of interest statement

M.A. received consultancy income from Sanofi, Biogen, Abata Therapeutics and Glaxo Smith Klein. C.J.A. has received consulting income from Horizon Therapeutics, Genentech, Sanofi Genzyme, Alexion, EMD Serono, and Novartis; compensation for scientific reviewing from the Department of Defense; and honoraria related to creating educational content for Projects in Knowledge, Catamount Education, and Spire Learning. F.B. received consultancy income from Sanofi-Genzyme; Biogen, Janssen Pharmaceuticals and EMD Serono and receives compensation for scientific reviewing from the National Institutes of Health. P.A.C. received consulting honoraria for serving on SABs for Nervgen, Idorsia, Biogen, Vaccitech, and Lilly. C.E. is an employee of NeuroRx Research and received speaking honoraria from EMD Serono; S.A.G. has received consultancy income from Genentech. D.M.H. received consulting income from EMD Serono and Horizon Therapeutics, writing fees from the American College of Physicians, and royalties from Up To Date, Inc. C.C.H. receives consultancy income from VIVIO Health. J.O. has received research funding from Biogen-Idec, Roche, and EMD-Serono and has received consultancy income from Biogen-Idec, Roche, Sanofi-Genzyme, Novartis, and BMS. D.O. receives research funding from BMS, Genentech, Genzyme, and Novartis; and consulting fees from Biogen Idec, BMS, Genentech/Roche, Genzyme, Janssen, Novartis, Merck, and Pipeline Thrapeutics. D.S.R. has received research funding from Abata Therapeutics and Sanofi-Genzyme. W.D.R. received research funding from Revalesio, Inc, and is a consultant with Ultragenyx. R.T.S. received consulting income from Octave Bioscience and has received compensation for scientific reviewing from the American Medical Association, the Department of Defense, the Emerson Collective, and the National Institutes of Health. B.T. receives speaking fees from Sanofi-Genzyme, advisory board fees from Disarm Therapeutics, Therini Bio. Inc. and Sanofi-Genzyme.

Figures

Figure 1
Figure 1
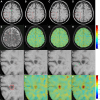
Paramagnetic rim lesion (PRL) visibility. (A) Axial and coronal slice of a PRL visible on a 7 T T2*-weighted (T2*-w) single gradient echo MRI, magnitude and unwrapped filtered phase images with echo time = 32 ms, repetition time = 1300 ms, in-plane voxel size = 0.2 × 0.2 mm, slice thickness = 1 mm and scan time ∼8 min. The hypointense rim signal (rectangles on the axial views, arrows on the coronal view) surrounds the hyperintense lesion core. Image contributed by Dr Martina Absinta, Dr Pascal Sati and Dr Daniel Reich. (B) Axial slices of a 7 T T2*-weighted multi-echo GRE (ME-GRE) with flow compensation, magnitude images, echo time (TE) TE1/TE2/TE3/TE4/TE5 = 5/10/15/20/25 ms, repetition time = 28 ms, in-plane voxel size = 0.65 × 0.65 mm, slice thickness = 0.7 mm, scan time ∼ 8 min. It is important to highlight how PRL visibility (rectangles and arrows in the insets) increases with longer echo time. (C) Axial, sagittal and coronal views of a different PRL visible on quantitative susceptibility mapping (QSM) derived from the same sequence (rectangles). Here the hyperintense signal surrounds the lesion core, which is slightly hyperintense. Image contributed by Dr Seongjin Choi and Dr Daniel Harrison. (D) 3D susceptibility weighted imaging (SWI) and unwrapped filtered phase next to a T2-weighted fluid attenuated inversion recovery (FLAIR) image at 7 T. 3D SWI pulse sequence parameters include echo time = 15 ms, repetition time = 50 ms, in-plane voxel size = 0.4 × 0.4 mm, slice thickness = 2 mm, scan time ∼ 10 min. A few PRLs show that the hypointense rim surrounds the lesion core (compare with the FLAIR image) (arrows). An advantage of using SWI stems from its complementary ability to identify veins, allowing to: (i) distinguish PRL from curvilinear veins potentially mimicking a rim; and (ii) identify the central vein sign when needed. Shown in the inset is a PRL (arrow) transverse by a central vein (arrow). Image contributed by Habeeb F. Kazimuddin, Jiacheng Wang and Dr Francesca Bagnato. (E) The panel shows 3 T custom T2*-weighted segmented 3D echo planar imaging (3D T2*-EPI) magnitude and unwrapped filtered phase images juxtaposed to vendor-provided multi-echo 2D SWI and unwrapped filtered phase images of the same lesion. Pulse sequence parameters include echo time = 27 ms, repetition time = 51 ms, isotropic voxel size = 0.55 mm, and scan time ∼ 5 min for the 3D T2*-EPI, and TE1/TE2/TE3/TE4 = 7.2/13.4/19.6/25.8 ms, repetition time = 31 ms, voxel size = 0.45 × 0.45 mm, thickness = 2 mm and scan time ∼ 3 min for the 2D SWI. The isotropic voxel size and the T2-weighting of the 3D T2*-EPI allows better visualization of the PRL on the three orthogonal planes (shown in the inset). Image contributed by Dr Martina Absinta. (F) Multi-echo gradient echo plural contrast imaging (GEPCI) allows for reconstructing R2*, unwrapped filtered phase and QSM at 3 T. Axial images are presented. The rim of the PRL has hyperintense signal on R2* and QSM and hypointense signal on the unwrapped phase. Pulse sequence parameters here include 10 echo times, with the first = 4 ms and echo spacing of 4 ms, repetition time = 40 ms, in-plane voxel size = 1 × 1 mm, slice thickness = 2 mm, scan time = 12 min. Image contributed by Dr Biao Xiang, Dr Dimitriy Yablonskiy and Dr Anne Cross.
Figure 2
Figure 2
MRI-defined slowly expanding lesions (SELs). (A) Axial slice of T1-weighted MRI at baseline; (B) 6 months; (C) 12 months; (D) and 24 months; and (E) T2-lesion mask of baseline scan. (F) Jacobian determinant maps at 6 months, (G) 12 months and (H) 24 months, all with respect to baseline, where values >0 (red) indicate expansion and values <0 (blue) indicate shrinkage. A region of interest corresponding to red box in AD, at baseline (I), 6 months (J), 12 months (K) and 24 months (L). In M the lesion area, identified as SEL, is contoured. Jacobian determinant maps in region of interest at 6 months (N), 12 months (O), 24 months (P), all with respect to baseline, showing the gradual expansion over time. Image contributed by Dr Colm Elliott.
Figure 3
Figure 3
Increased uptake of 18-kDa translocator protein (TSPO) on PK11195 PET in a paramagnetic rim lesion. (A) Hyperintense lesion on T2-weighted FLAIR image identified within the rectangle in a person with relapsing-remitting multiple sclerosis. The lesion is a paramagnetic rim lesion (PRL), as seen on the unwrapped filtered phase image (B, inset) and quantitative susceptibility map (C, inset). It has corresponding high TSPO uptake on PK11195-PET (D, inset). Image contributed by Dr Ulrike Kaunzner, Dr Thanh Nguyen and Dr Yeona Kang. FLAIR = fluid attenuated inversion recovery.
Figure 4
Figure 4
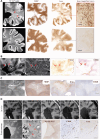
Histopathological validation of paramagnetic rim lesions using different acquisition and postprocessing MRI methods. (A) A paramagnetic rim lesion (PRL) is seen on a multi-echo gradient echo (ME-GRE) T2* image at 7 T. The paramagnetic rim (arrow) partially surrounds a demyelinated lesion core [absence of myelin basic protein (MBP) stain] and co-localizes with peripheral intracellular iron (low and high magnification views). The lesion in the second row is not a PRL and has no iron rim. Similar findings are presented in B and C, where PRL are shown on ME-GRE R2* and phase image at 7 T and quantitative susceptibility imaging (QSM) at 3 T. In BD, iron co-localizes with CD68+ activated macrophages/microglia. In D, in vivo MRI shows that this PRL slowly enlarged over the course of 5 years prior to death. Image contributed by Drs Simon Hemetner and Assunta Dal Bianco (A) Drs Simon Hemetner, Bing Yao and Francesca Bagnato (B), Dr Susan Gauthier (C) and Drs Martina Absinta and Daniel Reich (D).
Figure 5
Figure 5
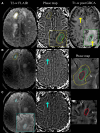
Paramagnetic rim lesion persisting upon resolution of gadolinium-based contrast enhancement. (A) T2-weighted fluid attenuated inversion recovery (T2-w FLAIR) image at 7 T showing a hyperintense lesion delineated by the yellow contour. The central more hyperintense core of the lesion is surrounded by a paramagnetic rim, as seen on the phase map presented next. There is likely vasogenic oedema (T2-hyperintense signal) peripheral to the paramagnetic rim (green contour). The lesion also has gadolinium enhancement [yellow arrows on the T1-weighted post-gadolinium-based contrast agent (GBCA) MRI], which co-localizes with the rim. Co-localization is shown with a green contour in the insets of the phase and T1-weighted post-GBCA MRI. Note that on this scan, the lesion cannot be called a paramagnetic rim lesion (PRL) because it demonstrates contrast enhancement. (B) A year later, there is partial resolution of the previous large lesion on T2-weighted FLAIR, now limited to the core area contoured in light blue (larger magnification in the middle inset). The lesion is no longer contrast-enhancing (data not shown) but retains PRL visibility on the phase map (indicated by the light blue arrow). The contour of the new phase rim is delineated in red, and it is contrasted with the size of the rim measured at baseline (green) and the overall lesion size at baseline (yellow). At this time point, the lesion can be called a PRL because it is no longer GBCA-enhancing and the paramagnetic rim (light blue arrow on phase map) co-localizes with the perimeter of the chronic lesion core (light blue) on T2-weighted FLAIR. (C) At Year 2, the lesion has remained approximately of the same size as delineated by the purple contour (which nearly overlaps with the light blue one, refer to the T2-weighted FLAIR inset). The PRL (light blue arrow on phase map) is also the same size (the red contour from Year 1 scan entirely overlaps with the rim on Year 2 scan, inset). Images were acquired on a person with newly diagnosed multiple sclerosis who was treatment naïve at the time of the baseline scan. Image contributed by Dr Francesca Bagnato, Habeeb F. Kazimuddin and Jiacheng Wang.
Figure 6
Figure 6
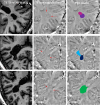
Paramagnetic rim lesion identification in the setting of large, confluent lesions. Representative examples of paramagnetic rim lesions (PRLs) and their suggested identification and segmentation (colour-coded PRL masks) in the setting of large, confluent lesions. In the first two cases, although the lesions are confluent on the T1-weighted image, two PRLs can be clearly distinguished on the unwrapped filtered phase image. In the third case, a reliable PRL sub-segmentation is not achievable and the lesion should be counted as a single PRL (even though it may in fact represent the confluence of several PRL). Image contributed by Dr Martina Absinta and Dr Daniel Reich.

References

    1. Katz D, Taubenberger JK, Cannella B, McFarlin DE, Raine CS, McFarland HF. Correlation between magnetic resonance imaging findings and lesion development in chronic, active multiple sclerosis. Ann Neurol. 1993;34:661–669. - PubMed
    1. McFarland HF. The lesion in multiple sclerosis: Clinical, pathological, and magnetic resonance imaging considerations. J Neurol Neurosurg Psychiatry. 1998;64(S1):S26–S30. - PubMed
    1. Harris JO, Frank JA, Patronas N, McFarlin DE, McFarland HF. Serial gadolinium-enhanced magnetic resonance imaging scans in patients with early, relapsing-remitting multiple sclerosis: Implications for clinical trials and natural history. Ann Neurol. 1991;29:548–555. - PubMed
    1. Stone LA, Smith ME, Albert PS, et al. Blood-brain barrier disruption on contrast-enhanced MRI in patients with mild relapsing-remitting multiple sclerosis: Relationship to course, gender, and age. Neurology. 1995;45:1122–1126. - PubMed
    1. Smith ME, Stone LA, Albert PS, et al. Clinical worsening in multiple sclerosis is associated with increased frequency and area of gadopentetate dimeglumine-enhancing magnetic resonance imaging lesions. Ann Neurol. 1993;33:480–489. - PubMed

Publication types

MeSH terms

Grants and funding