. 2024 Feb 5;221(2):e20230488.
doi: 10.1084/jem.20230488. Epub 2024 Jan 16.

The effector program of human CD8 T cells supports tissue remodeling

Affiliations

The effector program of human CD8 T cells supports tissue remodeling

Michael Delacher et al. J Exp Med. .

Abstract

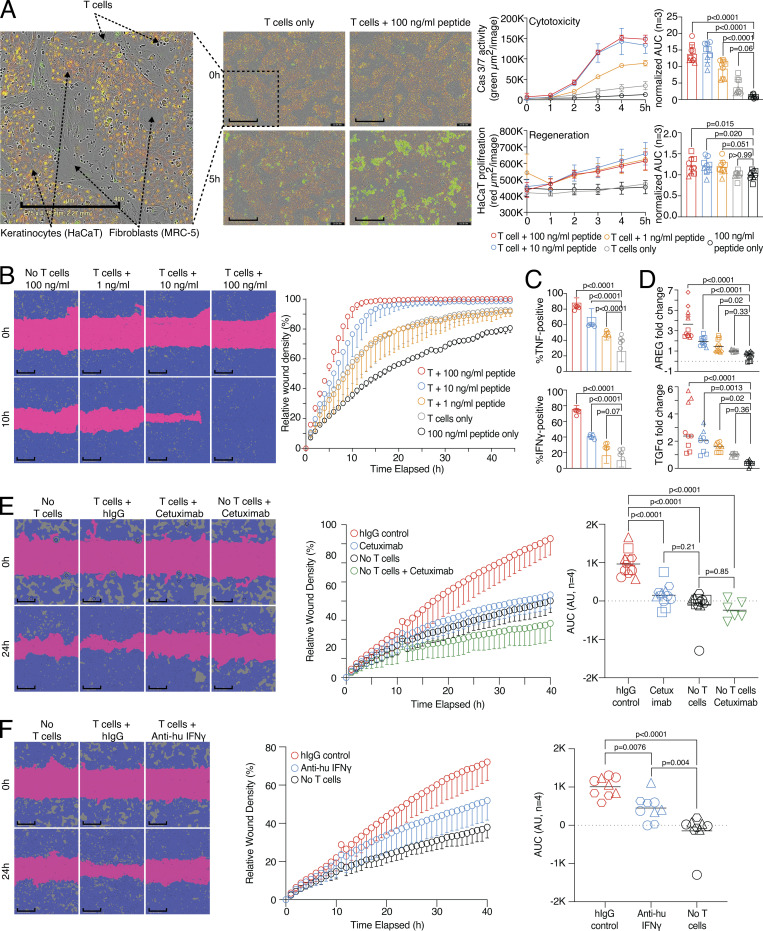
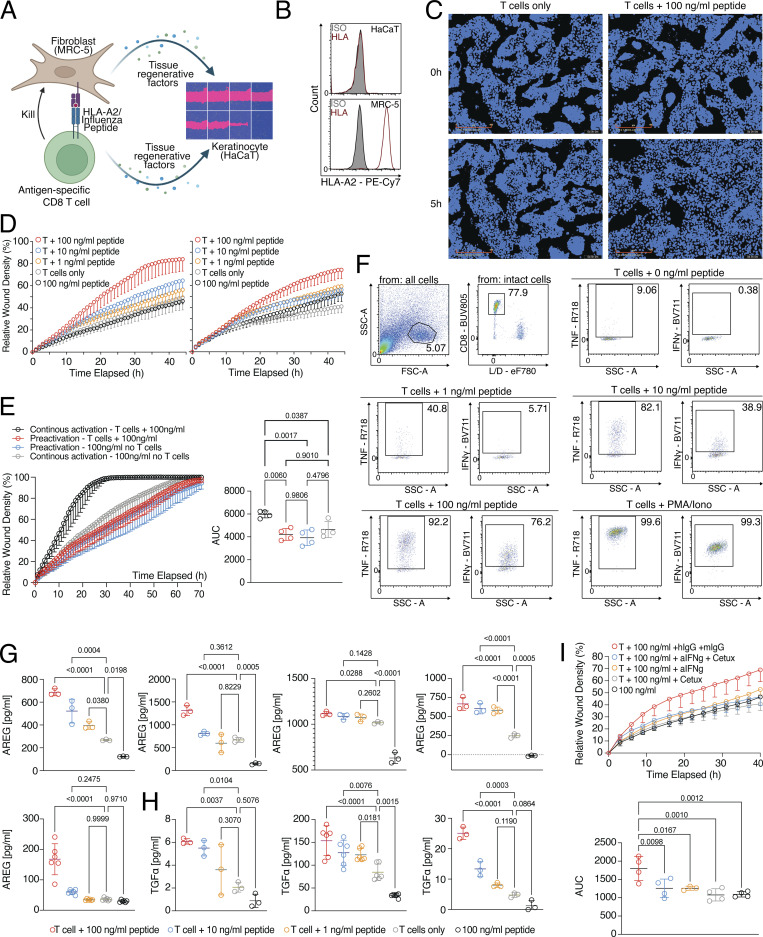
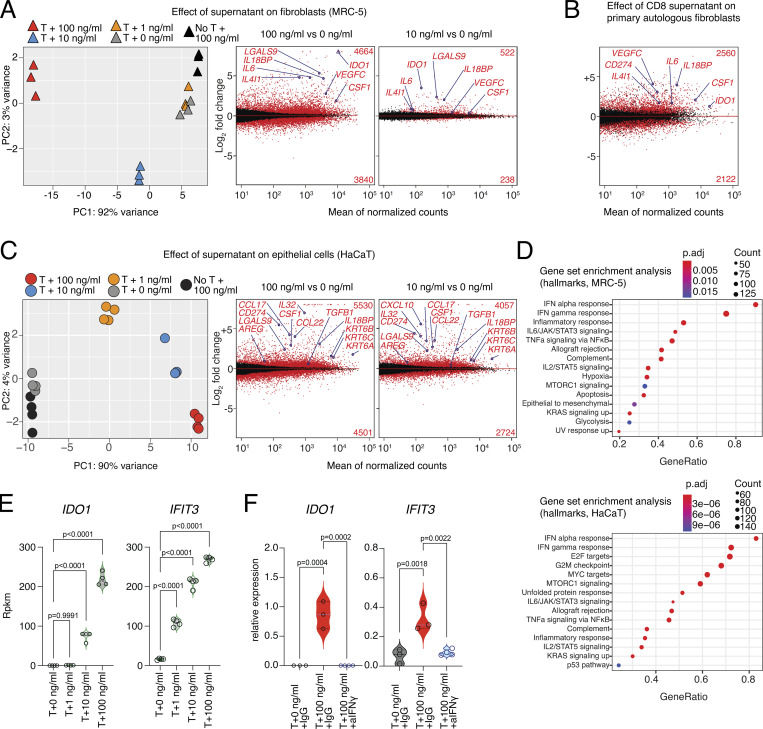
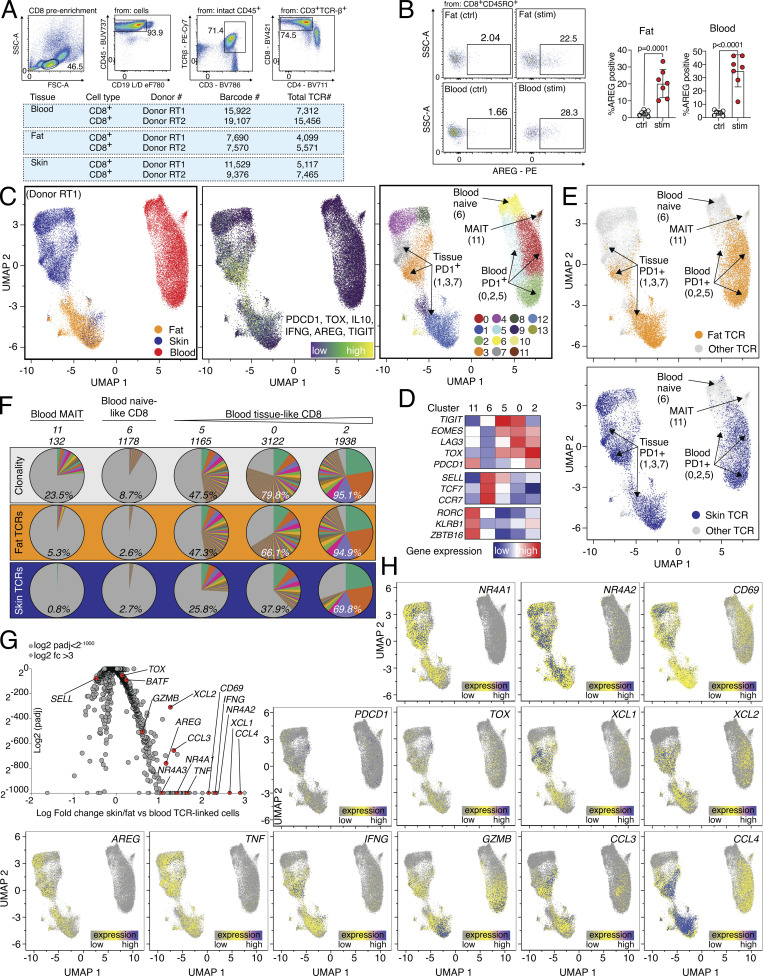
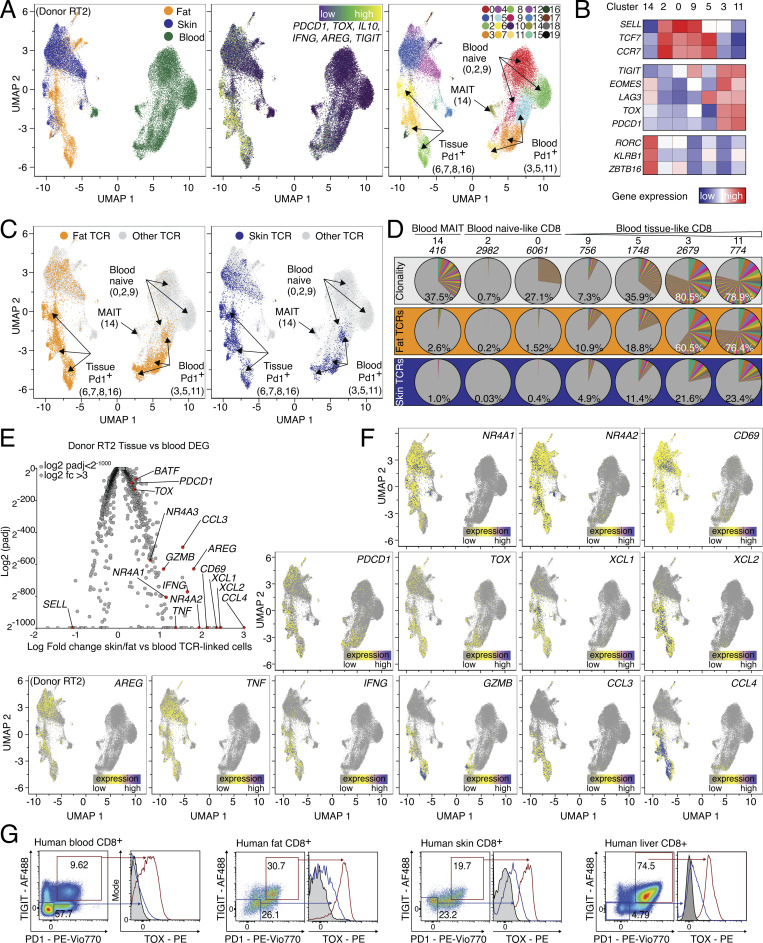
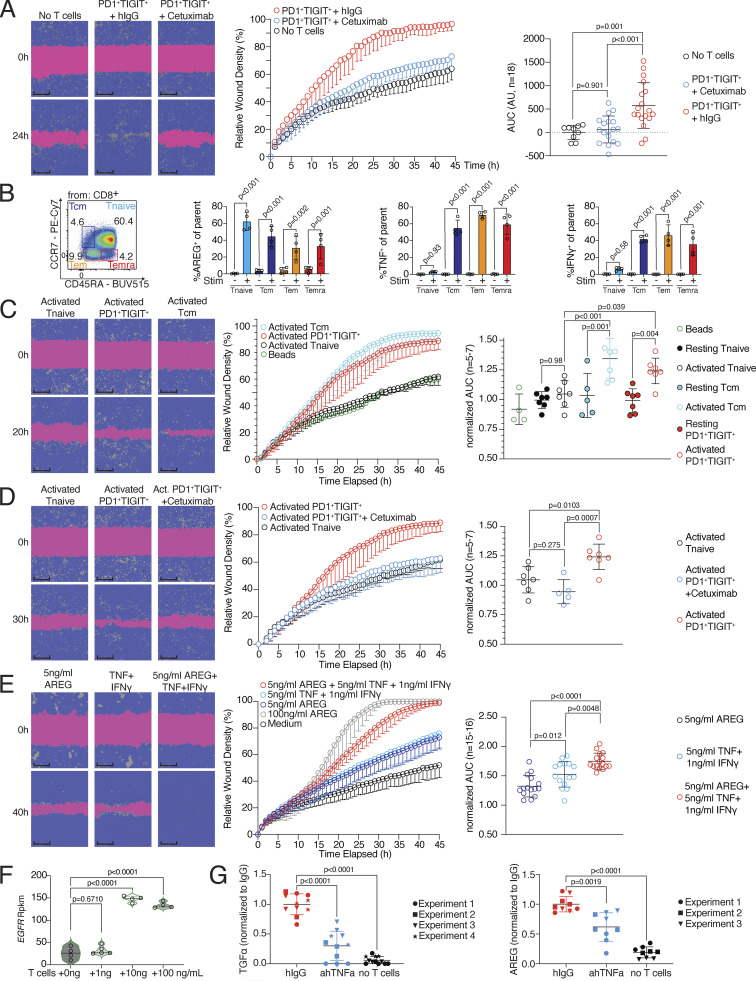
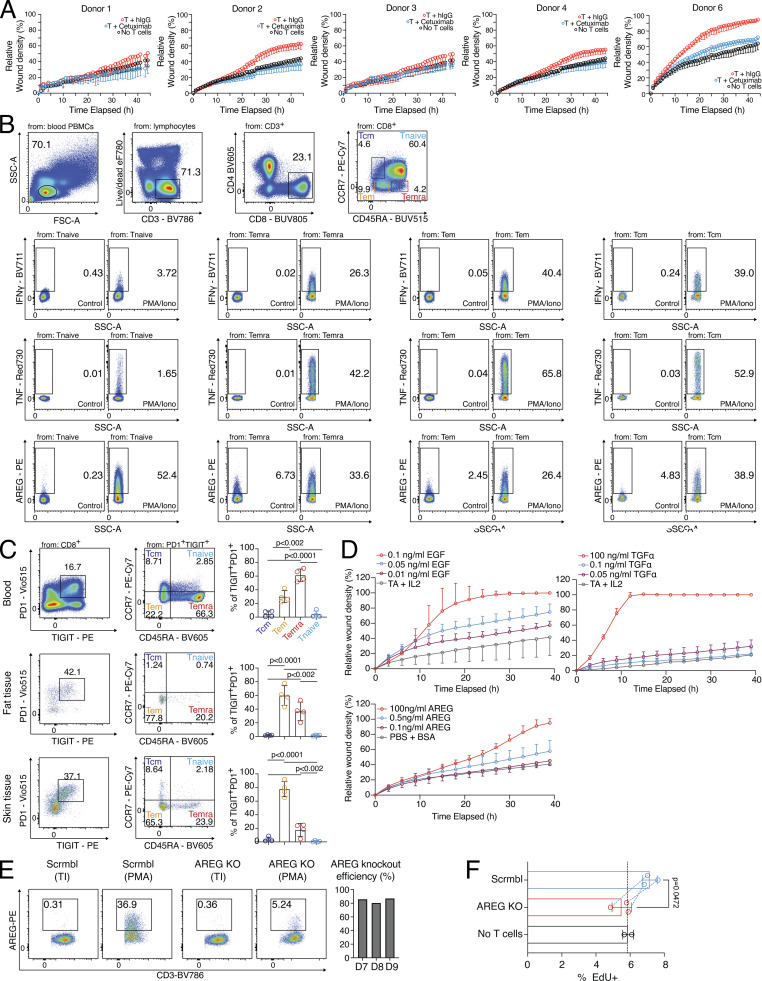
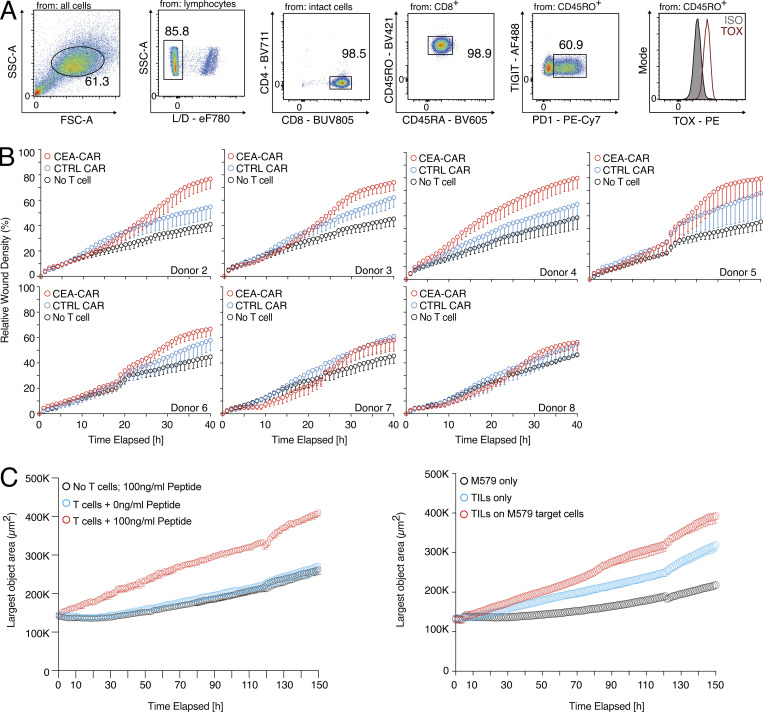
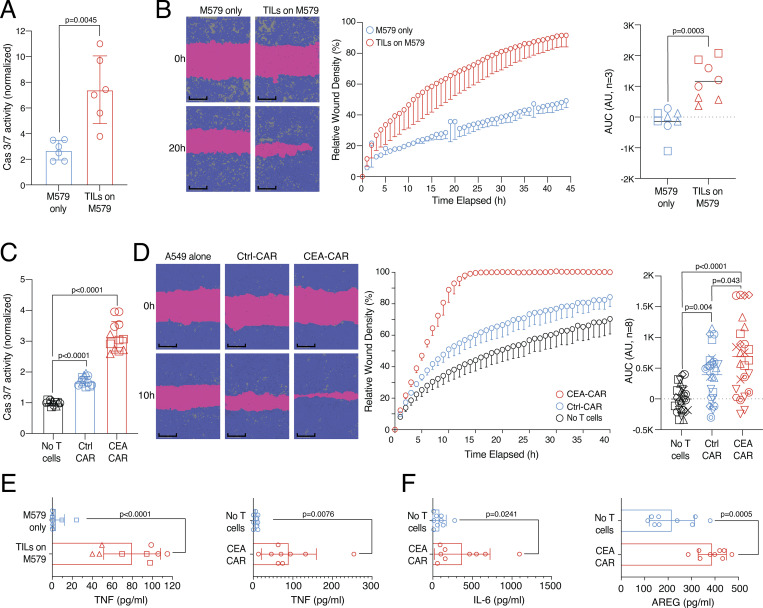
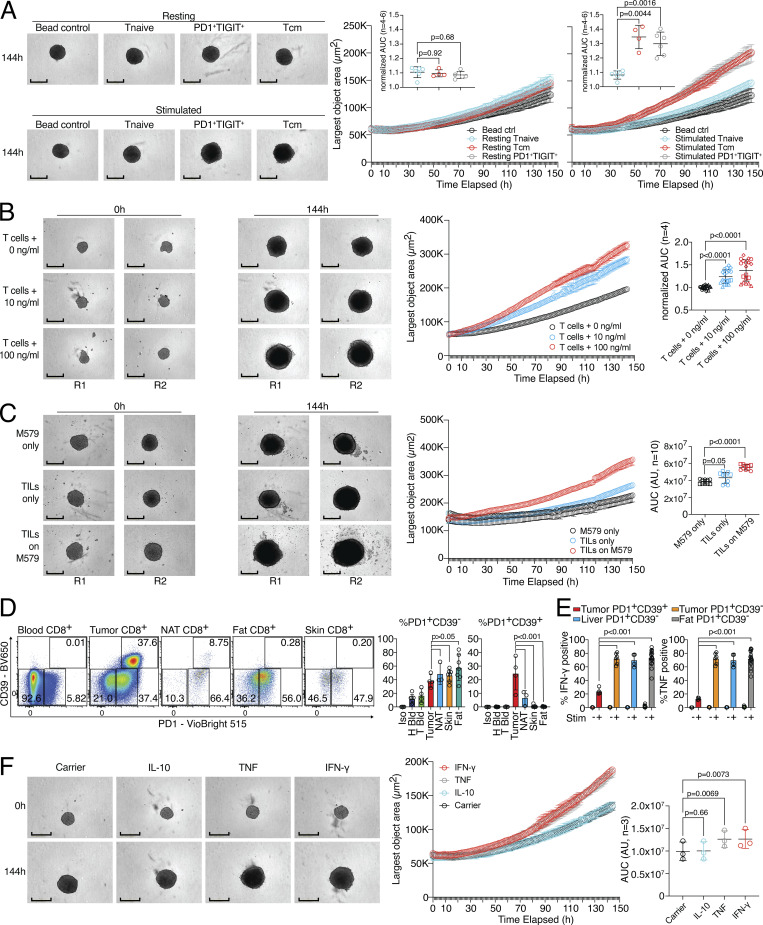
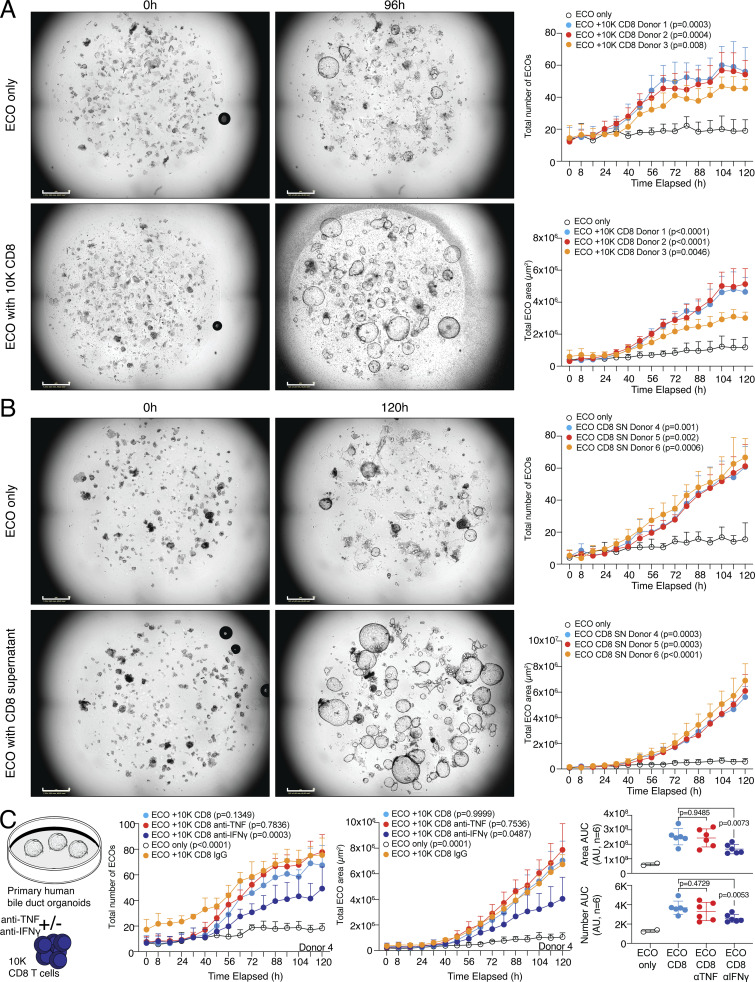
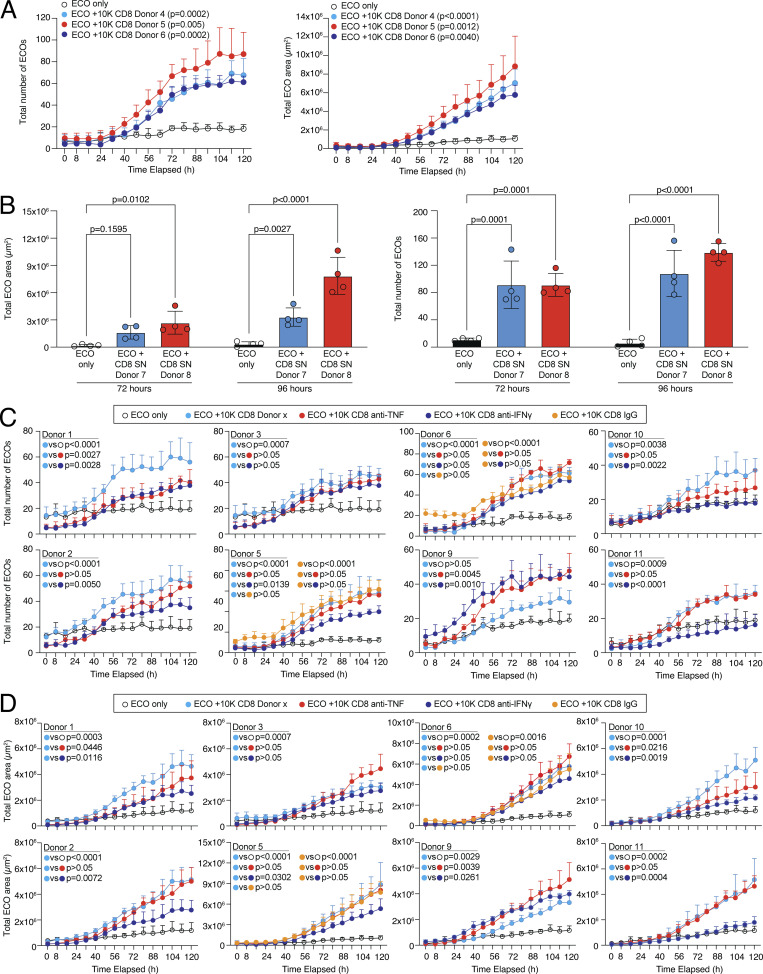
CD8 T lymphocytes are classically viewed as cytotoxic T cells. Whether human CD8 T cells can, in parallel, induce a tissue regeneration program is poorly understood. Here, antigen-specific assay systems revealed that human CD8 T cells not only mediated cytotoxicity but also promoted tissue remodeling. Activated CD8 T cells could produce the epidermal growth factor receptor (EGFR)-ligand amphiregulin (AREG) and sensitize epithelial cells for enhanced regeneration potential. Blocking the EGFR or the effector cytokines IFN-γ and TNF could inhibit tissue remodeling. This regenerative program enhanced tumor spheroid and stem cell-mediated organoid growth. Using single-cell gene expression analysis, we identified an AREG+, tissue-resident CD8 T cell population in skin and adipose tissue from patients undergoing abdominal wall or abdominoplasty surgery. These tissue-resident CD8 T cells showed a strong TCR clonal relation to blood PD1+TIGIT+ CD8 T cells with tissue remodeling abilities. These findings may help to understand the complex CD8 biology in tumors and could become relevant for the design of therapeutic T cell products.


Conflict of interest statement

Disclosures: M. Delacher reported personal fees from Odyssey Therapeutics outside the submitted work. E.K. Geissler reported personal fees from Quell outside the submitted work. No other disclosures were reported.

Figures

Figure 1.
Figure 1.
Wound healing and target killing are both effector mechanisms of CD8 T cells. (A) Combined proliferation and killing assay in the presence of influenza-specific CD8 T cells and varying amounts of pulsed peptides on MRC-5 and HaCaT cells seeded in a 30:70 ratio. Left, representative image with labels (0 versus 5 h; T cells only versus T cells + 100 ng/ml peptide). Right, representative quantification of Cas3/7 activity (green) and HaCaT proliferation (red) with titrated amounts of influenza peptide, with statistical verification across experiments using normalized area under the curve (AUC, n = 3, one-way ANOVA, symbols indicate individual experiments). Scale bars = 400 µm; enhanced for improved visibility. (B) SN from A tested in a wound healing assay with HaCaT cells; representative example with additional experiments in Fig. S1 (n = 3). Scale bars = 400 µm; enhanced for improved visibility. Reuse of the B panel in schematic of Fig. S1 A. (C) Measurement of intracellular TNF and IFN-γ in influenza-specific T cells used in the combined proliferation and killing assay, representative stainings (n = 12, one-way ANOVA), gating in Fig. S1. (D) Fold induction of AREG and TGFα in SNs from (A) (n = 3–4, one-way ANOVA, symbols indicate individual experiments) Individual experiments in Fig. S1. (E and F) Effect of using Cetuximab or anti-IFN-γ on wound healing capacity of SNs from (A) using background-corrected AUCs (n = 4, one-way ANOVA of AUC, symbols indicate individual experiments). Scale bars = 400 µm; enhanced for improved visibility. All data derived from three or more independent experiments.
Figure S1.
Figure S1.
Wound healing scratch assay. (A) Schematic of three-cell-type system with HLA-A2+ fibroblast cells (MRC-5) presenting influenza peptide to influenza-specific CD8 T cells, and HLA-A2 epithelial cells (HaCaT cells, keratinocytes). Visualization was created with BioRender using a graphical element from Fig. 1 B. (B) Expression of HLA-A2 in HaCaT versus MRC-5 cell lines. (C) Depiction of proliferation mask of HaCaT cells in a coculture with MRC-5 cells seeded in a 30:70 HaCaT:MRC-5 cell ratio pulsed with 0 (left) or 100 ng/ml (right) influenza peptide and cocultured with influenza-specific T cells after 0 (top) or 5 (bottom) h. Raw images are depicted in Fig. 1 A. Scale bars = 400 µm; enhanced for improved visibility. (D) MRC-5 and HaCaT cells were seeded in a 30:70 ratio and pulsed with varying amounts of influenza peptide for 1 h. Cells were cultured in the presence of influenza-specific T cells and cell-free SN was tested in a wound healing assay with HaCaT cells; two independent assay results (n = 3). (E) MRC-5 and HaCaT cells were seeded in a 30:70 ratio and pulsed with 100 ng/ml influenza peptide for 1 h. Cells were cultured in the presence or absence of influenza-specific T cells o/n. Cells were then either washed 3× and cultured o/n with fresh medium in the absence of influenza-specific T cells (preactivation) or left untouched (continuous activation). After an additional 24 h incubation period, cell-free SN was harvested and tested in a wound healing assay with HaCaT cells (n = 4). (F) Measurement of intracellular TNF and IFN-γ in influenza-specific T cells used in the combined proliferation and killing assay; representative gating. (G and H) Individual, unnormalized experiments of AREG (G) or TGFα (H) ELISA from Fig. 1 D. (I) MRC-5 and HaCaT cells were seeded in a 30:70 ratio and pulsed with 0 or 100 ng/ml influenza peptide for 1 h. Cells were cultured in the presence of influenza-specific T cells and cell-free SN was tested in a wound healing assay with HaCaT cells in the presence of aIFNγ, Cetuximab, aIFNγ, and Cetuximab or IgG control (n = 4).
Figure 2.
Figure 2.
CD8 T cells instruct other cell types to produce regenerative molecules. (A) Left, PCA of RNA-seq of fibroblast (MRC-5) cells stimulated o/n with SN of MRC-5 cells pulsed with varying concentrations of influenza peptide and cultured with influenza-specific T cells o/n (n = 3); Right, MA-plots with number of DEGs (Padj < 0.05) based on Deseq2 in red, several genes labeled. Gene expression data and statistical analysis in Table S1. (B) MA-plot of primary human fat fibroblasts stimulated with SN generated from autologous CD8 T cells isolated from fat tissue and stimulated o/n with IL-2 and beads or empty medium ctrl (n = 4). DEGs in red. Gene expression data and statistical analysis in Table S2. (C) Left, PCA of RNA-seq of epithelial cells (HaCaT) stimulated o/n with SN of MRC-5 cells pulsed with varying concentrations of influenza peptide and cultured with influenza-specific T cells o/n; Right, MA-plots with number of DEGs (Padj < 0.05) based on Deseq2 in red (n = 4), several genes labeled. Gene expression data and statistical analysis are in Table S3. (D) GSEA of MRC-5 fibroblasts (top) or HaCaT epithelial cells (bottom) stimulated o/n with SN of MRC-5 cells pulsed with 100 ng/ml of influenza peptide and cultured with influenza-specific T cells o/n. (E) Gene expression of IDO1 and IFIT3 in RNA-seq of epithelial cells (HaCaT) stimulated o/n with SN of MRC-5 cells pulsed with varying concentrations of influenza peptide and cultured with influenza-specific T cells o/n. Statistical analysis via Deseq2 (n = 3–4). (F) Relative expression of IDO1 and IFIT3 determined by quantitative PCR in epithelial cells (HaCaT) stimulated o/n in the presence of anti-IFN-γ or IgG control with SN of MRC-5 cells pulsed with 0 or 100 ng/ml of influenza peptide and cultured with influenza-specific T cells o/n. Statistical analysis via one-way ANOVA (n = 3–4).
Figure S2.
Figure S2.
scRNA/TCR-seq of human CD8 T cells with donor RT1. (A) Top, sort layout for CD8 pre-enriched immune cells from human blood. Bottom, QC of cells used for combined scRNA/TCR-seq isolated from human blood, fat, and skin. (B) Gating and quantification of AREG expression in human fat (left) and blood (right). CD8 T cells after o/n stimulation with TI (Ctrl) or PMA/ionomycin in the presence of TI (stim), n = 7. (C and D) Left, cells color-coded based on tissue of origin. Middle, expression of gene signature (PDCD1, TOX, IL10, IFNG, AREG, and TIGIT). Right, cells clustered in 12 groups. Annotation of clusters using signature genes shown in (D) and labeled in UMAP. (E) Top, TCRs derived from all fat CD8 T cells in cluster 1 (6,381 cells) are highlighted in yellow and displayed in all other clusters. Bottom, TCRs derived from all skin CD8 T cells in clusters 3,7 (8,627 cells) highlighted in blue and displayed in all other clusters. (F) Clonality of clusters (top, white), or tracking of fat (middle, orange) or skin (bottom, blue) CD8 T cells in blood-based clusters of the same donor. The percentage indicates the fraction of detected clones among total clones for the donor, with the total number of clones shown above. Each slice represents a clonotype with the angle representing its fraction among all cells in the respective cluster. (G) DEGs between TCR-identical cells in clusters 1, 3, 7 and 0, 2, 5, 6, 11. Several genes highlighted in red and labeled, Padj values <2−1000 capped at 2−1000. Values >3 capped at 3. (H) Gene expression of NR4A1, NR4A2, CD69, TOX, XCL1, XCL2, AREG, TNF, IFNG, GZMB, CCL3, PDCD1, and CCL4 in CD8 T cells from donor RT1. CDR3 sequences are listed in Table S4. All data are derived from two or more independent experiments with an additional donor RT2 shown in Fig. 3.
Figure 3.
Figure 3.
Human PD1+TIGIT+ CD8 T cells in blood and tissues are clonally related and express effector molecules. (A) UMAP of scRNA-seq data derived from FACS-sorted CD8 T cell populations of human peripheral blood, skin, and fat of one donor (“Donor RT2”). Left, cells color-coded based on tissue of origin. Middle, expression of gene signature (PDCD1, TOX, IL10, IFNG, AREG, and TIGIT). Right, cells clustered in 20 groups. (B) Annotation of clusters using signature genes shown in (B) and labeled in UMAP. Sort info and quality control (QC) in Fig. S2; experimental repeat with second donor (“Donor RT1”) in Fig. S2. (C) TCRs derived from fat (left) and skin (right) CD8 T cells in effector cell clusters 6, 7, 8, and 16 (fat: 8,158 cells, skin: 4,573 cells) were highlighted in yellow (fat) or blue (skin) and displayed in all other clusters. (D) Clonality of clusters (top, white) or tracking of fat (middle, orange) or skin (bottom, blue) CD8 T cells in blood-based clusters of the same donor. The percentage indicates the fraction of detected clones among the total clones for the donor, with the total number of clones shown above. Each slice represents a clonotype with the angle representing its fraction among all cells in the respective cluster. (E) DEGs between TCR-identical cells in clusters 6, 7, 8, 16 and 0, 2, 3, 5, 9, 11, 14, 18. Several genes highlighted in red and labeled, Padj values <2−1000 capped at 2−1000. Values >3 capped at 3. (F) Gene expression of NR4A1, NR4A2, CD69, TOX, XCL1, XCL2, AREG, TNF, IFNG, GZMB, CCL3, PDCD1, and CCL4 in CD8 T cells from donor RT2. CDR3 sequences are listed in Table S4. (G) Expression of intracellular TOX in PD1+TIGIT+ CD8 T cells from human blood, fat, skin, and liver tissue. All data are derived from two or more independent experiments with the indicated number of human donors.
Figure 4.
Figure 4.
Subsets of CD8 T cells can instruct wound healing. (A) Wound healing assay with SNs of human blood-derived CD45RO+CD45RAPD1+TIGIT+ CD8 T cells, in vitro activated by anti-CD3/CD28 beads in the presence of MRC-5 cells, treated with either human IgG or Cetuximab, representative example. Statistical verification across experiments using background-subtracted AUC (n = 6, one-way ANOVA). More individual donors in Fig. S3. Scale bars = 400 µm; enhanced for improved visibility. (B) Identification of Tnaive (CD45RA+CCR7+), Temra (CD45RA+CCR7), Tem (CD45RACCR7), and Tcm (CD45RACCR7+) in human blood, followed by intracellular flow cytometry to detect AREG, TNF, and IFN-γ following 4 h incubation in the presence of PMA/ionomycin and transport inhibitors (Stim+) or transport inhibitor only (Stim−, one-way ANOVA with n = 4). Additional gating and controls in Fig. S3. (C) Human blood-derived Tnaive, Tcm, and CD45RA+/−CCR7PD1+TIGIT+ CD8 T cells were either in vitro cultivated (resting) or in vitro cultivated and activated by anti-CD3/CD28 beads (activated), followed by collection of cell-free SN, which was then used in a wound healing assay with HaCaT cells. Representative images show wound density at 0 and 20 h following wounding and application of cell-free SNs. Statistical verification using normalized AUC (n = 5–7, one-way ANOVA). Scale bars = 400 µm; enhanced for improved visibility. (D) Wound healing assay with SNs of human blood-derived and in vitro activated and co-cultured PD1+TIGIT+ or Tnaive CD8 T cells, treated with Cetuximab during wound healing assay (n = 6, unpaired t test), representative images show wound density at 0 and 30 h following wounding and application of SNs. Statistical verification using normalized AUC (n = 5–7, one-way ANOVA). Scale bars = 400 µm; enhanced for improved visibility. (E) Wound healing assay with human recombinant AREG (100 or 5 ng/ml), TNF (5 ng/ml), and IFN-γ (1 ng/ml), representative images of wound density 0 and 40 h after initial wounding shown. Statistical verification using normalized AUC (n = 15–16, one-way ANOVA). Scale bars = 400 µm; enhanced for improved visibility. (F) EGFR expression in HaCaT cells stimulated o/n with SN generated in the three-cell-type system. Results derived from sequencing data from Fig. 2 C. (G) TGFα (left) and AREG (right) level in SN of three-cell-type system as described in Fig. 1 A in the presence of hIgG, anti-hTNF, or no T cells. Cytokine levels determined by ELISA. All data were derived from several independent experiments with the indicated number of donors.
Figure S3.
Figure S3.
Cytokine expression and wound healing potential of blood-derived CD8 T cells. (A) Wound healing assay with SNs of human blood-derived and in vitro activated and cocultured PD1+TIGIT+ CD8 T cells (T = T cells), treated with either human IgG or Cetuximab during wound healing assay; several donors. (B) Gating to identify Tnaive (CD45RA+CCR7+), Temra (CD45RA+CCR7), Tem (CD45RACCR7), and Tcm (CD45RACCR7+) in human blood, followed by intracellular flow cytometry to detect human AREG, TNF, and IFN-γ following 4 h incubation in the presence of PMA/ionomycin and transport inhibitors or transport inhibitor only. (C) Gating to identify Tnaive (CD45RA+CCR7+), Temra (CD45RA+CCR7), Tem (CD45RACCR7), and Tcm (CD45RACCR7+) in PD1+TIGIT+ CD8 T cells from human blood, fat, and skin tissue. Statistics to the right (one-way ANOVA, n = 4). (D) Wound healing assay with varying concentrations of recombinant human EGF, TGFα, or AREG. (E) AREG CRISPR KO efficiency. Left, exemplary flow cytometry plots depicting AREG expression; right, quantification. (F) EdU incorporation in HaCaT cells treated o/n with SN from scrmbl CD8 T cells, AREG knockout CD8 T cells or no T cell control (n = 3, Student’s t test). All data were derived from experiments with several independent donors.
Figure S4.
Figure S4.
Human CD8 T cells can promote tumor growth in vitro. (A) Expression of TOX in TILs. (B) Wound healing assay with SN derived from CEA-CAR-transgenic CD8 T cells versus Ctrl-CAR-transgenic CD8 T cells or no T cells; individual donors are shown. (C) Spheroid assay using cell-free SN from influenza-specific CD8 T cells and varying amounts of pulsed peptides on MRC-5 and HaCaT cells seeded in a 30:70 ratio (left) or tumor-TIL coculture (right); experimental repeat of Fig. 6, B and C.
Figure 5.
Figure 5.
Human CD8 TILs and CAR T cells can support tumor cell killing and wound healing in vitro. (A) TIL-target cell coculture with killing activity of TILs measured via green fluorescence (Cas 3/7, n = 3, unpaired t test). (B) Wound healing assay with HaCaT cells using SN derived from TIL-target cell coculture or M579 only. Statistical verification across experiments using background-subtracted AUC (n = 3, unpaired t test of AUC, symbols indicate individual experiments). Scale bars = 400 µm; enhanced for improved visibility. (C) CEA-CAR-transgenic CD8 T cells, Ctrl-CAR-transgenic CD8 T cells, or no T cells were cocultured with CEA-expressing A549 target cells. Killing activity of CAR T cells was measured via green fluorescence (Cas 3/7, n = 3, unpaired t test, symbols indicate individual experiments). (D) Wound healing assay with SN derived from CEA-CAR-transgenic CD8 T cells versus Ctrl-CAR-transgenic CD8 T cells or no T cells. Representative example; more donors in Fig. S4. Statistical verification across experiments using background-subtracted AUC (n = 8, one-way ANOVA of AUC, symbols indicate individual experiments). Scale bars = 400 µm; enhanced for improved visibility. (E) TNF in TIL-target cell co-culture (left, n = 3, unpaired t test, symbols indicate individual experiments) or CEA-CAR-transgenic CD8 T cell coculture (right, n = 9, paired t test). (F) IL-6 (left) and AREG (right) in CEA-CAR-transgenic CD8 T cell co-culture (n = 9, paired t test). All data were derived from two or more independent experiments with the indicated number of replicates.
Figure 6.
Figure 6.
Human CD8 T effector cells can support tumor spheroid growth. (A) CD8 Tnaive, Tcm, and PD1+TIGIT+ were isolated from human blood and ex vivo cultivated (resting) or ex vivo cultivated and activated (stimulated). Cell-free SNs were used in a spheroid assay, and spheroid growth was observed over time. Left, representative images with bead control, unstimulated, or stimulated Tnaive, Tcm, or PD1+TIGIT+ CD8 T cells. Right, largest object areas over cultivation time with statistical verification across experiments using normalized AUC (n = 4–6, one-way ANOVA). Scale bars = 400 µm; enhanced for improved visibility. (B) Spheroid assay using cell-free SN from influenza-specific CD8 T cells and varying amounts of pulsed peptides on MRC-5 and HaCaT cells seeded in a 30:70 ratio with statistical verification across experiments using normalized AUC (n = 4, one-way ANOVA of AUC, symbols indicate individual experiments), experimental repeat in Fig. S4. Scale bars = 400 µm; enhanced for improved visibility. (C) Spheroid assay using cell-free SN from TIL-target cell coculture with statistical verification across experiments using background-subtracted AUC (n = 10, one-way ANOVA of AUC, symbols indicate individual experiments), experimental repeat in Fig. S4. Scale bars = 400 µm; enhanced for improved visibility. (D) Expression of CD39 and PD1 in CD8 T cells from tumor patient blood, liver tumor, liver NAT, fat, and skin; statistics to the right (n = 3–7, one-way ANOVA). (E) Intracellular deposition of IFN-γ and TNF in PMA/ionomycin and TI-stimulated liver tumor, liver NAT, and fat CD8 T cell subpopulations (n = 4–17, one-way ANOVA). (F) Spheroid assay using recombinant cytokines. Left, representative images with carrier, IL-10, TNF, and IFN-γ. Right, largest object area over cultivation time, with statistical verification across experiments using background-subtracted AUC (n = 3, one-way ANOVA of AUC). Scale bars = 400 µm; enhanced for improved visibility. All data are derived from two or more independent experiments with the indicated number of replicates.
Figure 7.
Figure 7.
Human CD8 T effector cells can promote tissue regeneration in organoids. (A) 20 ECO organoids were dissociated and cultured alone or in coculture with 10,000 CD8 T cells derived from different donors (D1–D3) and organoid growth was observed over time. Left, representative images of organoids. Right, quantification of the number of organoids (top) and total organoid area (bottom) over cultivation time with statistical verification using AUC (n = 4 wells, one-way ANOVA, compared to ECO only). Additional individual donors are shown in Fig. S5. Growth kinetics are shown in Videos 1 and 2. Scale bars = 800 µm; enhanced for improved visibility. (B) 20 ECO organoids were dissociated and cultured alone or in coculture with cell-free SN of 200,000 activated CD8 T cells derived from different donors (D4–D6) and organoid growth was observed over time. Left, representative images of organoids. Right, quantification of the number of organoids (top) and total organoid area (bottom) over cultivation time with statistical verification using AUC (n = 4 wells, one-way ANOVA, compared to only ECO). Additional individual donors are shown in Fig. S5. Growth kinetics are shown in Videos 3 and 4. Scale bars = 800 µm; enhanced for improved visibility. (C) 20 ECO organoids were dissociated and cultured alone or in coculture with 10,000 CD8 T cells derived from different donors (D1–D6) in presence or absence of anti-IFN-γ or anti-TNF and organoid growth was observed over time. IgG served as a control. Left, experimental layout. Middle, quantification of the number of organoids and total organoid area over cultivation time from D4 (n = 4 wells, one-way ANOVA, compared to IgG). Right, quantification of organoid area and number from all donors of experiment 1 and 2 (D1–D6) combined with statistical verification using AUC from 48 h onwards (N = 6 donors, one-way ANOVA, compared with CD8, symbols indicate individual experiments). Additional individual donors from experiment 1 (D1–D3), experiment 2 (D4–D6), and experiment 3 (D9–D11) are shown in Fig. S5. All data derived from two or more independent experiments with the indicated number of replicates and donors.
Figure S5.
Figure S5.
Human CD8 T cells can promote tissue regeneration in organoids. (A) 20 ECO organoids were dissociated and cultured alone or in coculture with 10,000 CD8 T cells derived from different donors (D4–D6) and organoid growth was observed over time. Quantification of the number of organoids (left) and total organoid area (right) over cultivation time with statistical verification using AUC (n = 4 wells, one-way ANOVA, compared to ECO only). (B) 20 ECO organoids were dissociated and cultured alone or in coculture with cell-free SN of 200,000 activated CD8 T cells derived from different donors (D7 and D8) and organoid growth was determined at 72 and 96 h. Quantification of the total organoid area (left) and the number of organoids (right) at indicated time points with statistical verification (n = 4 wells, two-way ANOVA, compared to ECO only). (C and D) 20 ECO organoids were dissociated and cultured alone or in coculture with 10,000 CD8 T cells derived from different donors (experiment 1 [D1–D3], experiment 2 [D5 and D6], and experiment 3 [D9–D11]) in the presence or absence of anti-IFN-γ or anti-TNF, and organoid growth was observed over time. IgG served as a control. Quantification of organoid number (C) and total organoid area (D) over cultivation time with statistical verification using AUC from 48 h onwards (n = 4 wells, one-way ANOVA, compared to CD8 for D1–D3 and D9–D11, and compared to CD8 or IgG for D5 and D6, as depicted).

References

    1. Alfei, F., Kanev K., Hofmann M., Wu M., Ghoneim H.E., Roelli P., Utzschneider D.T., von Hoesslin M., Cullen J.G., Fan Y., et al. . 2019. TOX reinforces the phenotype and longevity of exhausted T cells in chronic viral infection. Nature. 571:265–269. 10.1038/s41586-019-1326-9 - DOI - PubMed
    1. Aran, D., Looney A.P., Liu L., Wu E., Fong V., Hsu A., Chak S., Naikawadi R.P., Wolters P.J., Abate A.R., et al. . 2019. Reference-based analysis of lung single-cell sequencing reveals a transitional profibrotic macrophage. Nat. Immunol. 20:163–172. 10.1038/s41590-018-0276-y - DOI - PMC - PubMed
    1. Arpaia, N., Green J.A., Moltedo B., Arvey A., Hemmers S., Yuan S., Treuting P.M., and Rudensky A.Y.. 2015. A distinct function of regulatory T cells in tissue protection. Cell. 162:1078–1089. 10.1016/j.cell.2015.08.021 - DOI - PMC - PubMed
    1. Bailey, S.R., Vatsa S., Larson R.C., Bouffard A.A., Scarfò I., Kann M.C., Berger T.R., Leick M.B., Wehrli M., Schmidts A., et al. . 2022. Blockade or deletion of IFNγ reduces macrophage activation without compromising CAR T-cell function in hematologic malignancies. Blood Cancer Discov. 3:136–153. 10.1158/2643-3230.BCD-21-0181 - DOI - PMC - PubMed
    1. Braband, K.L., Kaufmann T., Floess S., Zou M., Huehn J., and Delacher M.. 2022. Stepwise acquisition of unique epigenetic signatures during differentiation of tissue Treg cells. Front. Immunol. 13:1082055. 10.3389/fimmu.2022.1082055 - DOI - PMC - PubMed