

Variation in Intraoperative Opioid Administration by Patient, Clinician, and Hospital Contribution
- PMID: 38227311
- PMCID: PMC10792468
- DOI: 10.1001/jamanetworkopen.2023.51689
Variation in Intraoperative Opioid Administration by Patient, Clinician, and Hospital Contribution
Abstract
Importance: The opioid crisis has led to scrutiny of opioid exposures before and after surgical procedures. However, the extent of intraoperative opioid variation and the sources and contributing factors associated with it are unclear.
Objective: To analyze attributable variance of intraoperative opioid administration for patient-, clinician-, and hospital-level factors across surgical and analgesic categories.
Design, setting, and participants: This cohort study was conducted using electronic health record data collected from a national quality collaborative database. The cohort consisted of 1 011 268 surgical procedures at 46 hospitals across the US involving 2911 anesthesiologists, 2291 surgeons, and 8 surgical and 4 analgesic categories. Patients without ambulatory opioid prescriptions or use history undergoing an elective surgical procedure between January 1, 2014, and September 11, 2020, were included. Data were analyzed from January 2022 to July 2023.
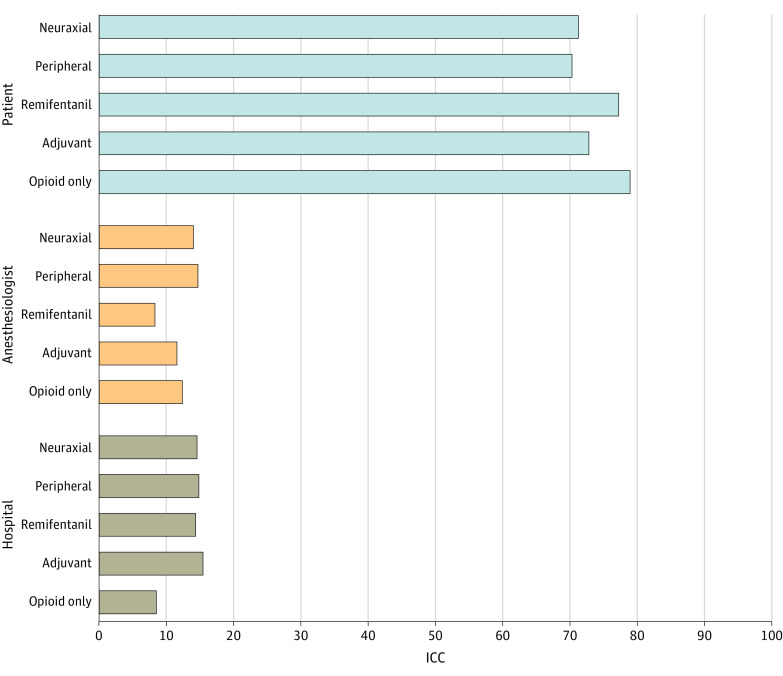
Main outcomes and measures: The rate of intraoperative opioid administration as a continuous measure of oral morphine equivalents (OMEs) normalized to patient weight and case duration was assessed. Attributable variance was estimated in a hierarchical structure using patient, clinician, and hospital levels and adjusted intraclass correlations (ICCs).
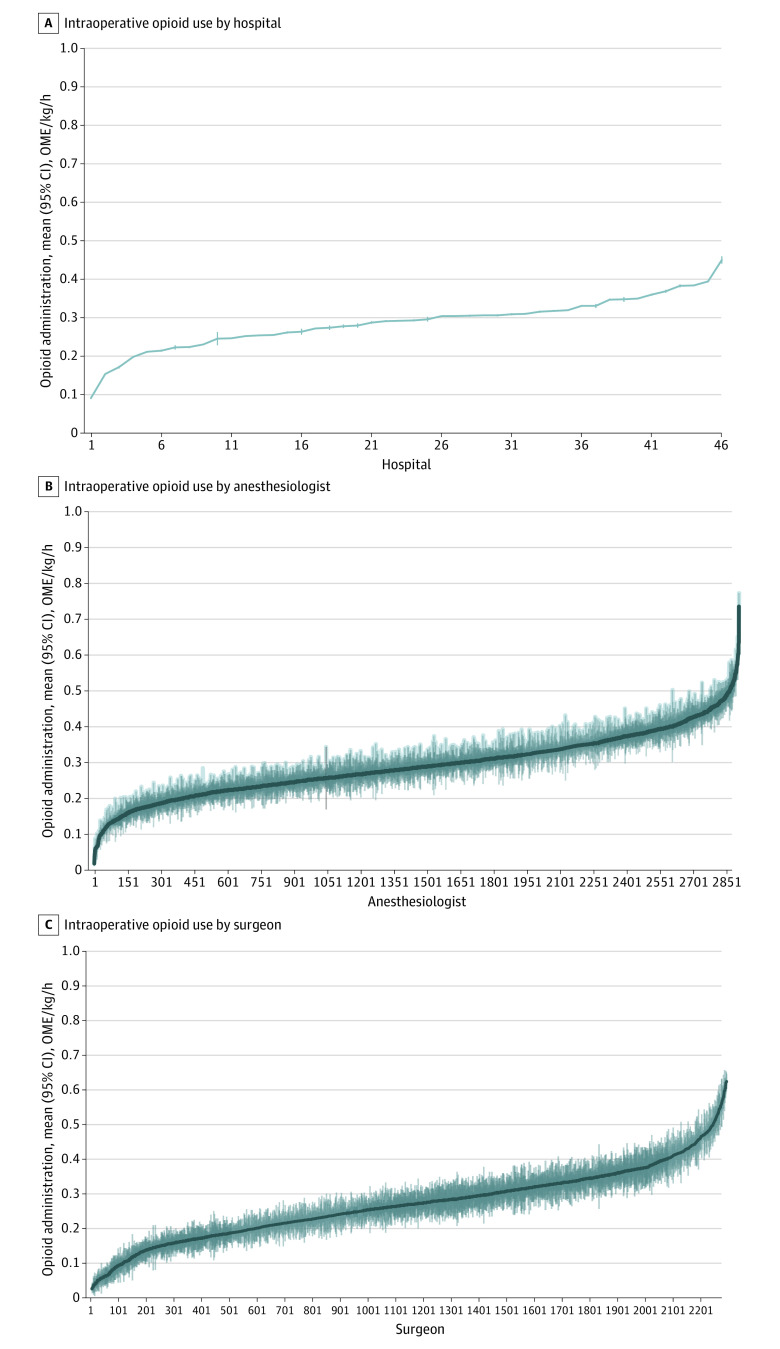
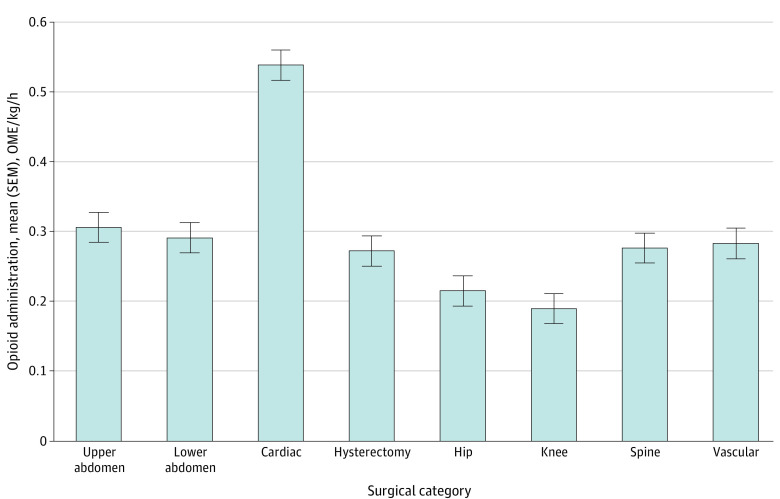
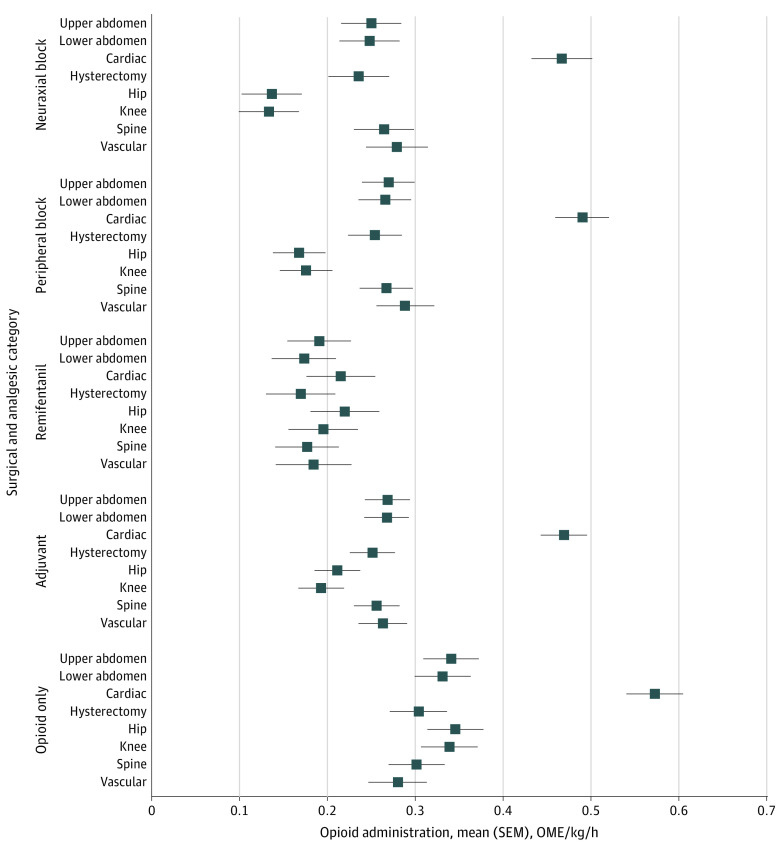
Results: Among 1 011 268 surgical procedures (mean [SD] age of patients, 55.9 [16.2] years; 604 057 surgical procedures among females [59.7%]), the mean (SD) rate of intraoperative opioid administration was 0.3 [0.2] OME/kg/h. Together, clinician and hospital levels contributed to 20% or more of variability in intraoperative opioid administration across all analgesic and surgical categories (adjusting for surgical or analgesic category, ICCs ranged from 0.57-0.79 for the patient, 0.04-0.22 for the anesthesiologist, and 0.09-0.26 for the hospital, with the lowest ICC combination 0.21 for anesthesiologist and hosptial [0.12 for the anesthesiologist and 0.09 for the hospital for opioid only]). Comparing the 95th and fifth percentiles of opioid administration, variation was 3.3-fold among anesthesiologists (surgical category range, 2.7-fold to 7.7-fold), 4.3-fold among surgeons (surgical category range, 3.4-fold to 8.0-fold), and 2.2-fold among hospitals (surgical category range, 2.2-fold to 4.3-fold). When adjusted for patient and surgical characteristics, mean (square error mean) administration was highest for cardiac surgical procedures (0.54 [0.56-0.52 OME/kg/h]) and lowest for orthopedic knee surgical procedures (0.19 [0.17-0.21 OME/kg/h]). Peripheral and neuraxial analgesic techniques were associated with reduced administration in orthopedic hip (51.6% [95% CI, 51.4%-51.8%] and 60.7% [95% CI, 60.5%-60.9%] reductions, respectively) and knee (48.3% [95% CI, 48.0%-48.5%] and 60.9% [95% CI, 60.7%-61.1%] reductions, respectively) surgical procedures, but reduction was less substantial in other surgical categories (mean [SD] reduction, 13.3% [8.8%] for peripheral and 17.6% [9.9%] for neuraxial techniques).
Conclusions and relevance: In this cohort study, clinician-, hospital-, and patient-level factors had important contributions to substantial variation of opioid administrations during surgical procedures. These findings suggest the need for a broadened focus across multiple factors when developing and implementing opioid-reducing strategies in collaborative quality-improvement programs.
Conflict of interest statement
Figures
Similar articles
-
Practice Patterns and Variability in Intraoperative Opioid Utilization: A Report From the Multicenter Perioperative Outcomes Group.Anesth Analg. 2022 Jan 1;134(1):8-17. doi: 10.1213/ANE.0000000000005663. Anesth Analg. 2022. PMID: 34291737
-
Prescribed Opioid Dosages, Payer Type, and Self-Reported Outcomes After Surgical Procedures in Michigan, 2018-2020.JAMA Netw Open. 2023 Jul 3;6(7):e2322581. doi: 10.1001/jamanetworkopen.2023.22581. JAMA Netw Open. 2023. PMID: 37428502 Free PMC article.
-
Opioid Dose Variation in Cardiac Surgery: A Multicenter Study of Practice.Anesth Analg. 2025 May 1;140(5):1016-1027. doi: 10.1213/ANE.0000000000007128. Anesth Analg. 2025. PMID: 39167548
-
Comparison of Opioids Prescribed by Advanced Practice Clinicians vs Surgeons After Surgical Procedures in the US.JAMA Netw Open. 2023 Jan 3;6(1):e2249378. doi: 10.1001/jamanetworkopen.2022.49378. JAMA Netw Open. 2023. PMID: 36598786 Free PMC article.
-
Association of Hydrocodone Schedule Change With Opioid Prescriptions Following Surgery.JAMA Surg. 2018 Dec 1;153(12):1111-1119. doi: 10.1001/jamasurg.2018.2651. JAMA Surg. 2018. PMID: 30140896 Free PMC article.
Cited by
-
Efficacy and safety of single and double catheter intrathecal drug delivery systems in patients with refractory neck and abdominal cancer pain.Sci Rep. 2024 Dec 30;14(1):32072. doi: 10.1038/s41598-024-83799-1. Sci Rep. 2024. PMID: 39738565 Free PMC article.
-
Sugammadex reduces urinary retention after laparoscopic inguinal hernia repair: a retrospective analysis and brief literature review.Surg Endosc. 2025 Aug;39(8):5287-5295. doi: 10.1007/s00464-025-11915-x. Epub 2025 Jul 1. Surg Endosc. 2025. PMID: 40593325 Review.
-
Accounting for Healthcare Structures When Measuring Variation in Care.Anesthesiology. 2025 May 1;142(5):793-805. doi: 10.1097/ALN.0000000000005395. Epub 2025 Apr 8. Anesthesiology. 2025. PMID: 40197451 Review.
-
Intraoperative opioid administrations, rescue doses in the post-anaesthesia care unit and clinician-perceived factors for dose adjustments in adults: A Danish nationwide survey.Acta Anaesthesiol Scand. 2025 Mar;69(3):e70000. doi: 10.1111/aas.70000. Acta Anaesthesiol Scand. 2025. PMID: 39971485 Free PMC article.
