. 2024 Mar 1;134(5):e162246.
doi: 10.1172/JCI162246.

Glucocorticoid receptor-dependent therapeutic efficacy of tauroursodeoxycholic acid in preclinical models of spinocerebellar ataxia type 3

Affiliations

Glucocorticoid receptor-dependent therapeutic efficacy of tauroursodeoxycholic acid in preclinical models of spinocerebellar ataxia type 3

Sara Duarte-Silva et al. J Clin Invest. .

Abstract

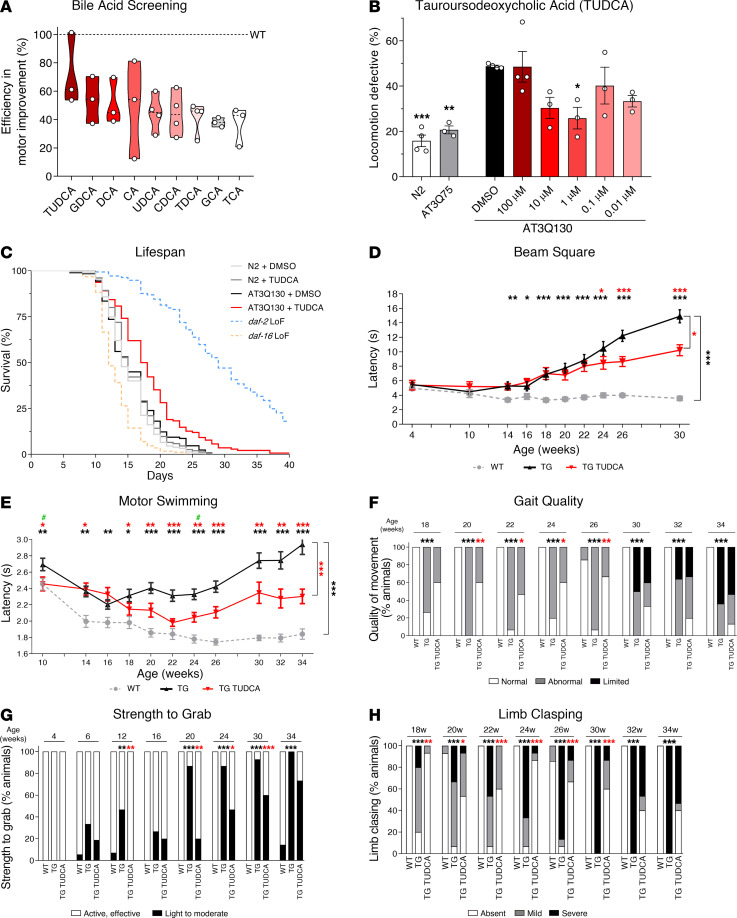
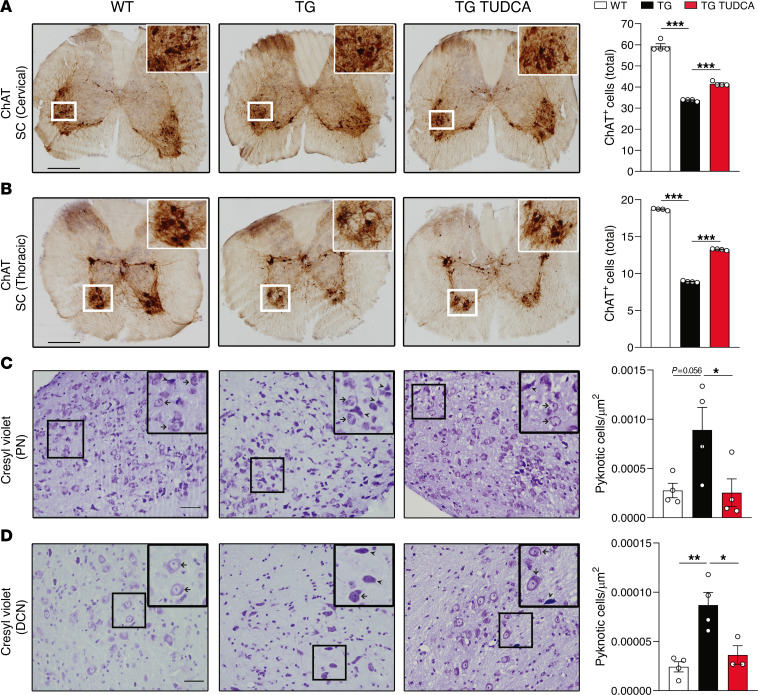
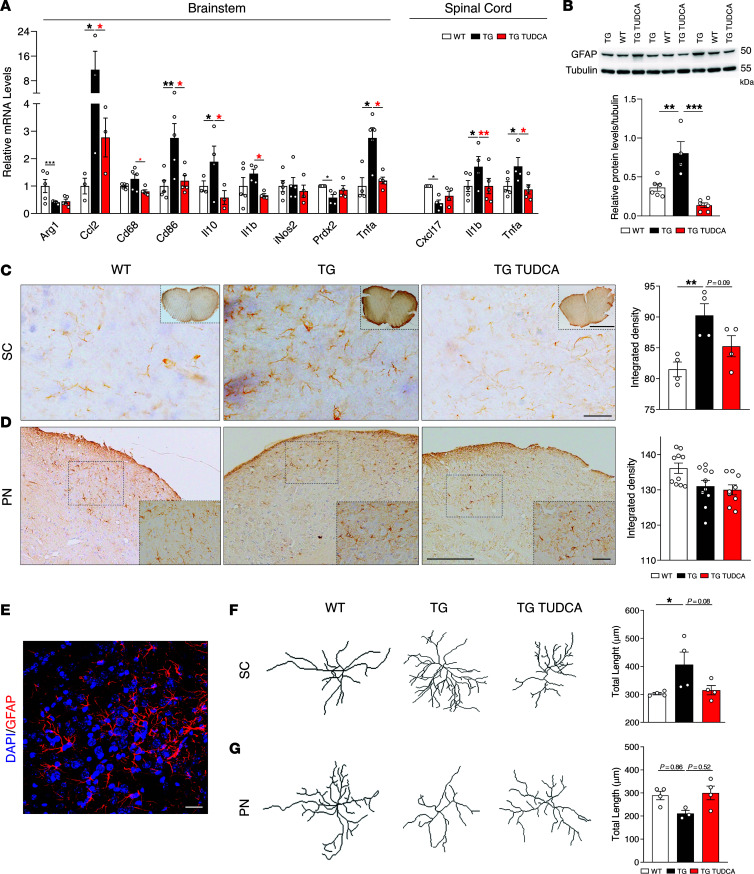
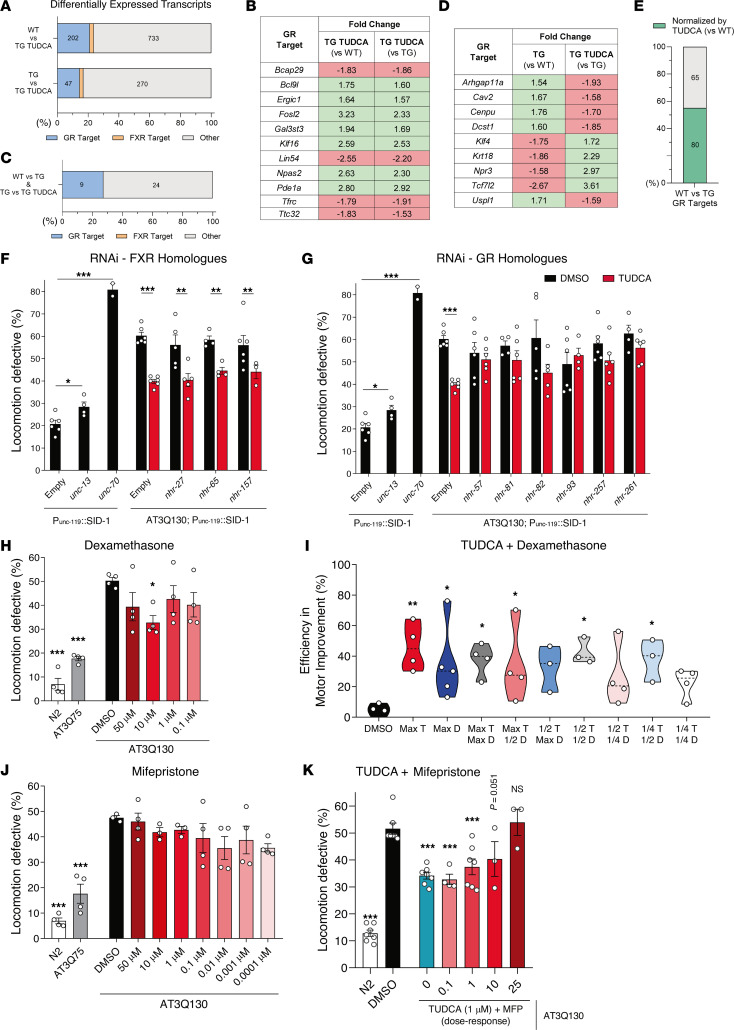
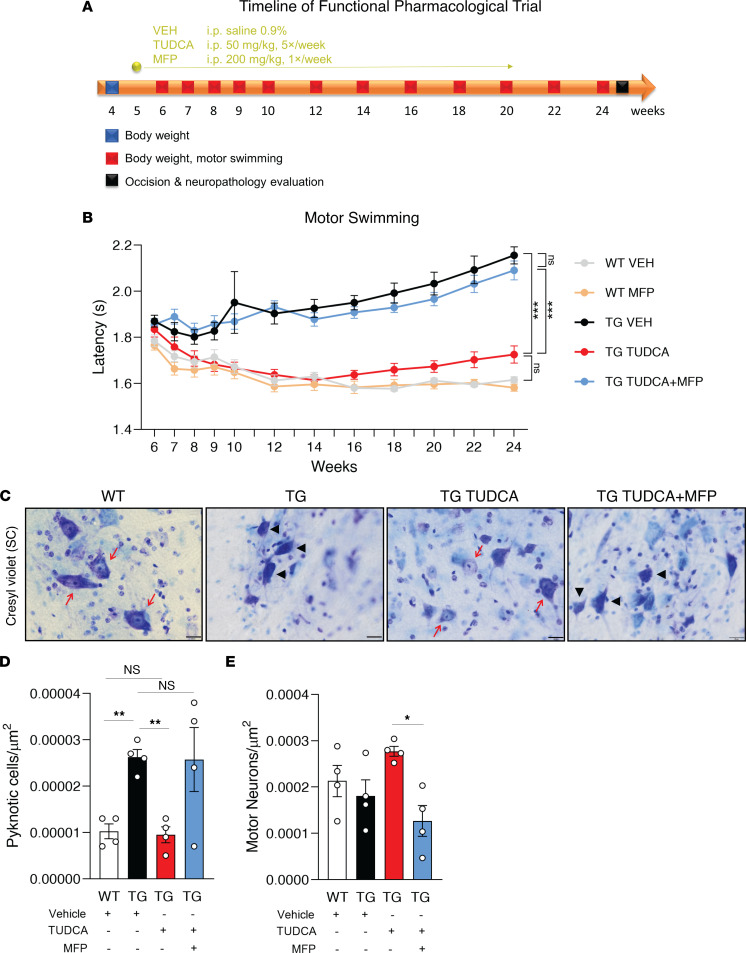
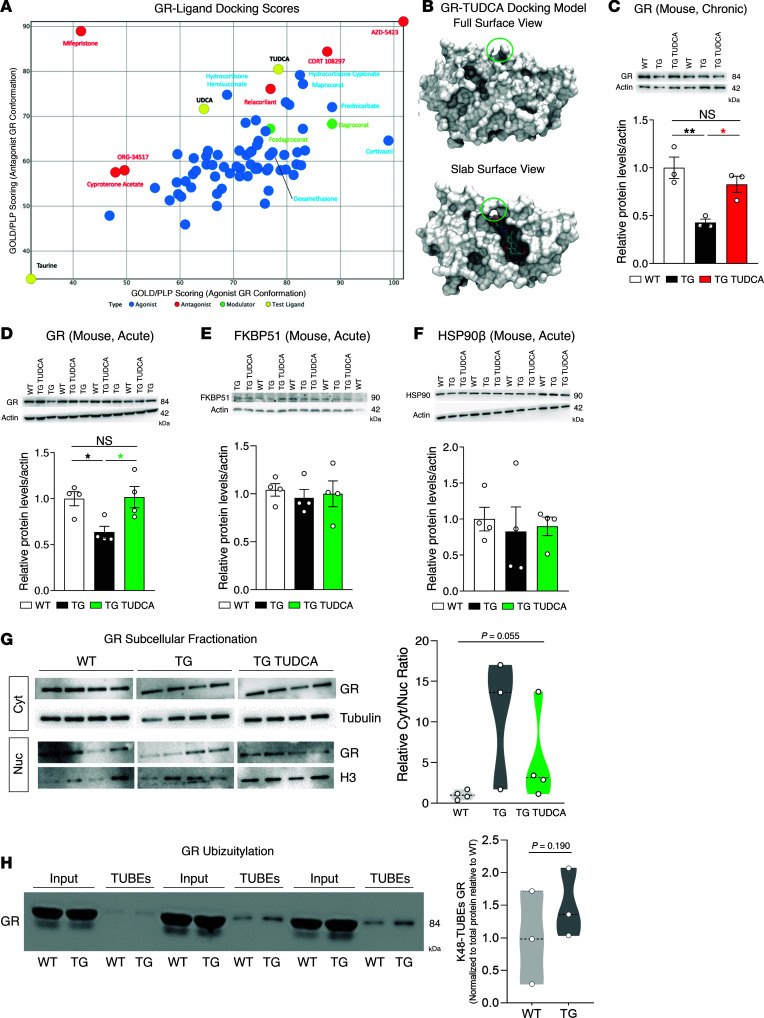
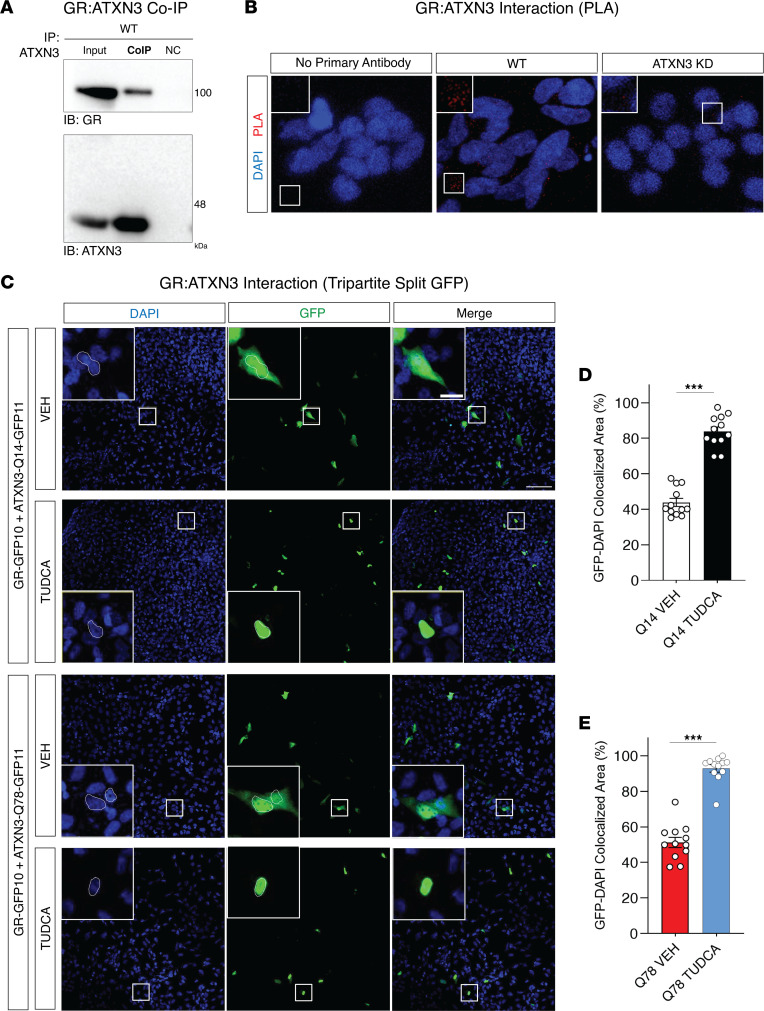
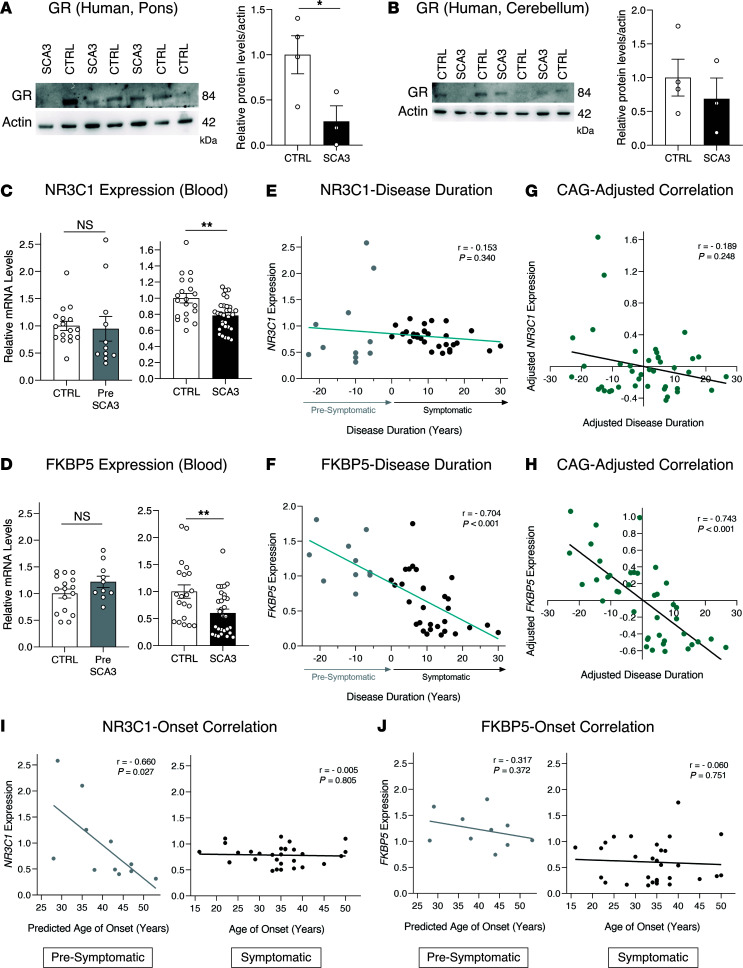
Spinocerebellar ataxia type 3 (SCA3) is an adult-onset neurodegenerative disease caused by a polyglutamine expansion in the ataxin-3 (ATXN3) gene. No effective treatment is available for this disorder, other than symptom-directed approaches. Bile acids have shown therapeutic efficacy in neurodegenerative disease models. Here, we pinpointed tauroursodeoxycholic acid (TUDCA) as an efficient therapeutic, improving the motor and neuropathological phenotype of SCA3 nematode and mouse models. Surprisingly, transcriptomic and functional in vivo data showed that TUDCA acts in neuronal tissue through the glucocorticoid receptor (GR), but independently of its canonical receptor, the farnesoid X receptor (FXR). TUDCA was predicted to bind to the GR, in a similar fashion to corticosteroid molecules. GR levels were decreased in disease-affected brain regions, likely due to increased protein degradation as a consequence of ATXN3 dysfunction being restored by TUDCA treatment. Analysis of a SCA3 clinical cohort showed intriguing correlations between the peripheral expression of GR and the predicted age at disease onset in presymptomatic subjects and FKBP5 expression with disease progression, suggesting this pathway as a potential source of biomarkers for future study. We have established a novel in vivo mechanism for the neuroprotective effects of TUDCA in SCA3 and propose this readily available drug for clinical trials in SCA3 patients.

Keywords: Drug therapy; Genetic diseases; Molecular biology; Neuroscience; Therapeutics.


Figures

Figure 1
Figure 1. Impact of BAs on the motor phenotype of SCA3 nematode and mouse models.
(A) Percentage of improvement in locomotion-defective animals of a representative set of BAs. The predetermined optimal concentration for each compound was used. A total of 3-to-4 independent experiments were performed, for a total of 150–200 animals assayed. (B) Dose-response evaluation of the effect of TUDCA in reducing the percentage of locomotion-defective AT3Q130 animals. AT3Q75 animals were used as a TG non-motor-defective control, and 1% DMSO was used as the negative control for vehicle administration. A total of 3-to-4 independent experiments with 150–200 animals were performed. (C) Kaplan-Meyer curve of the survival of AT3Q130 nematodes treated with TUDCA. The daf-2 and daf-16 strains were used as long and short-lived controls, respectively. A total of 300 animals per condition were tested along 3 independent experiments. (D) Evaluation of the time taken for a mouse to cross a 12 mm square beam, with TUDCA having a positive effect. (E) Assessment of the time taken for a mouse to swim through a 60 cm water path. TUDCA consistently improved this time throughout the trial. #, no difference between WT and TG TUDCA animals. (F) Gait quality was improved in treated animals. (G) The strength of an animal to grab a grid was used to evaluate forelimb strength. TUDCA had a positive effect in some time points. (H) Qualitative assessment of limb clasping revealed a significant improvement of TG TUDCA-treated animals in comparison with TG. Black *, WT versus TG; red *, TG versus TG TUDCA. A total of 14–17 mice per condition was used in all tests and evaluated in the indicated weeks of age. 1-way ANOVA (B, D, and E). Kaplan Meier and Cox regression (C). κ2 test (FH). * P < 0.05, ** P < 0.01, *** P < 0.001.
Figure 2
Figure 2. TUDCA reduces neuropathology in CMVMJD135 mice.
(A) IHC (and respective quantification) of ChAT-positive cells in the cervical and (B) thoracic regions of the ventral horn of the spinal cord. (C) Pyknotic cells per area were counted after cresyl violet staining in the pontine nuclei and (D) DCN of mice. All analyses were performed in 34-week-old mouse tissue in a minimum of 3 animals per group. 1-Way ANOVA, * P < 0.05, ** P < 0.01, *** P < 0.001. Scale bars: 200 μm (A and B), 50 μm (C and D).
Figure 3
Figure 3. TUDCA reduces neuroinflammation in CMVMJD135 mice.
(A) RT-qPCR of brainstem and spinal cord tissue of 34-week-old mice, with expression values normalized for β-2-microglobumin (B2m). A total of 4–6 biological replicates were evaluated. (B) Western blot analysis of glial fibrillary acidic protein (GFAP) levels, normalized to α-tubulin, in the brainstem of 34-week-old mice. A total of 4–6 biological replicates was tested. (C) IHC analysis of GFAP staining (and respective quantification) in the spinal cord (SC) and (D) pontine nuclei of 34-week-old mice. A total of 4–6 animals was analyzed per group. Scale bars: 50 μm (higher magnification) and 200 μm (lower magnification) (C and D). (E) Representative microphotograph of GFAP staining (nuclei stained by DAPI) in the spinal cord of WT mice. Scale bar: 25μm. (F) Representative image of skeletonized astrocytes for morphological evaluation of process complexity in the cervical spinal cord (SC) and (G) pontine nuclei of 34-week-old mice. A minimum number of 3 animals was used per condition, with 15–32 astrocytes being analyzed per group. Black *, WT versus TG; red *, TG versus TG TUDCA. 1-Way ANOVA, * P < 0.05, ** P < 0.01, *** P < 0.001.
Figure 4
Figure 4. The effect of TUDCA is FXR-independent and GR-dependent.
(A) Number of differentially expressed protein-coding genes when comparing WT and TUDCA mice, and TG and TG TUDCA mice, in the RNA-Seq analysis. The total number of genes corresponds to 100% (xx axis), and the absolute number of genes is indicated inside each bar. The number of differentially expressed FXR targets is 25 and 8 in the WT versus TG TUDCA and TG versus TG TUDCA comparisons, respectively. (B) Fold change of GR target genes that are simultaneously differentially expressed in WT versus TG TUDCA and TG versus TG TUDCA comparisons. (C) Number of genes that are simultaneously differentially expressed in WT versus TG and TG versus TG TUDCA comparisons. No FXR target genes were observed. (D) Fold change of GR target genes that are simultaneously differentially expressed in WT versus TG and TG versus TG TUDCA comparisons. (E) GR target genes that are differentially expressed in the WT versus TG comparison, but not in the WT versus TG TUDCA comparison. (F) Evaluation of the effect of TUDCA treatment in AT3Q130 animals crossed with the RNAi-sensitive strain LC108 upon simultaneous silencing of FXR orthologue genes and treatment with TUDCA. The silencing of all 3 genes did not the change the positive effect of TUDCA. unc-13 and unc-70 were silenced as controls for RNAi efficiency. (G) The effect of TUDCA after silencing the GR orthologues showed that the compound’s effect was lost. (H) Dose-response assay for the effects of dexamethasone in the locomotion of AT3Q130 animals. (I) Percentage of improvement in locomotion defective animals (compared with N2 nematodes) of several combinations of both TUDCA (T) with dexamethasone (D). Max T, 1 μM; 1/2 T, 0.5 μM; 1/4 T, 0.25 μM; Max D, 10 μM; 1/2 D, 5 μM; 1/4 D, 2.5 μM. (J) Dose-response evaluation of the effect of mifepristone in reducing the percentage of locomotion-defective AT3Q130 animals. (K) Dose-response assay for the effects of TUDCA (1 μM) in combination with increasing concentrations of the GR antagonist mifepristone (MFP), in the locomotion of AT3Q130 animals. The 1% DMSO condition was used as the negative control for drug/vehicle. (FK) 150–300 animals were assayed across 3–7 independent experiments. AT3Q75 animals were used as a TG non-motor-defective control, and 1% DMSO was used as the negative control drug. 1-Way ANOVA, * P < 0.05, ** P < 0.01, *** P < 0.001.
Figure 5
Figure 5. The positive effect of TUDCA in motor and neuropathological phenotypes of SCA3 mice is fully GR-dependent.
(A) Schematic representation of the timeline of the preclinical trial with TUDCA and mifepristone cotreatment. Colored squares indicate performed tests at the indicated timepoints. (B) Assessment of the time taken for a mouse to swim through a 60 cm water path. TUDCA fully rescued the motor defects of SCA3 mice and its effect was fully abolished when coadministered with the GR antagonist mifepristone. A total of 11–15 mice per condition were assessed continuously in each time point. (C) Pyknotic cells and motor neurons per area were counted after cresyl violet staining in the spinal cord of treated 24-week-old mice, in a total of 4 animals per group. Black arrowheads show pyknotic cells, while red arrows show healthy cells. Scale bar: 20 μm. (D) Quantification of pyknotic cell and (E) motor neuron number per area. * P < 0.05, ** P < 0.01, *** P < 0.001. MFP, mifepristone; SC, spinal cord; TUDCA, tauroursodeoxycholic acid; VEH, vehicle. 1-Way ANOVA, * P < 0.05, ** P < 0.01, *** P < 0.001.
Figure 6
Figure 6. TUDCA promotes GR activity likely by preventing its degradation in CMVMJD135 mice.
(A) GOLD/PLP scoring values of TUDCA, UDCA, taurine, and the known GR-binders to both GR conformation models, grouped into known agonist, antagonist and modulator models. (B) Representation of GR interaction with TUDCA in the agonist binding conformation. The left figure represents the full view of the surface of the protein, while the right figure represents a slab view, with a crosssection along the surface of the protein to show the accommodation of TUDCA inside the protein cavity. (C) Western blot analysis of GR levels, in the brainstem of 34 weeks-old mice. 3 animals per group were analyzed. (D) Western blot analysis of GR, (E) FKBP51 and (F) HSP90β protein levels in the brainstem of acutely treated mice. 4 animals per group were evaluated. Black *, WT versus TG; red *, TG versus chronic TG TUDCA; green *, TG versus acute TG TUDCA. (G) Western blot analysis of the GR in subcellular protein fractions, namely cytosolic (Cyt, normalized to tubulin) and nuclear (Nuc, normalized to H3). The relative cytosolic/nuclear ratio was determined by dividing the tubulin-normalized cytosolic GR levels by the H3-normalized nuclear GR levels. The molecular weight of each protein is: GR, 84 kDa; tubulin, 55 kDa; H3, 17 kDa. A total of 3-to-4 acutely treated mice were assessed. (H) Immunoblot for GR before (input) and after pulldown with tandem ubiquitin binding entities (TUBEs), in mixed protein extracts from the cerebellum and the brainstem. Three animals in 4 independent experiments were assessed and quantified. 1-Way ANOVA (CF). Kruskal Wallis H test (G) and Student’s t test (H). * P < 0.05, ** P < 0.01.
Figure 7
Figure 7. GR interacts with WT and mutant ATXN3, and is translocated to the nucleus upon TUDCA treatment.
(A) Immunoprecipitation followed by Western blot showed coimmunoprecipitation of GR with ATXN3 (rabbit anti-ATXN3, MJD1-1) from mouse brain tissue lysates. IB, immunoblotting done with antibody against either GR or ATXN3 (mouse anti-ATXN3, 1H9). IP, immunoprecipitation done with an antibody against ATXN3. NC, isotype control antibody of the same isotype as the primary antibodies to discern specific binding from nonspecific interactions. A 40% increase in image contrast was applied from the original blots. (B) Representative fluorescence microphotographs of SH-SY5Y cells following DAPI staining and a PLA of GR and ATXN3, in both WT and cells with shRNA-mediated knockdown (KD) of ATXN3 expression. The negative control represents absence of primary antibodies, and ATXN3 KD cells show a scarcer signal compared with WT cells, as expected. Scale bars, 50 μm. (C) Tripartite split-GFP system fluorescence in MRC5-SV cells expressing GFP1-9. Cells were transfected with GR fused with GFP10 and ATXN3 fused with GFP11 (14Q or 78Q) and treated with and TUDCA at 100 μM for 24 hours. Upon protein interaction, GFP10 and GFP11 assemble, spontaneously associate with GFP1-9, and fluorescence is emitted. Green fluorescence at 488 nm excitation (GFP), DAPI nuclear staining (blue). Scale bars: 100 μm and 20 μm (inset). (D) Quantification of the percentage of the cellular area with colocalization of both GFP and DAPI signal in Q14 and (E) Q78 expressing cells with vehicle or TUDCA treatment. Mann-Whitney U test, *** P < 0.001.
Figure 8
Figure 8. GR is a mechanistic target of TUDCA.
(A) Western blot analysis of the GR, normalized for actin, in the pons and (B) cerebellum of patients with SCA3. A total of 4 control and 3 patients with SCA3 were evaluated. (C) RT-qPCR analysis of the expression levels of GR (NR3C1) or (D) FKBP5 in the blood of patients with presymptomatic SCA3 (PreSCA3) and symptomatic SCA3 (SCA3), when compared the respective control groups. (E) Pearson’s correlation between the predicted time to disease onset (in patients who are presymptomatic) or disease duration (in patients who are symptomatic) with peripheral GR or (F) FKBP5 expression. (G) Partial correlation between the predicted time to disease onset (in patients who are presymptomatic) or disease duration (in patients who are symptomatic) with peripheral GR or (H) FBKP5 expression, when adjusting for the number of CAG repeats. (I) Pearson’s correlation between the predicted age of onset (in patients who are presymptomatic) or age of onset (in patients who are symptomatic) with peripheral GR or (J) FKBP5 expression. A total of 11 patients withPreSCA3 (with 17 CTRL) and 30 patients with SCA3 (with 20 CTRL) were assessed. Student’s t test or Mann-Whitney U test for (AD), Pearson Correlation Coefficient (r) was applied to (EJ). * P < 0.05, ** P < 0.01.

Similar articles

Cited by

References

    1. Chin JH, Vora N. The global burden of neurologic diseases. Neurology. 2014;83(4):349–351. doi: 10.1212/WNL.0000000000000610. - DOI - PMC - PubMed
    1. Group GBDNDC. Global, regional, and national burden of neurological disorders during 1990-2015: a systematic analysis for the Global Burden of Disease Study 2015. Lancet Neurol. 2017;16(11):877–897. doi: 10.1016/S1474-4422(17)30299-5. - DOI - PMC - PubMed
    1. Piguet F, et al. Clinical gene therapy for neurodegenerative diseases: past, present, and future. Hum Gene Ther. 2017;28(11):988–1003. doi: 10.1089/hum.2017.160. - DOI - PubMed
    1. O’Connor DM, Boulis NM. Gene therapy for neurodegenerative diseases. Trends Mol Med. 2015;21(8):504–512. doi: 10.1016/j.molmed.2015.06.001. - DOI - PubMed
    1. Clayton EW. A genetically augmented future. Nature. 2018;564(7735):S9. doi: 10.1038/d41586-018-07642-0. - DOI - PubMed

Substances