. 2024 Jan 16;134(5):e176943.
doi: 10.1172/JCI176943.

A membrane-associated phosphoswitch in Rad controls adrenergic regulation of cardiac calcium channels

Affiliations

A membrane-associated phosphoswitch in Rad controls adrenergic regulation of cardiac calcium channels

Arianne Papa et al. J Clin Invest. .

Abstract

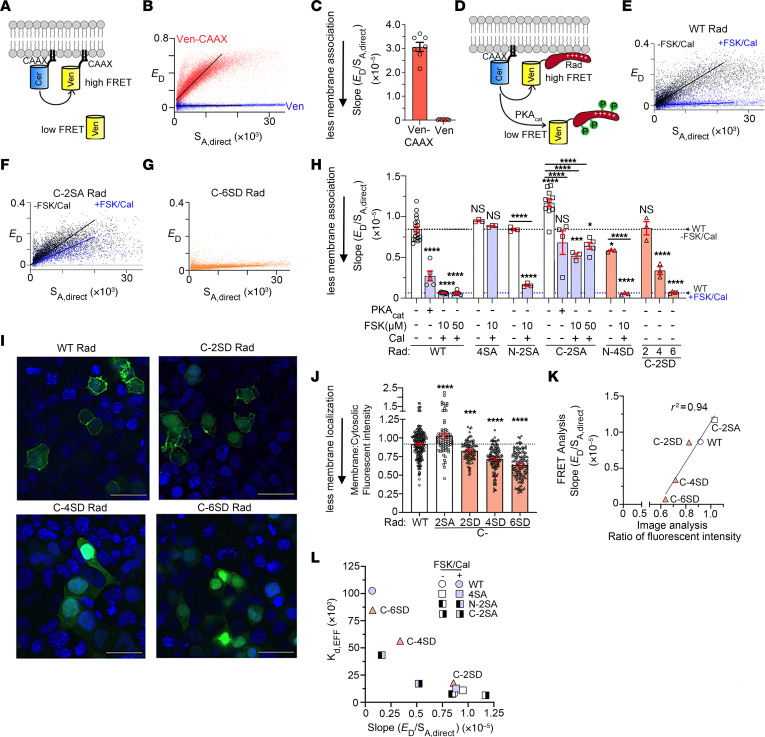
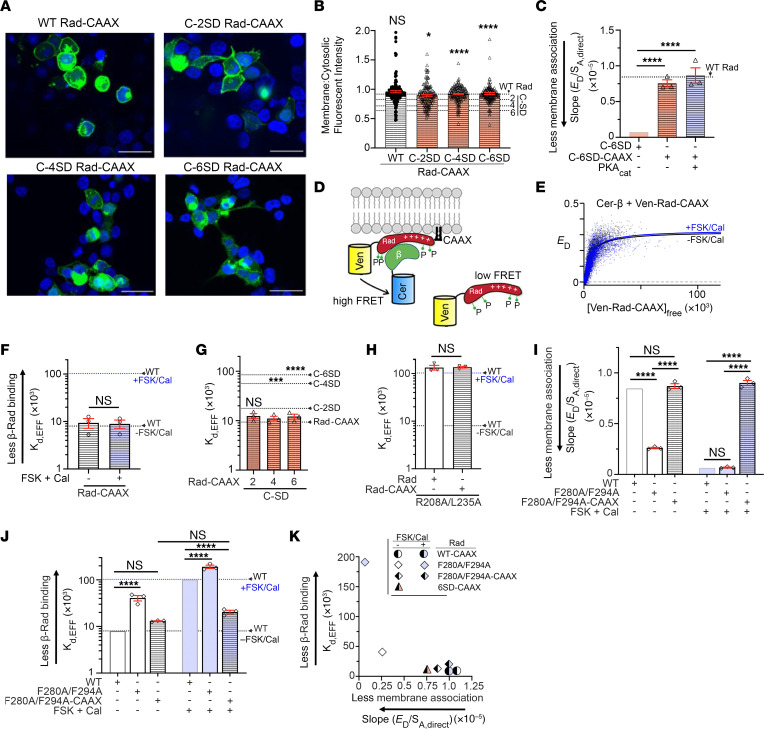
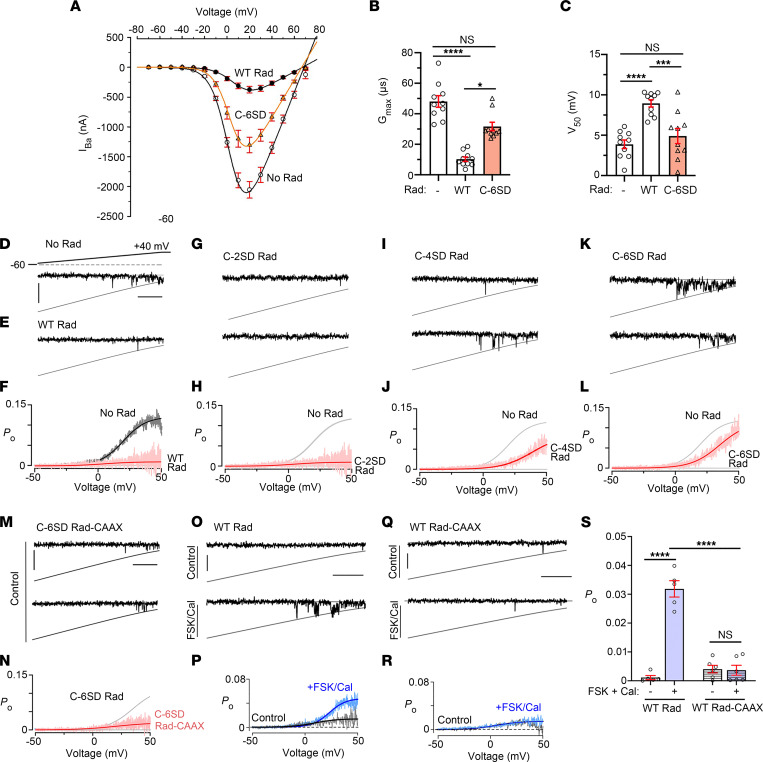
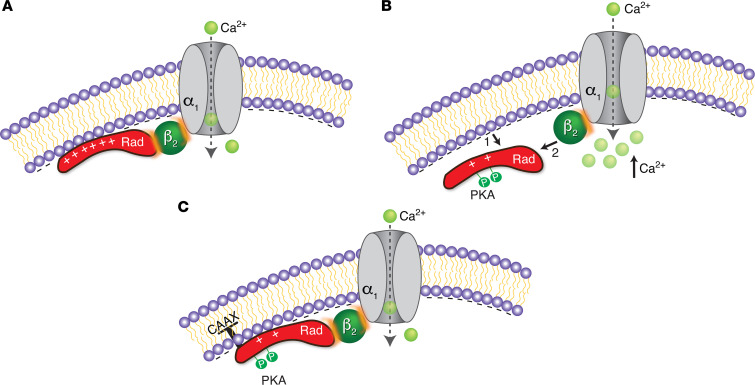
The ability to fight or flee from a threat relies on an acute adrenergic surge that augments cardiac output, which is dependent on increased cardiac contractility and heart rate. This cardiac response depends on β-adrenergic-initiated reversal of the small RGK G protein Rad-mediated inhibition of voltage-gated calcium channels (CaV) acting through the Cavβ subunit. Here, we investigate how Rad couples phosphorylation to augmented Ca2+ influx and increased cardiac contraction. We show that reversal required phosphorylation of Ser272 and Ser300 within Rad's polybasic, hydrophobic C-terminal domain (CTD). Phosphorylation of Ser25 and Ser38 in Rad's N-terminal domain (NTD) alone was ineffective. Phosphorylation of Ser272 and Ser300 or the addition of 4 Asp residues to the CTD reduced Rad's association with the negatively charged, cytoplasmic plasmalemmal surface and with CaVβ, even in the absence of CaVα, measured here by FRET. Addition of a posttranslationally prenylated CAAX motif to Rad's C-terminus, which constitutively tethers Rad to the membrane, prevented the physiological and biochemical effects of both phosphorylation and Asp substitution. Thus, dissociation of Rad from the sarcolemma, and consequently from CaVβ, is sufficient for sympathetic upregulation of Ca2+ currents.

Keywords: Calcium channels; Cardiology; Cardiovascular disease; Excitation contraction coupling.


Figures

Figure 1
Figure 1. Extent of adrenergic regulation of Ca2+ channels is independent of a specific of CaVβ subunit isoform.
(A) Schematic depicting CaVβ domains. NT, N-terminus; CT, C-terminus; Src homology 3 (SH3) domain, a conserved guanylate kinase (GK) domain, and a variable and flexible HOOK region that connects them. In β2-null mice, a frame-shift insertion causes an early termination at the end of the SH3 domain. (B) Anti-β2 and anti-FLAG immunoblots. (C) Anti-FLAG and anti-β2 immunofluorescence of nontransgenic WT and transgenic (TG) FLAG-β–expressing cardiomyocytes. Nuclear staining with DAPI. Scale bars: 50 μm. Representative of 3 similar experiments. Insets, ×4 enlargement to show striated pattern of expression. (DG) Exemplar current-voltage relationships of Ca2+ channels in the absence (black trace) and presence of forskolin (blue trace). Insets: Exemplar whole-cell CaV1.2 currents. Pulses from –60 mV to +10 mV before (black traces) and 3 minutes after (blue traces) forskolin. Horizontal scale bars = 50 ms, vertical scale bars = 10 pA/pF. (H) Fold change at –20 mV in peak current caused by forskolin (FSK). Mean ± SEM. P = not significant (NS) by 1-way ANOVA; n = 13, 16, 14, and 17 cardiomyocytes from 7, 3, 4, and 6 mice. TG, transgenic. (I) Boltzmann function parameter, V50, before and after FSK. Mean ± SEM. Statistical analysis among non-TG, β2, β3, and β4: P < 0.0001 by 1-way ANOVA; ***P < 0.001 by Šidák’s multiple-comparison test. Statistical analysis of no FSK versus FSK: ****P < 0.0001 by paired, 2-tailed t test. (J) Field stimulation–induced change in sarcomere contraction. ****P < 0.0001 by paired, 2-tailed t test. (K) Forskolin-induced fold change in sarcomere length. Mean ± SEM. n = 20, 20, 28, and 19 from 3, 3, 3, and 3 mice, from left to right. P = not significant by 1-way ANOVA.
Figure 2
Figure 2. Effects of phosphorylation of Venus-Rad on its binding to Cerulean-β2B, as monitored by FRET.
(A) Schematics of the FRET pairs, Cerulean (Cer)-β2B with Venus (Ven)-WT Rad, and Ven-4SA, Ven-N-2SA, and Ven-C-2SA Rad. Small circles are phosphorylation sites. 4SA: Ala substitutions of Ser25, Ser38, Ser272, and Ser300; N-2SA: Ala substitutions of Ser25 and Ser38; C-2SA: Ala substitutions of Ser272 and Ser300. (B) FRET efficiency (ED) between Ven-conjugated WT or Ven-conjugated mutant Rad and Cer-β2B is plotted against the free concentration of Ven-Rad, in the absence (control, black) and the presence (blue) of 10 μM forskolin (FSK) and 100 nM calyculin A (Cal). The 1:1 binding isotherms are fit to the data (solid lines). The dashed lines are fits to the data from FSK/Cal–treated WT Rad cells. (C and D) Graphs summarizing mean Kd,EFF for the binding of β2B and WT Rad, 4SA Rad, N-2SA Rad, and C-2SA Rad, in absence and presence of PKAcat, FSK, and Cal. Error bars are SEM. The significance of the differences versus no treatment are P < 0.0001 by 1-way ANOVA; ***P < 0.001, ****P < 0.0001 by Šidák’s multiple-comparison test. For C, n = 8, 8, 36, 6, 6, and 14 from left to right. For D, WT data are same as C, starting at 4SA Rad: n = 12, 3, 3, 3, 6, 6, 6, and 6 from left to right.
Figure 3
Figure 3. Effects in ventricular cardiomyocytes of removing sites for PKA phosphorylation from the Rad NTD on β-adrenergic agonist augmentation of CaV1.2 currents.
(A and B) Ba2+ currents elicited by voltage ramp every 3 seconds in WT and N-2SA Rad ventricular myocytes, with black traces obtained before and blue traces obtained after isoproterenol or isoproterenol plus calyculin A. Scale bars: 3 pA/pF (vertical) and 50 ms (horizontal). (C) Graph of fold change in Ba2+ conductance after isoproterenol (Iso) or isoproterenol plus calyculin (Iso + Cal) to Ba2+ conductance before treatment versus voltage of cardiomyocytes isolated from WT and N-2SA Rad mice. Mean ± SEM. For isoproterenol: WT: 51 cells, 7 mice, N-2SA: 112 cells, 11 mice; for calyculin: WT: 38 cells, 3 mice, N-2SA: 43 cells, 5 mice. (D) Fold change in peak current at –20 mV and Gmax. Mean ± SEM. Same sample size as in C. P < 0.0001 by 1-way ANOVA; **P < 0.001 by Šidák’s multiple-comparison test. (E) Boltzmann’s function parameter, V50, before and after isoproterenol, or isoproterenol and calyculin A. P < 0.0001 by 1-way ANOVA; *P < 0.05, ****P < 0.0001 by Šidák’s multiple-comparison test.
Figure 4
Figure 4. Effects on Venus-Rad binding to Cerulean-β2B by the insertion of negatively charged Asp residues in the N- and C-termini of Rad.
(A) Protein structure prediction with AlphaFold of human Rad (P55042) (60, 61). (B) Protein sequences of N-terminus and C-terminus of Rad, showing phosphorylated residues (highlighted yellow) and residues substituted with Asp (red font). Arrowheads mark hydrophobic residues in the basic-hydrophobic motif of Rad. (CE) FRET efficiency (ED) between Ven-Rad mutants and Cer-β2B is plotted against the free concentration of Ven-C-2SD, C-4SD, and C-6SD Rad. The red line fits a 1:1 binding isotherm for C-2SD, C-4SD, and C-6SD Rad. The black and blue lines are the 1:1 binding isotherm for WT-Rad in the absence and presence of FSK + Cal (same as Figure 2B). (F) Graph summarizing mean Kd,EFF for the binding of β2B and WT and mutant Rad. Error bars are SEM. Black and blue dashed lines are mean values of WT Rad without and with FSK + Cal (from Figure 2). P < 0.0001 by 1-way ANOVA; ****P < 0.0001 compared with WT Rad without FSK + Cal by Dunnett’s multiple-comparison test. n = 3, 7, 6, 6, 3, and 3 from left to right. (G) Table showing changes in charge induced by either treatment with forskolin (FSK) and calyculin (Cal) or substitution of Asp residues in full-length Rad, in the N-terminal domain of Rad (NTD, residues 1–45), or in the C-terminal domain of Rad (CTD, residues 251–307), calculated using https://protcalc.sourceforge.net The change in charge on phosphorylated Ser residues by the addition of a phosphate group is –1.96 at pH 7.2, and –1.86 at pH 6.6, assuming pKa2 = 5.8 (62).
Figure 5
Figure 5. Effects on Venus-Rad binding to the membrane of phosphorylation and insertion of negatively charged Asp residues.
(A) FRET biosensor for membrane binding. Cerulean and Venus fluorescent proteins were conjugated with CAAX. (B) FRET efficiency (ED) is plotted against SA,direct, the fluorescence intensity of the acceptor (Venus), directly excited. Lines are linear slope using least-squares fit. (C) Slope of ED between Cer-CAAX and Ven-CAAX or Ven alone. Mean ± SEM. ****P < 0.0001 by 2-tailed, unpaired t test. n = 7. (D) Shown are Cer-CAAX and WT Rad or mutant Rad conjugated to the Venus fluorescent protein. High FRET signal is detected when both proteins are colocalized at the membrane. (E) ED is plotted against SA,direct of Ven-WT Rad, either untreated or treated with 10 μM forskolin plus 100 nM calyculin A. (F) As in E, with C-2SA Rad. (G) As in E, with C-6SD Rad. (H) FRET binding studies of Ven-conjugated proteins to membrane. Mean ± SEM. Statistics for comparison to control column (WT without PKA, FSK or Cal). P < 0.0001 by 1-way ANOVA; *P < 0.05, ***P < 0.001, ****P < 0.0001 by Dunnett’s test. n = 20, 5, 9, 6, 3, 3, 3, 3, 11, 4, 3, 5, 3, 3, and 4 from left to right. (I) Fluorescence of GFP-tagged WT and mutant Rad expressed in HEK293 cells. Nuclear staining with DAPI. Scale bars: 32 μm. (J) Ratio of membrane and cytosolic fluorescence intensities for WT and mutant Rad protein. Mean ± SEM. P < 0.0001 by 1-way ANOVA; ***P < 0.001, ****P < 0.0001 by Šidák’s test compared with WT Rad. n = 223, 84, 103, 135, and 143 cells from left to right. (K) Relationship between fluorescence image analysis and FRET analysis. Line was fit by linear regression. (L) Correlation between Rad membrane association and β-Rad binding without and with 10 μM forskolin and 100 nM calyculin for WT Rad and Rad mutants 4SA, N-2SA, C-2SA, C-2SD, C-4SD, and C-6SD.
Figure 6
Figure 6. Effects of tethering of Rad to the plasma membrane via CAAX motif.
(A) Fluorescence of GFP-tagged WT and mutant Rad-CAAX proteins. Nuclear staining with DAPI. Scale bars: 32 μm. (B) Ratio of membrane and cytosolic fluorescence intensities. Mean ± SEM. Dashed lines are mean values of WT Rad, and C-2SD, C-4SD, and C-6SD (from Figure 5). Statistical comparisons to non–CAAX-conjugated constructs. P < 0.0001 by 1-way ANOVA; *P < 0.05, ****P < 0.0001 by Šidák’s test. n = 183, 167, 180, and 175 cells from left to right. (C) FRET binding studies of Ven-conjugated C-6SD proteins to membrane. C-6SD bar is same as in Figure 5H. Dotted line is value for WT Rad (from Figure 5H). Mean ± SEM. P < 0.0001 by 1-way ANOVA; ****P < 0.0001 by Dunnett’s test. n = 4, 3, and 3 from left to right. (D) Schematic of Cer-β and Ven-Rad-CAAX. (E) FRET efficiency between Ven-Rad-CAAX and Cer-β is plotted against the total concentration of Ven-Rad-CAAX. (F) Mean Kd,EFF for binding of Rad-CAAX to β. Error bars are SEM. Differences not significant by 2-tailed, unpaired t test. n = 3 and 3 from left to right. (G) Mean Kd,EFF for binding of CAAX-conjugated mutant Rad proteins to β. Error bars are SEM. Statistical comparisons to non–CAAX-conjugated constructs. P < 0.0001 by 1-way ANOVA; ***P < 0.001, ****P < 0.0001 by Šidák’s test. (H) Mean Kd,EFF for binding of β to R208A/L235A Rad or R208A/L235A-CAAX Rad. Differences are not significant by 2-tailed, unpaired t test. (I) As in C, with F280A/F294A. WT and WT + FSK/Cal are the same data as in Figure 5H. Error bars are SEM. P < 0.0001 by 1-way ANOVA; ****P < 0.0001 by Šidák’s test. n = 20, 3, 3, 9, 3, and 3 from left to right. (J) Mean Kd,EFF for binding of β to F280A/F294A Rad or F280A/F294A-CAAX Rad. Error bars are SEM. P < 0.0001 by 1-way ANOVA; ****P < 0.0001 by Šidák’s test. n = 36, 3, 3, 14, 3, and 3. (K) Correlation between Rad membrane association and β-Rad binding.
Figure 7
Figure 7. Effects of insertion of negatively charged Asp residues or CAAX in C-terminus of Rad on electrophysiological properties of CaV1.2 channels.
(A) Current-voltage (I-V) curves of Ba2+ currents (IBa) in oocytes expressing α1C, β2B, α2δ, and no Rad, WT Rad, or C-6SD Rad. Net IBa values (mean ± SEM), obtained after subtraction of current in the presence of Cd2+, are shown. The solid lines are I-V curves drawn with the Boltzmann equation (see Supplemental Table 1). (B) Graph of whole-cell maximal Ba2+ conductance, Gmax. Bars show mean ± SEM. n = 10 oocytes in each group. P < 0.0001 by Kruskal-Wallis test; *P < 0.05, ****P < 0.0001 by Dunn’s multiple-comparison test. (C) Graph of V50, P < 0.0001 by 1-way ANOVA; ***P < 0.001, ****P < 0.0001 by Tukey’s multiple-comparison test. NS, P > 0.05. (D, E, G, I, and K) Single-channel Ba2+ currents are shown. Openings are downward deflections to the open level (slanted gray curves). Horizontal bar = 25 ms; vertical bar = 1 pA. (F, H, J, and L) Mean Po versus voltage relationship. n = 5 for all groups. Black and red lines are Boltzmann fits. (M) Single-channel Ba2+ currents for CaV1.2 channels coexpressed with C-6SD-CAAX Rad. (N) Mean PO versus voltage relationship. n = 5 cells. Solid lines are Boltzmann fits. Horizontal bar = 25 ms; vertical bar = 1 pA. (O and Q) Single-channel Ba2+ currents are shown for CaV1.2 channels coexpressed with WT Rad or WT Rad-CAAX in the absence or presence of FSK and Cal preincubated for 5 minutes. Horizontal bar = 25 ms; vertical bar = 1 pA. (P and R) Mean PO versus voltage relationship. n = 5 cells. Solid lines are Boltzmann fits. (S) Graph of PO for single-channel data in O and Q. Mean ± SEM. P < 0.0001 by 1-way ANOVA; ****P < 0.0001 by Tukey’s multiple-comparison test.
Figure 8
Figure 8. Schematics of role of membrane affinity and interaction of Rad and CaVβ in β-adrenergic regulation of CaV1.2.
(A) CaVβ is close to the membrane because it is bound to CaVα, a membrane-embedded channel protein. In the basal state, the binding of Rad and CaVβ (and consequent channel inhibition) is promoted by the association of positively charged Rad with the negatively charged plasma membrane. Since the intrinsic affinity of Rad for β is low, the binding of Rad to β depends on the compensating, high local concentration of Rad at the membrane. Rad binding to β leads to inhibition of Ca2+ channels. (B) Adrenergic stimulation causes PKA activation and phosphorylation of the C-terminus of Rad, which decreases the net positive charge of the C-terminus of Rad. This change in charge disrupts Rad’s attachment to the membrane (arrow 1), thereby diluting it and favoring its dissociation from CaVβ (arrow 2). Rad-less Ca2+ channels have increased open probability compared with Rad-bound channels. (C) Rad is constitutively attached to the membrane via appending the CAAX motif to its C-terminus. Despite the change in charge induced by PKA phosphorylation of Rad, the CAAX motif prevents Rad’s detachment from the membrane, and thus the binding of Rad to CaVβ is preserved and the Ca2+ channel remains inhibited.

References

    1. Bers DM. Cardiac excitation-contraction coupling. Nature. 2002;415(6868):198–205. doi: 10.1038/415198a. - DOI - PubMed
    1. Papa A, et al. Rad regulation of CaV1.2 channels controls cardiac fight-or-flight response. Nat Cardiovasc Res. 2022;1(11):1022–1038. doi: 10.1038/s44161-022-00157-y. - DOI - PMC - PubMed
    1. Kamp TJ, Hell JW. Regulation of cardiac L-type calcium channels by protein kinase A and protein kinase C. Circ Res. 2000;87(12):1095–1102. doi: 10.1161/01.RES.87.12.1095. - DOI - PubMed
    1. Weiss S, et al. Regulation of cardiac L-type Ca2+ channel CaV1.2 via the β-adrenergic-cAMP-protein kinase A pathway: old dogmas, advances, and new uncertainties. Circ Res. 2013;113(5):617–631. doi: 10.1161/CIRCRESAHA.113.301781. - DOI - PubMed
    1. Wang X, Tsien RW. Suspect that modulates the heartbeat is ensnared. Nature. 2020;577(7792):624–626. doi: 10.1038/d41586-020-00096-3. - DOI - PubMed

MeSH terms