. 2024 Jan 16;134(5):e175167.
doi: 10.1172/JCI175167.

Reversible synaptic adaptations in a subpopulation of murine hippocampal neurons following early-life seizures

Reversible synaptic adaptations in a subpopulation of murine hippocampal neurons following early-life seizures

Bo Xing et al. J Clin Invest. .

Abstract

Early-life seizures (ELSs) can cause permanent cognitive deficits and network hyperexcitability, but it is unclear whether ELSs induce persistent changes in specific neuronal populations and whether these changes can be targeted to mitigate network dysfunction. We used the targeted recombination of activated populations (TRAP) approach to genetically label neurons activated by kainate-induced ELSs in immature mice. The ELS-TRAPed neurons were mainly found in hippocampal CA1, remained uniquely susceptible to reactivation by later-life seizures, and displayed sustained enhancement in α-amino-3-hydroxy-5-methyl-4-isoxazolepropionic acid (AMPA) receptor-mediated (AMPAR-mediated) excitatory synaptic transmission and inward rectification. ELS-TRAPed neurons, but not non-TRAPed surrounding neurons, exhibited enduring decreases in Gria2 mRNA, responsible for encoding the GluA2 subunit of the AMPARs. This was paralleled by decreased synaptic GluA2 protein expression and heightened phosphorylated GluA2 at Ser880 in dendrites, indicative of GluA2 internalization. Consistent with increased GluA2-lacking AMPARs, ELS-TRAPed neurons showed premature silent synapse depletion, impaired long-term potentiation, and impaired long-term depression. In vivo postseizure treatment with IEM-1460, an inhibitor of GluA2-lacking AMPARs, markedly mitigated ELS-induced changes in TRAPed neurons. These findings show that enduring modifications of AMPARs occur in a subpopulation of ELS-activated neurons, contributing to synaptic dysplasticity and network hyperexcitability, but are reversible with early IEM-1460 intervention.

Keywords: Epilepsy; Mouse models; Neuroscience; Seizures.


Conflict of interest statement

Conflict of interest: The authors have declared that no conflict of interest exists.

Figures

Figure 1
Figure 1. FosTRAP permanently and selectively labels ELS-activated cells.
(A) Schematic of experimental paradigm and TRAPing of neurons active during ELSs by paring 4-OHT and KA (2 mg/kg, i.p.). (B) Representative images of sagittal sections from FosTRAP mice injected with saline (Sal controls, upper) and KA (tonic-clonic seizures, lower). TRAPed cells expressing tdTomao (tdT, red) are enriched in the hippocampus. Scale bars: 500 μm. (CF) Light-sheet fluorescence microscopy (LSFM) of ELS-TRAPed mouse brain (see Supplemental Video 1). (C) LSFM images of sagittal maximum intensity projection across 10 planes (top) and 3D reconstruction of KA-treated TRAPed hemisphere (bottom). Scale bar: 1 mm. (D) Results from the brain mapping pipeline displaying cell counts from Sal- and KA-treated mice broken down into broad regions according to the Allen Brain Atlas hierarchy. (E) Cell counts from hippocampal subregions. (F) 3D reconstruction of all detected CA1 cells from a KA-treated TRAP hemisphere (top left). Cellular distribution along the dorsal-ventral (right) and medial-lateral axes (bottom) from KA-treated TRAP mice. CA1 tdT+ locations were quantified along the dorsal/ventral and lateral/medial axes. *P < 0.05, **P < 0.01 by linear regression (n = 4 Sal and 4 KA). (G) Representative confocal images of hippocampal CA1 region immunolabeled for NeuN showing ELS-TRAPed neurons. Images in G are shown again in Supplemental Figure 4A. Scale bars: 100 μm (top row and bottom left) and 50 μm (bottom right). (H) Quantitative confocal imaging analysis showed a higher density of TRAPed (tdT+) cells in the CA1 region from KA-treated mice compared with Sal controls. ***P < 0.001 by Mann-Whitney U test (n = 6 Sal and 11 KA). (I) Linear regression of tonic-clonic seizures duration and density of TRAPed cells (n = 10 mice) in CA1 region. The dashed lines define the 95% confidence interval. R2 = 0.6419, **P < 0.01. Data expressed as mean ± SEM.
Figure 2
Figure 2. ELS-TRAPed cells are preferentially reactivated by later life seizures (LLSs).
(A) Schematic illustration of the experimental procedure. At P10, mice were TRAPed by pairing 4-OHT with KA. At adulthood, both groups received a second seizure (LLS) using KA (15 mg/kg), and mice were immediately euthanized for c-Fos immunostaining. The experimental groups are referred to as KA (ELS) and Sal (con) for the P10 experiment, and KA (ELS) + KA (LLS) (red in BE) and Sal (con) + KA (LLS) (gray in BE) for the second seizure experiment at adulthood. (B) Time course of seizure score following LLS-KA treatment (left). The mice with prior ELS (n = 7 mice) showed significantly higher seizure severity, assessed by area under the curve (AUC), than those without ELS (n = 6 mice): 146.8 (95% CI 117.7 to 175.9) versus 95.42 (95% CI 71.76 to 119.1). *P < 0.05 by unpaired, 2-tailed t test. (C) Latency to LLSs showing mice with prior ELSs reaching the first behavioral seizure significantly faster than those without ELSs. *P < 0.05 by Mann-Whitney U test. (D) Cumulative seizure scores indicate that mice with ELS exhibit more severe seizures during LLS. *P < 0.05 by Mann-Whitney U test. (E) Schematic representation of distinct cell populations responding to ELS and LLS. (F) Example confocal images showing CA1 neurons labeled with tdT (ELS at P10) and c-Fos (LLS at adulthood) labeled with Alexa Fluor 488 reveal that c-Fos activation induced by LLS occurred primarily in previously activated tdT+ ELS-TRAPed neurons. Scale bar: 50 μm. (G) Quantification of tdT and tdT+ proportions among c-Fos+ cells (n = 6 mice). **P < 0.01 by Mann-Whitney U test. Data expressed as mean ± SEM.
Figure 3
Figure 3. Persistent increased excitatory synaptic transmission onto ELS-TRAPed cells after ELS.
(A) Schematic of slice recordings. (B) Left: Schematic of the tdT and tdT+ neurons in CA1. Right: DIC image of TRAPed neurons in CA1. Scale bar: 50 μm. (C) Examples of sEPSCs recorded from Sal (n = 11 neurons/6 mice), tdT (n = 16 neurons/8 mice), and tdT+ (n = 14 neurons/8 mice) neurons at P14–P16. (D) Mean frequency and (E) mean amplitude of sEPSCs from Sal, tdT, and tdT+ neurons at P14–P16. *P < 0.05, **P < 0.01 by 1-way ANOVA followed by Tukey’s test. (F) Examples of sEPSCs recorded from Sal, tdT, and tdT+ neurons at P28–P35. (G) Mean frequency and (H) mean amplitude of sEPSCs from Sal (n = 22 neurons/8 mice), tdT (n = 20 neurons/8 mice), and tdT+ (n = 15 neurons/8 mice) at P28–P35. *P < 0.05 by Kruskal-Wallis test followed by Dunn’s test. (I) Example EPSCs elicited at –60 mV and +40 mV from Sal, tdT, and tdT+ neurons at P14–P16 (top) and P28–P35 (bottom). (J) I-V curves of EPSCs from Sal (n = 9 neurons/4 mice), tdT (n = 9 neurons/4 mice), and tdT+ (n = 8 neurons/4 mice) at P14–P16 (top) and P28–P35 (bottom) (Sal, n = 14 neurons/5 mice; tdT, n = 13 neurons/5 mice; and tdT+, n = 14 neurons/5 mice). (K) Increased rectification of EPSCs was detected in tdT+ neurons at P14–P16 (left) and at P28–P35 (right). **P < 0.01, ***P < 0.001, ****P < 0.0001 by 1-way ANOVA followed by Tukey’s test. (L) Sample traces of AMPAR EPSCs at –60 mV and NMDAR EPSCs at +40 mV were recorded at P28–P35. (M) Quantification of the NMDA/AMPA ratio (Sal, n = 9 neurons/4 mice; tdT, n = 8 neurons/4 mice; tdT+, n = 8 neurons/4 mice). *P < 0.05, ***P < 0.001 by 1-way ANOVA followed by Tukey’s test. Data expressed as mean ± SEM.
Figure 4
Figure 4. RNAscope at P30 identifies cell type–specific transcriptional dysregulation of AMPAR subunits in TRAPed CA1 neurons after ELS.
(A) Confocal images of an example hippocampal slice showing colocalization of NeuN, TRAP (tdTomato+ [tdT+]), and mRNA expression of Gria1 and Gria2 using RNAscope. Scale bar: 20 μm. (B) Summary graph showing that tdT+ neurons (n = 136 cells) expressed a lower Gria2/Gria1 ratio compared with the surrounding tdT neurons (n = 148 cells). Cell-level data are color coded (1 color represents one animal) according to each biological sample and the sample-level means are compared between groups (n = 3 mice/group). P < 0.05 by 2-tailed, paired t test. Data expressed as mean ± SEM.
Figure 5
Figure 5. Altered protein expression and phosphorylation status of AMPAR subunits in the ELS-TRAPed neurons.
(A and B) Representative confocal images of CA1 radiatum from an ELS-TRAPed mouse. (A) Merged image showing the colocalization of TRAPed (red) dendrites, synapsin (synapse marker, purple), and GluA1 (green). (B) Synapsin and GluA1 merged image (left) shows the colocalization of synapsin and GluA1 from tdT+ and tdT dendrites. Right panels represent higher-magnification images of tdT+ (blue box) and tdT (yellow) dendrites. (C) Quantitative analysis showed no significant change in GluA1/synapsin colocalization in tdT+ dendrites compared to Sal and tdT by 2-way ANOVA (Sal, n = 7; ELS-TRAP, n =6). (D and E) Examples of confocal images of CA1 radiatum from an ELS-TRAPed mouse. (D) Merged image showing the colocalization of TRAP (red) dendrites, synapsin (purple), and GluA2 (Green). (E) Synapsin and GluA2 merged images show the colocalization of synapsin and GluA2 from tdT and tdT+ dendrites. Right panels represent higher-magnification images of tdT+ (blue box) and tdT (yellow box) dendrites. Scale bars (AE): 20 μm and 5 μm (zoomed-in images on right). (F) Quantification of GluA2/synapsin showing lower colocalization in tdT+ dendrites compared with Sal and tdT dendrites. **P < 0.01, ***P < 0.001 by 2-way ANOVA followed by Tukey’s test. Sal, n = 7 mice; ELS-TRAP, n = 6 mice. (GJ) Representative confocal images of CA1 depicting TRAPed cells expressing tdTomato (G) with MAP2 (dendrite markers, H) and pGluA2-S880 (I) staining. The merged image (J) shows the colocalization of tdT (blue box) and tdT+ (orange box) dendrites. High-magnification images (bottom right) and summary graph (K) demonstrate higher pGluA2-S880 levels in tdT+ dendrites. Scale bars: 20 μm (GJ) and 5 μm (K). Sal, n = 5; ELS-TRAP, n = 9. Cell-level data are color coded (1 color represents 1 animal), and the sample-level means from pooled cell-level data are compared between groups. *P < 0.05 by 1-way ANOVA followed by Tukey’s test. Data expressed as mean ± SEM.
Figure 6
Figure 6. Accelerated developmental loss of silent synapses at ELS-TRAPed CA1 neurons.
Representative traces and plots of minimally evoked EPSCs in Sal (black), tdT (blue), and tdT+ (red) CA1 neurons at P14–P16 (AD) and P28–P35 (EH). Quantification of the percentage of silent synapses at Sal, tdT, and tdT+ neurons. EPSCs elicited at –60 mV and +40 mV (D and H). There was a significantly lower percentage of silent synapses at P14–P16 (Sal, n = 7 from 3 mice; tdT, n = 6 from 3 mice; and tdT+, n = 6 from 3 mice. **P < 0.01 by Kruskal-Wallis test followed by Dunn’s test), but not at P28–P35 (Sal, n = 9 from 3 mice; tdT, n = 9 from 8 mice; and tdT+, n = 8 from 3 mice). Data expressed as mean ± SEM.
Figure 7
Figure 7. Diminished LTP and LTD in ELS-TRAPed CA1 neurons at P28–P35.
(A and B) LTP paradigm, showing example traces and plots of evoked AMPA currents before and after paired LTP stimulation protocol (0.3 ms, 100 Hz, separated by 20 seconds) from Sal-treated mice, and tdT and tdT+ neurons from ELS-treated mice. Sal and tdT neurons exhibited a long-lasting increase in EPSC following tetanus (arrow), while tdT+ neurons did not show an increase in EPSC amplitude after stimulation. (C) Summary of LTP experiments showing significantly less LTP in tdT+ neurons compared with neurons from Sal-treated mice, or tdT neurons from ELS-treated mice (Sal, n = 10 neurons/4 mice; tdT, n = 11 neurons/6 mice; tdT+, n = 11 neurons/6 mice). *P < 0.05 by Kruskal-Wallis test followed by Dunn’s test. (D and E) LTD paradigm, showing example traces and plots of evoked AMPA currents before and after long-frequency (5 Hz, 900 pulses) LTD stimulation (LFS) from Sal, tdT, and tdT+ neurons. Sal and tdT neurons showed a long-lasting reduction in EPSC, but tdT+ neurons exhibited comparable EPSC amplitudes before and after long-frequency stimulation. (F) Summary of LTD experiments showing significantly less LTD in tdT+ neurons compared with tdT neurons from ELS mice or neurons from Sal-treated (no seizure) mice (Sal, n = 9 neurons/4 mice; tdT, n = 8 neurons/5 mice; tdT+, n = 7 neurons/5 mice). **P < 0.01, ***P < 0.001 by 1-way ANOVA followed by Tukey’s test. Data expressed as mean ± SEM.
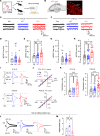
Figure 8
Figure 8. Repeated postseizure IEM-1460 treatment prevents synaptic deficits in TRAPed cells.
(A) Experimental scheme of post-ELS IEM-1460 treatment. (B) Representative confocal images showing robust TRAPed cells with or without IEM-1460 treatment. (C) No difference in TRAPed cell count between the vehicle (Veh, n = 4) and IEM-1460 (n = 4). Sal, n = 6. *P < 0.05 by Kruskal-Wallis test followed by Dunn’s test. (D) TRAPed cells under DIC. Scale bars: 50 μm (B) and 20 μm (D). (E) Representative EPSC traces at –60 and +40 mV from TRAPed neurons with Veh or IEM-1460. (F) The I-V curves of EPSCs in tdT+ cells show a linear relationship in the IEM-1460 group and an inwardly rectifying relationship in the Veh group. (G) The rectification index was decreased in IEM-1460–treated tdT+ neurons (n = 20 neurons/11 mice) compared to Veh (n = 14 neurons/6 mice). *P < 0.05 by Mann-Whitney U test. (H and I) Example traces and plots of evoked AMPA currents before and after LTP protocol (0.3 ms, 100 Hz, separated by 20 seconds) from Sal, as well as in tdT+ cells with Veh and IEM-1460. Sal- and IEM-1460–treated neurons showed a long-lasting increase in EPSC amplitude, but Veh tdT+ neurons exhibited comparable EPSC amplitude before and after stimulation. (J) Summary of LTP. Sal, n = 8 neurons/4 mice; Veh, n = 8 neurons/5 mice; IEM-1460, n = 9 neurons/5 mice. ***P < 0.001 by 1-way ANOVA followed by Tukey’s test. (K and L) Example traces and plots of evoked AMPA currents before and after low-frequency (5 Hz, 900 pulses) LTD stimulation (LFS) from Sal, Veh, and IEM-1460 groups. Sal and IEM-1460 showed a long-lasting reduction in EPSC amplitude, whereas Veh tdT+ neurons exhibited comparable EPSC amplitude. (M) Summary of LTD. Sal, n = 12 neurons/6 mice; Veh, n = 16 neurons/6 mice; IEM-1460, n = 13 neurons/8 mice. *P < 0.05 by 1-way ANOVA followed by Tukey’s test. Data expressed as mean ± SEM.

References

    1. Berg AT, et al. Age at onset of epilepsy, pharmacoresistance, and cognitive outcomes: a prospective cohort study. Neurology. 2012;79(13):1384–1391. doi: 10.1212/WNL.0b013e31826c1b55. - DOI - PMC - PubMed
    1. Bailet LL, Turk WR. The impact of childhood epilepsy on neurocognitive and behavioral performance: a prospective longitudinal study. Epilepsia. 2000;41(4):426–431. doi: 10.1111/j.1528-1157.2000.tb00184.x. - DOI - PubMed
    1. Silverstein FS, Jensen FE. Neonatal seizures. Ann Neurol. 2007;62(2):112–120. doi: 10.1002/ana.21167. - DOI - PubMed
    1. Lee BL, et al. Long-term cognitive outcomes in term newborns with watershed injury caused by neonatal encephalopathy. Pediatr Res. 2022;92(2):505–512. doi: 10.1038/s41390-021-01526-2. - DOI - PMC - PubMed
    1. Lippman-Bell JJ, et al. AMPA receptor antagonist NBQX attenuates later-life epileptic seizures and autistic-like social deficits following neonatal seizures. Epilepsia. 2013;54(11):1922–1932. doi: 10.1111/epi.12378. - DOI - PMC - PubMed