. 2024 Sep 1;19(9):2027-2035.
doi: 10.4103/1673-5374.390952. Epub 2023 Dec 15.

Transplantation of human placental chorionic plate-derived mesenchymal stem cells for repair of neurological damage in neonatal hypoxic-ischemic encephalopathy

Affiliations

Transplantation of human placental chorionic plate-derived mesenchymal stem cells for repair of neurological damage in neonatal hypoxic-ischemic encephalopathy

Lulu Xue et al. Neural Regen Res. .

Abstract

JOURNAL/nrgr/04.03/01300535-202409000-00035/figure1/v/2024-01-16T170235Z/r/image-tiff Neonatal hypoxic-ischemic encephalopathy is often associated with permanent cerebral palsy, neurosensory impairments, and cognitive deficits, and there is no effective treatment for complications related to hypoxic-ischemic encephalopathy. The therapeutic potential of human placental chorionic plate-derived mesenchymal stem cells for various diseases has been explored. However, the potential use of human placental chorionic plate-derived mesenchymal stem cells for the treatment of neonatal hypoxic-ischemic encephalopathy has not yet been investigated. In this study, we injected human placental chorionic plate-derived mesenchymal stem cells into the lateral ventricle of a neonatal hypoxic-ischemic encephalopathy rat model and observed significant improvements in both cognitive and motor function. Protein chip analysis showed that interleukin-3 expression was significantly elevated in neonatal hypoxic-ischemic encephalopathy model rats. Following transplantation of human placental chorionic plate-derived mesenchymal stem cells, interleukin-3 expression was downregulated. To further investigate the role of interleukin-3 in neonatal hypoxic-ischemic encephalopathy, we established an in vitro SH-SY5Y cell model of hypoxic-ischemic injury through oxygen-glucose deprivation and silenced interleukin-3 expression using small interfering RNA. We found that the activity and proliferation of SH-SY5Y cells subjected to oxygen-glucose deprivation were further suppressed by interleukin-3 knockdown. Furthermore, interleukin-3 knockout exacerbated neuronal damage and cognitive and motor function impairment in rat models of hypoxic-ischemic encephalopathy. The findings suggest that transplantation of hpcMSCs ameliorated behavioral impairments in a rat model of hypoxic-ischemic encephalopathy, and this effect was mediated by interleukin-3-dependent neurological function.


Conflict of interest statement

Conflicts of interest: The authors declare that they have no competing interests.

Figures

Figure 1
Figure 1
Timeline of hpcMSCs treatment study. HI models were established in 7-day-old neonatal rats. Subsequently, hpcMSCs were transplanted into the HI rats at 1, 3 and 10 days after HI modeling through the lateral ventricle. The cognitive and locomotor function and anxiety-like behaviors were assessed at 1 and 2 months after hpcMSCs treatment by behavioral evaluations including open field test, Morris water maze test, Y-maze test, rotarod test and NSS. HI: Hypoxia-ischemia; hpcMSCs: human placental chorionic derived mesenchymal stem cells; NS: normal saline; NSS: neurological severity score; P: postnatal day.
Figure 2
Figure 2
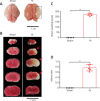
The HI model is successfully established. (A) Obvious swelling was observed the right hemisphere of HI rat brains compared with those of sham rats. The black box indicates the site of the swelling. Scale bar: 1 cm. (B) TTC staining of brain tissue showed the HI-induced infarct. Red arrows indicate the infarction. Scale bar: 1 cm. (C) Quantification of the brain swelling. (D) Quantification for the infarct ratio of brain tissue. Data are displayed as the mean ± SD (n = 5/group). *P < 0.05 (Student's t-test). HI: Hypoxia-ischemia; TTC: triphenyl tetrazolium chloride.
Figure 3
Figure 3
Neurological evaluations of rats at 1 month after hpcMSCs transplantation. (A) Immunofluorescence staining of hpcMSCs showed that the cells expressed CD90+/CD44+CD45, consistent with mesenchymal stem cell characteristics. The green (Dylight 488) indicates CD90- or CD44-positive cells, red (Dylight 594) indicates CD45-positive cells, and blue represents DAPI (nuclei). Scale bars: 50 μm. (B) Quantification diagrams for number of grooming times, time spent grooming, number of feces, number of rearing times, and time spent rearing in the open field test. (C) Quantification diagrams for latency to target, number of target crossings, and distance traveled in target quadrant in the Morris water maze test. (D) The quantification diagrams for time spent in food arm, the number of food arm entries, accuracy, time spent in error arm, number of error arm entries, and the error rate in the Y-maze test. (E) The duration in the rotarod test. (F) The neurological severity scores. All data are presented as mean ± SD (n = 5/group). *P < 0.05 (one-way analysis of variance followed by Tukey's post hoc test). AL: Adjacent left quadrant; AR: adjacent right quadrant; DAPI: 4′,6-diamidino-2-phenylindole; HI: hypoxia-ischemia; hpcMSCs: human placental chorionic derived mesenchymal stem cells; NS: normal saline; O: opposite quadrant; T: target quadrant.
Figure 4
Figure 4
Neurological evaluations of rats at 2 months after hpcMSCs transplantation. (A) Quantification diagrams for the number of times grooming, time spent grooming, number of feces, number of rearing, and the time spent rearing in the open field test. (B) Quantification diagrams for latency to target, number of target crossings, and distance traveled in target quadrant in the Morris water maze test. (C) Time spent in food arm, number of food arm entries, accuracy, time spent in error arm, number of error arm entries, and error rate in the Y-maze test. (D) The duration in the rotarod test. (E) The neurological severity scores. All data are presented as mean ± SD (n = 5/group). *P < 0.05 (one-way analysis of variance followed by Tukey's post hoc test). AL: Adjacent left quadrant; AR: adjacent right quadrant; HI: hypoxia-ischemia; hpcMSCs: human placental chorionic derived mesenchymal stem cells; NS: normal saline; O: opposite quadrant; T. target quadrant.
Figure 5
Figure 5
Identification of differentially expressed proteins in the injured brain and expression of IL-3 after hpcMSC treatment. (A) Protein chip profiles of differentially expressed proteins in the right cortex and hippocampus between sham and HI groups. Red represents high expression and green represents low expression. (B) The intersection of differentially expressed proteins from two tissues. (C) The fold change of three identified proteins with high fold change. (D) The mRNA expression of IL-3 in the cortex and hippocampus in sham, HI, NS and hpcMSCs transplantation groups. All data are presented as the primary data (C) or mean ± SD (D) (n = 5/group). *P < 0.05 (one-way analysis of variance followed by Tukey's post hoc test). HI: Hypoxia-ischemia; hpcMSC: human placental chorionic derived mesenchymal stem cell; IL-3: interleukin-3; NS: normal saline.
Figure 6
Figure 6
Double immunofluorescence staining of IL-3 and NeuN (A) or GFAP (B) in the right and left cortex and hippocampus. (A) Double immunofluorescence staining of IL-3 and NeuN showed that the expression of IL-3 in neurons was obviously higher in the right cortex and hippocampus compared with that of the left cortex and hippocampus. The red (Dylight 594) indicates IL-3-positive cells, green (Dylight 488) indicates NeuN-positive cells (neurons), and blue represents DAPI (nuclei). Scale bars: 100 μm, 50 μm (enlarged image). (B) Double immunofluorescence staining of IL-3 and GFAP showed that the expression of IL-3 in astrocytes was obviously higher in the right cortex and hippocampus compared with that of the left cortex and hippocampus. Scale bars: 100 μm, 50 μm (enlarged image). The red (Dylight 594) indicates IL-3-positive cells, green (Dylight 488) indicates GFAP-positive cells (astrocytes), and blue represents DAPI (nuclei). DAPI: 4′,6-Diamidino-2-phenylindole; GFAP: glial fibrillary acidic protein; IL-3: interleukin-3; NeuN: neuron-specific nuclear protein.
Figure 7
Figure 7
Downregulation of IL-3 impairs the viability and growth of SH-SY5Y cells after OGD. (A) CY3 staining verified the successful transfection of IL-3 siRNAs in SH-SY5Y cells. Scale bar: 20 μm. (B) Relative mRNA expression of IL-3 in normal, reagent, NC, F1 and F2 groups. The lowest IL-3 expression was observed in the F2 group. (C–E) The cell viability detected by CCK-8 (C) and MTT (D) methods, and the number of cells (E) showed significantly reduced cell viability and growth after IL-3 downregulation compared with OGD + NC and OGD + reagent groups. All data are presented as the mean ± SD (n = 5/group). All procedures were conducted in triplicate and repeated at least three times. *P < 0.05 (one-way analysis of variance followed by Tukey's post hoc test). CCK-8: Cell counting kit-8; IL-3-si: interleukin-3 silencing; MTT: methyl thiazolyl tetrazolium; NC: negative control; OGD: oxygen-glucose deprivation.
Figure 8
Figure 8
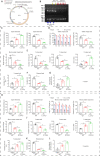
The effects of IL-3 KO on behavioral function of HI rats at 1 and 2 months after HI. (A) The construction of IL-3 KO rats. (B) Genetic identification of IL-3 KO rats. Yellow arrows indicate WT, red arrows indicate KO, and blue arrows indicate HET. Numbers 86–91 and 95–100 represent the rat number. (C) The time spent grooming and rearing were measured during an open field test in the sham, HI and IL-3 KO groups at 1 month. (D) Quantifications of latency to target, number of target crossings, and distance traveled in target quadrant in the Morris water maze at 1 month. (E) Quantification diagrams for the number of food arm entries, accuracy, number of error arm entries, and error rate in Sham, HI and IL-3 KO groups during the Y-maze test at 1 month. (F) The duration on the rotarod in sham, HI and IL-3 KO groups at 1 month. (G) The neurological severity scores in these groups at 1 month. (H–L) Quantification of the same measures at 2 months after HI. All data are presented as mean ± SD (n = 5/group). *P < 0.05 (one-way analysis of variance followed by Tukey's post hoc test). HET: Heterozygote; HI: hypoxia-ischemia; IL-3: interleukin-3; KO: knockout; WT: wild type.

Similar articles

Cited by

References

    1. Antoniadou E, David AL. Placental stem cells. Best Pract Res Clin Obstet Gynaecol. 2016;31:13–29. - PubMed
    1. Bailo M, Soncini M, Vertua E, Signoroni PB, Sanzone S, Lombardi G, Arienti D, Calamani F, Zatti D, Paul P, Albertini A, Zorzi F, Cavagnini A, Candotti F, Wengler GS, Parolini O. Engraftment potential of human amnion and chorion cells derived from term placenta. Transplantation. 2004;78:1439–1448. - PubMed
    1. Chen HR, Chen CW, Kuo YM, Chen B, Kuan IS, Huang H, Lee J, Anthony N, Kuan CY, Sun YY. Monocytes promote acute neuroinflammation and become pathological microglia in neonatal hypoxic-ischemic brain injury. Theranostics. 2022a;12:512–529. - PMC - PubMed
    1. Chen P, Ning X, Li W, Pan Y, Wang L, Li H, Fan X, Zhang J, Luo T, Wu Y, Ou C, Chen M. Fabrication of Tβ4-Exosome-releasing artificial stem cells for myocardial infarction therapy by improving coronary collateralization. Bioact Mater. 2022b;14:416–429. - PMC - PubMed
    1. Chen T, Xia Y, Zhang L, Xu T, Yi Y, Chen J, Liu Z, Yang L, Chen S, Zhou X, Chen X, Wu H, Liu J. Loading neural stem cells on hydrogel scaffold improves cell retention rate and promotes functional recovery in traumatic brain injury. Mater Today Bio. 2023;19:100606. - PMC - PubMed