. 2024 Sep 1;19(9):2041-2049.
doi: 10.4103/1673-5374.390960. Epub 2023 Dec 15.

Metformin alleviates spinal cord injury by inhibiting nerve cell ferroptosis through upregulation of heme oxygenase-1 expression

Affiliations

Metformin alleviates spinal cord injury by inhibiting nerve cell ferroptosis through upregulation of heme oxygenase-1 expression

Zhihua Wang et al. Neural Regen Res. .

Abstract

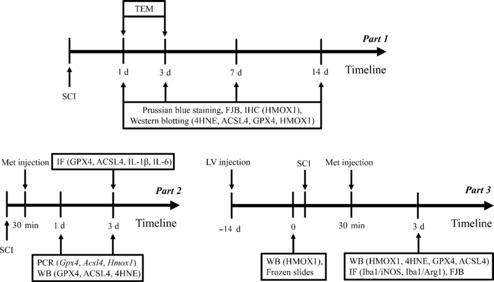
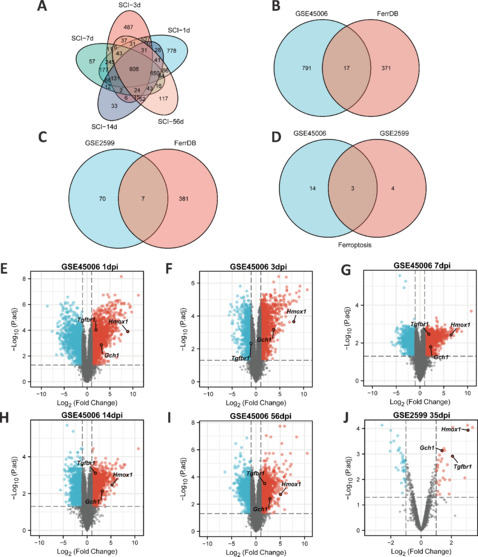
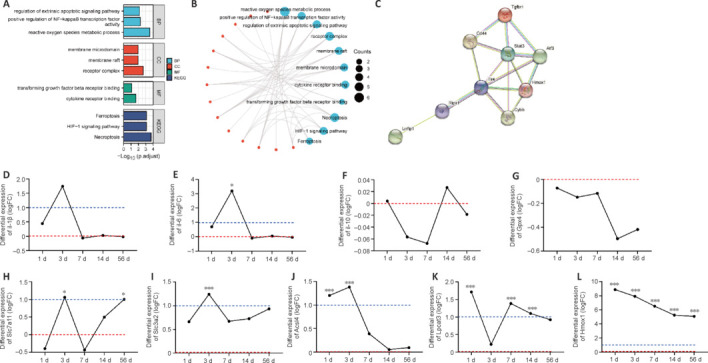
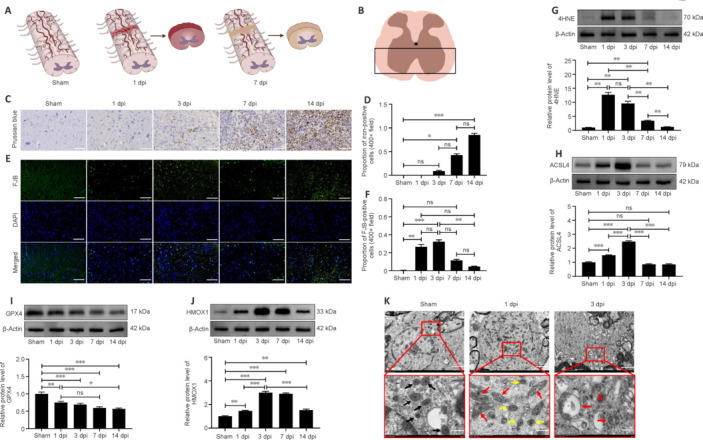
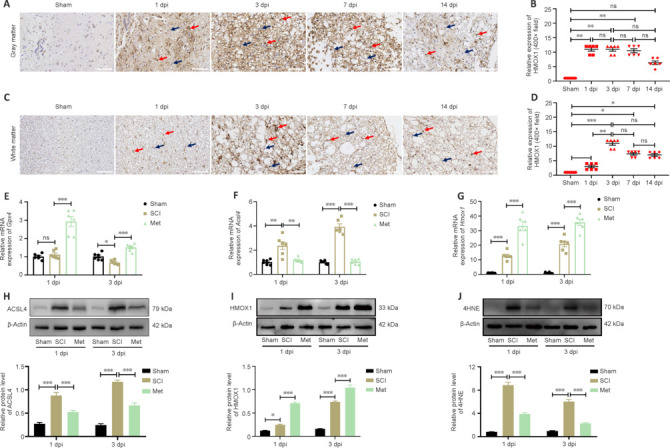
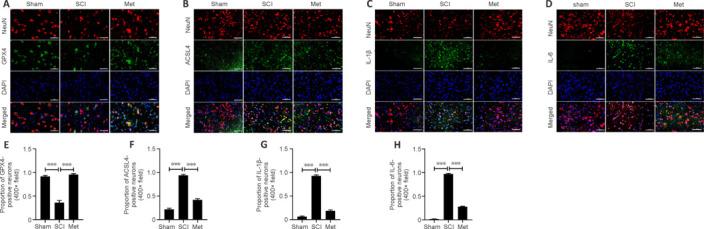
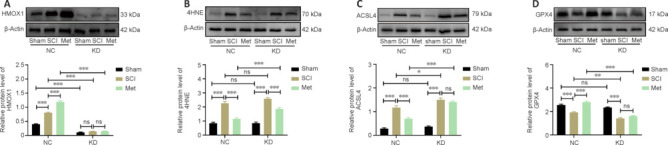
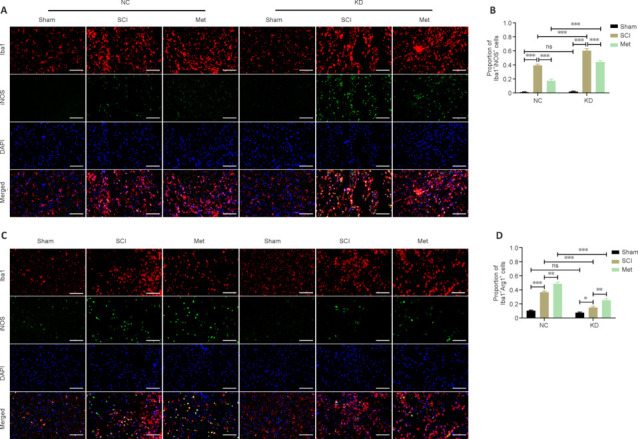
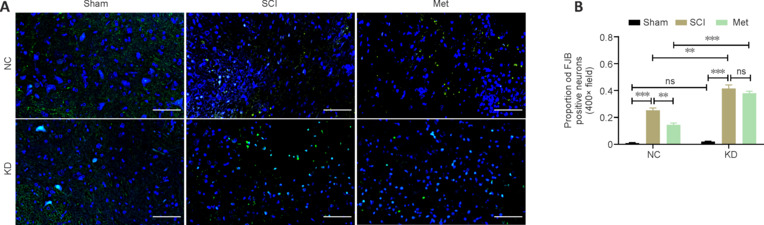
JOURNAL/nrgr/04.03/01300535-202409000-00037/figure1/v/2024-01-16T170235Z/r/image-tiff Previous studies have reported upregulation of heme oxygenase-1 in different central nervous system injury models. Heme oxygenase-1 plays a critical anti-inflammatory role and is essential for regulating cellular redox homeostasis. Metformin is a classic drug used to treat type 2 diabetes that can inhibit ferroptosis. Previous studies have shown that, when used to treat cardiovascular and digestive system diseases, metformin can also upregulate heme oxygenase-1 expression. Therefore, we hypothesized that heme oxygenase-1 plays a significant role in mediating the beneficial effects of metformin on neuronal ferroptosis after spinal cord injury. To test this, we first performed a bioinformatics analysis based on the GEO database and found that heme oxygenase-1 was upregulated in the lesion of rats with spinal cord injury. Next, we confirmed this finding in a rat model of T9 spinal cord compression injury that exhibited spinal cord nerve cell ferroptosis. Continuous intraperitoneal injection of metformin for 14 days was found to both upregulate heme oxygenase-1 expression and reduce neuronal ferroptosis in rats with spinal cord injury. Subsequently, we used a lentivirus vector to knock down heme oxygenase-1 expression in the spinal cord, and found that this significantly reduced the effect of metformin on ferroptosis after spinal cord injury. Taken together, these findings suggest that metformin inhibits neuronal ferroptosis after spinal cord injury, and that this effect is partially dependent on upregulation of heme oxygenase-1.


Conflict of interest statement

Conflicts of interest: The authors declare that they have no conflicts of interest.

Figures

Figure 1
Figure 1
Experimental flowchart for the in vivo experiments. 4HNE: 4-Hydroxynonenal; ACSL4: acyl-coenzyme A synthetase long-chain family member 4; Arg1: arginase 1; GPX4: glutathione peroxidase 4; HMOX1: heme oxygenase-1; IF: immunofluorescence; IHC: immunohistochemistry; Iba1: ionized calcium binding adaptor molecule 1; IL-1β: interleukin 1β; IL-6: interleukin 6; iNOS: inducible nitric oxide synthase; LV: lentivirus; PCR: polymerase phain peaction; SCI: spinal cord injury; TEM: transmission electron microscopy; WB: western blotting.
Figure 2
Figure 2
Hmox1 is significantly upregulated in a rat model of SCI. (A) Common DEGs at five time points in the GSE45006 dataset. (B) Ferroptosis-related DEGs (from the FerrDb V2 database (http://www.zhounan.org/ferrdb/current/)) in the GSE45006 dataset. (C) Ferroptosis-related DEGs in the GSE2599 dataset. (D) Common ferroptosis-related DEGs in the GSE45006 and GSE2599 datasets. (E–I) Visualization of DEGs at different time points in the GSE45006 dataset, including three common ferroptosis-related DEGs. (J) Visualization of DEGs in the GSE2599 dataset, containing three common ferroptosis-related DEGs. |logFC| > 1, adjusted P value < 0.05. DEGs: Differentially expressed genes; dpi: day(s) post injury; FC: fold change; Gch1: GTP cyclohydrolase 1 gene; Hmox1: heme oxygenase-1; SCI: spinal cord injury; Tgfbr1: transforming growth factor beta receptor 1.
Figure 3
Figure 3
Dynamic changes in the expression of inflammatory cytokine genes and ferroptosis-related genes (FRGs) after SCI. (A, B) Functional annotation and pathway enrichment analysis of 17 ferroptosis-related DEGs from the GSE45006 dataset. Red represents molecules, and blue represents GO and KEGG items. (C) Protein-protein interaction network of 17 ferroptosis-related DEGs. (D–L) Dynamic changes in nine FRGs of interest after SCI. Red line: baseline value, indicating that the expression level of this gene at this time point was 1 time that of the sham group (20). Blue line: |logFC| = 1, indicating that the expression level of this gene at this time point was 2 time that of the sham group (21). Adjusted *P < 0.05, adjusted ***P < 0.001 (independent samples t test). Acsl4: Acyl-coenzyme A synthetase long-chain family member 4; Atf3: activating transcription factor 3; BP: biological brocess; CC: cell component; CD44: cluster of differentiation 44; Cybb: cytochrome b-245 beta chain; DEGs: differentially expressed genes; FRG: ferroptosis-related gene; Gpx4: glutathione peroxidase 4; HIF-1: hypoxia inducible factor-1; Hmox1: heme oxygenase-1; Il-10: interleukin 10; Il-1β: interleukin 1β; Il-6: interleukin 6; KEGG: Kyoto Encyclopedia of Genes and Genomes; Lpcat3: lysophosphatidylcholine acyltransferase 3; Lrrfip1: lrr binding flii interacting protein 1; MF: molecular function; Ripk1: receptor-interacting protein kinase 1; SCI: spinal cord injury; Slc3a2: solute carrier family 3 member 2; Slc7a11: solute carrier family 7 member 11; Stat3: signal transducer and activator of transcription 3; Tgfbr1: transforming growth factor beta receptor 1; Tlr4: Toll-like receptor 4.
Figure 4
Figure 4
SCI-induced lipid peroxidation and iron deposition aggravate ferroptosis. (A) Schematic diagrams of the sham, 1 dpi, and 7 dpi groups and the main region of interest (ROI). (B) Representative area of interest in the ROI. (C, D) Representative images of Prussian blue staining and quantification of iron-positive cells. Iron deposition was not detected until 3 days after SCI and was significantly elevated on days 7 and 14 compared with the sham group (n = 6). Scale bars: 50 μm. (E, F) Representative images of Fluoro-Jade B (FJB) staining and quantification of FJB-positive neurons. The number of degenerating neurons was significantly increased on day 3, but not on days 7 and 14, after SCI compared with the sham group (n = 6). Scale bars: 50 μm. (G–J) Relative protein expression levels of 4HNE, ACSL4, GPX4, and HMOX1, normalized to the sham group (n = 5). (K) Mitochondrial ultrastructure was examined by transmission electron microscopy (n = 3). Scale bars: 2 μm (upper panel), 500 nm (lower panel). Black arrows: normal mitochondria, red arrows: damaged mitochondria, yellow arrows: smaller mitochondria (that did not exhibit shrunken morphology). The data are expressed as the mean ± SEM. *P < 0.05, **P < 0.01, ***P < 0.001 (one-way analysis of variance with Bonferroni post hoc test). 4HNE: 4-Hydroxynonenal; ACSL4: acyl-coenzyme A synthetase long-chain family member 4; dpi: day(s) post injury; GPX4: glutathione peroxidase 4; HMOX1: heme oxygenase-1; hpi: hours post-injury; ns: not significant; SCI: spinal cord injury.
Figure 5
Figure 5
Met treatment increases HMOX1 expression after SCI. (A, B) Representative images of immunohistochemistry (IHC) staining and quantification of HMOX1 expression in the gray matter. HMOX1 expression was significantly upregulated in the first 7 days after injury in the SCI group compared with the sham group (n = 6). Scale bars: 50 μm. (C, D) Representative images of IHC staining and quantification of HMOX1 expression in the white matter. HMOX1 expression was significantly upregulated in the first 14 days after injury in the SCI group compared with the sham group. HMOX1 expression was highest on day 3 after SCI compared with the Sham group (n = 6). Red arrows: positively stained cells, black arrows: non-stained cells. Scale bars: 50 μm. (E–G) Relative mRNA levels of Gpx4, Acsl4, and Hmox1 were determined by PCR (n = 6). (H–J) Relative protein expression levels of ACSL4, HMOX1, and 4HNE in the indicated groups (n = 5). Expression levels shown in E–G were normalized to those in the sham group. The data are expressed as the mean ± SEM. *P < 0.05, **P < 0.01, ***P < 0.001 (one-way analysis of variance with Bonferroni post hoc test (B, D) or two-way analysis of variance with Tukey's post hoc test (E–J)). 4HNE: 4-Hydroxynonenal; ACSL4: acyl-coenzyme A synthetase long-chain family member 4; dpi: day(s) post injury; GPX4: glutathione peroxidase 4; HMOX1: heme oxygenase-1; Met: metformin; ns: not significant; SCI: spinal cord injury.
Figure 6
Figure 6
Met attenuates neuronal cell ferroptosis and neuroinflammation after SCI. (A–D) Representative IF staining images showing GPX4+ and ACSL4+ neurons, and quantitative analysis of the results. Ferroptosis in the SCI group was increased compared with the sham group, and this effect was dramatically reversed by Met treatment (n = 5). (E–H) Representative IF staining images showing IL-1β+ and IL-6+ neurons, and quantitative analysis of the results. Neuroinflammation in the SCI group was increased compared with the sham group, and this effect was dramatically reversed by Met treatment (n = 5). Red indicates Cy3-positive neurons, and green indicates cells that stained positively for GPX4, ACSL4, IL-1β, or IL-6. Scale bars: 50 μm. The data are expressed as the mean ± SEM. ***P < 0.001 (one-way analysis of variance with Bonferroni post hoc test). ACSL4: Acyl-coenzyme A synthetase long-chain family member 4; GPX4: glutathione peroxidase 4; IF: immunofluorescence; IL-1β: interleukin 1β; IL-6: interleukin 6; Met: metformin; SCI: spinal cord injury.
Figure 7
Figure 7
HMOX1 knockdown partially reverses the anti-ferroptotic effects of Met after SCI. (A–D) Representative western blot showing HMOX1, 4HNE, ACSL4, and GPX4 expression levels in the indicated groups at 3 dpi (n = 5). Expression levels were normalized to the β-actin expression level in the same lane. The data are expressed as the mean ± standard error of the mean. *P < 0.05, **P < 0.01, ***P < 0.001 (two-way analysis of variance with Tukey's post hoc test). 4HNE: 4-Hydroxynonenal; ACSL4: acyl-coenzyme A synthetase long-chain family member 4; dpi: day(s) post injury; GPX4: glutathione peroxidase 4; HMOX1: heme oxygenase-1; KD: knockdown; Met: metformin; NC: normal control; ns: not significant; SCI: spinal cord injury.
Figure 8
Figure 8
Met promotes the polarization of M1-type microglia/macrophages towards an M2 phenotype in an HMOX1-independent manner. (A, B) Representative IF staining images and the proportion of iNOS+-stained microglia/macrophages in the indicated groups at 3 dpi. In both the NC and KD groups, the ratio of M1-type to M2-type microglia in the SCI group was increased compared with that in the sham group, and this effect was dramatically reversed by Met treatment. After HMOX1 knockdown, the ratio in the SCI and Met subgroups of the KD group was higher than that in the NC group (n = 5). Scale bars: 50 μm. (C, D) Representative IF staining images and the proportion of Arg1+-stained microglia/macrophages in the indicated groups at 3 dpi. In both the NC and KD groups, the ratio of M2-type to M1-type microglia in the SCI group was increased compared with that in the sham group, and this ratio was further increased by Met treatment. After HMOX1 knockdown, the ratio in the SCI and Met subgroups of the KD group was lower than that in the NC group (n = 5). Red indicates Iba1 (stained with Cy3), and green indicates iNOS or Arg1 (stained with Alexa Fluor 488). Scale bars: 50 μm. *P < 0.05, **P < 0.01, ***P < 0.001 (two-way analysis of variance with Tukey's post hoc test). Arg1: Arginase 1; dpi: day(s) post injury; IF: immunofluorescence; iNOS: inducible nitric oxide synthase; KD: knockdown; Met: metformin; NC: normal control; ns: not significant; SCI: spinal cord injury.
Figure 9
Figure 9
Met exerts a neuroprotective effect in an HMOX1-dependent manner. (A, B) Representative FJB staining images and the proportion of FJB+ neurons at 3 dpi. In both the NC and KD groups, the ratio of FJB+ neurons to unstained neurons in the SCI group was increased compared with that in the sham group. This effect was dramatically reversed by Met treatment in the NC group but not in the KD group. After HMOX1 knockdown, the ratio in the SCI subgroup and the Met subgroup of the KD group was higher than that in the NC group (n = 5). Scale bars: 50 μm. **P < 0.01, ***P < 0.001 (two-way analysis of variance with Tukey's post hoc test). dpi: Day(s) post injury; FJB: Fluoro-Jade B; KD: knockdown; Met: metformin; NC: normal control; ns: not significant; SCI: spinal cord injury.

Similar articles

Cited by

References

    1. Adegeest CY, van Gent JAN, Stolwijk-Swüste JM, Post MWM, Vandertop WP, Öner FC, Peul WC, Wengel PVT. Influence of severity and level of injury on the occurrence of complications during the subacute and chronic stage of traumatic spinal cord injury: a systematic review. J Neurosurg Spine. 2022;36:632–652. - PubMed
    1. Bach JR. Noninvasive respiratory management of high level spinal cord injury. J Spinal Cord Med. 2012;35:72–80. - PMC - PubMed
    1. Bin S, Xin L, Lin Z, Jinhua Z, Rui G, Xiang Z. Targeting miR-10a-5p/IL-6R axis for reducing IL-6-induced cartilage cell ferroptosis. Exp Mol Pathol. 2021;118:104570. - PubMed
    1. Cai X, Hua S, Deng J, Du Z, Zhang D, Liu Z, Khan NU, Zhou M, Chen Z. Astaxanthin activated the Nrf2/HO-1 pathway to enhance autophagy and inhibit ferroptosis, ameliorating acetaminophen-induced liver injury. ACS Appl Mater Interfaces. 2022;14:42887–42903. - PubMed
    1. Campbell NK, Fitzgerald HK, Dunne A. Regulation of inflammation by the antioxidant haem oxygenase 1. Nat Rev Immunol. 2021;21:411–425. - PubMed