. 2024 Jan 16;22(1):e3002406.
doi: 10.1371/journal.pbio.3002406. eCollection 2024 Jan.

The extracellular matrix supports breast cancer cell growth under amino acid starvation by promoting tyrosine catabolism

Affiliations

The extracellular matrix supports breast cancer cell growth under amino acid starvation by promoting tyrosine catabolism

Mona Nazemi et al. PLoS Biol. .

Abstract

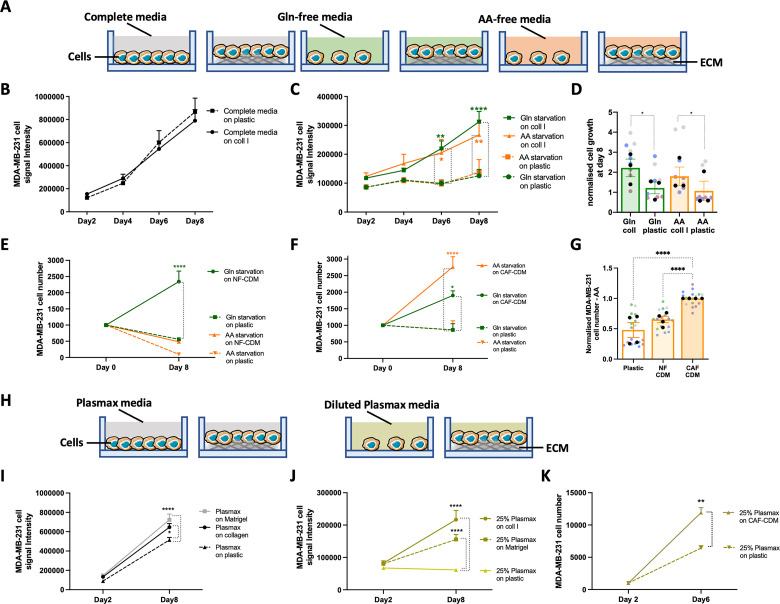
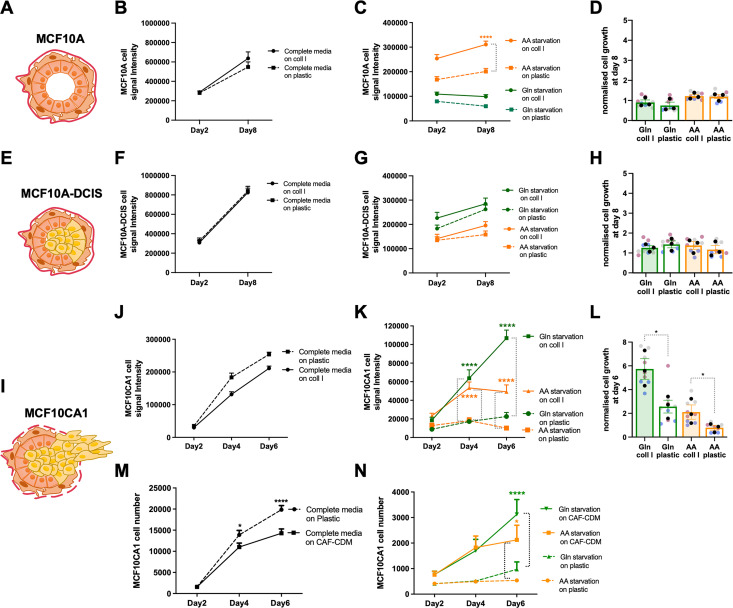
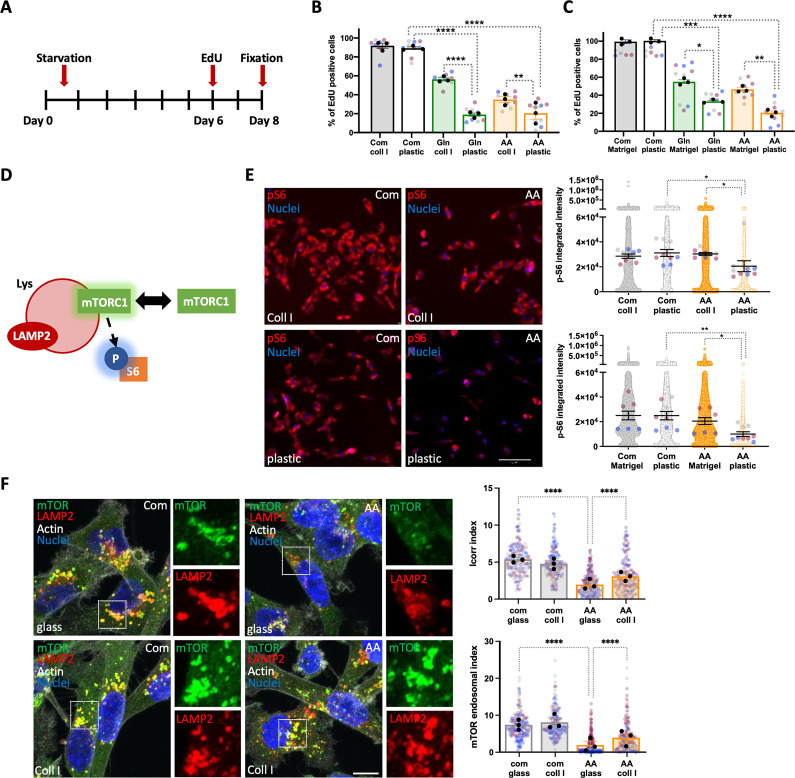
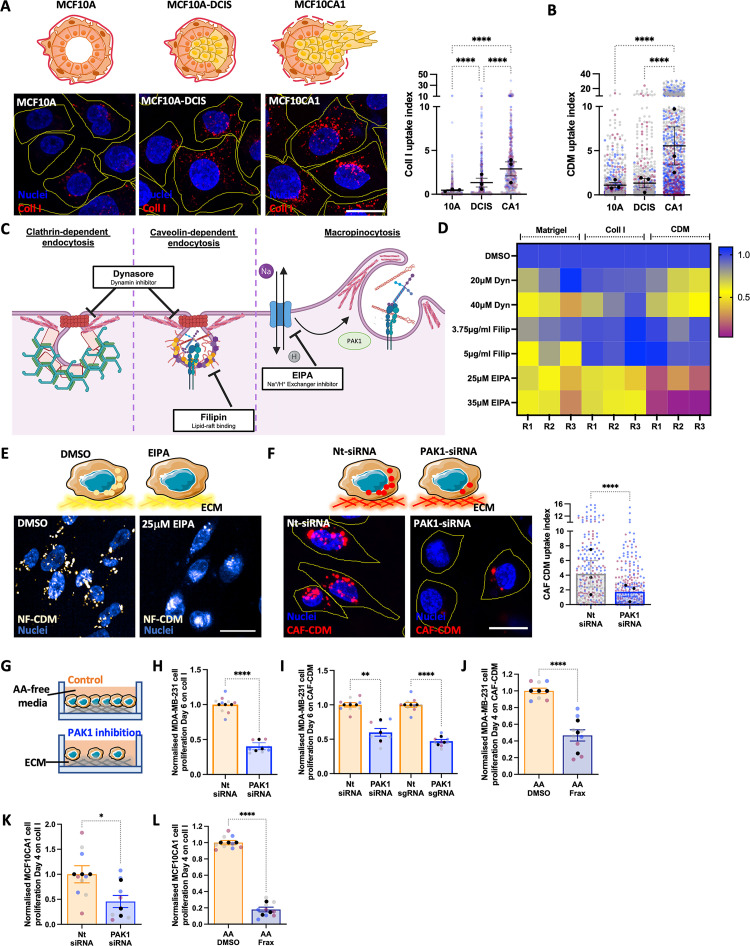
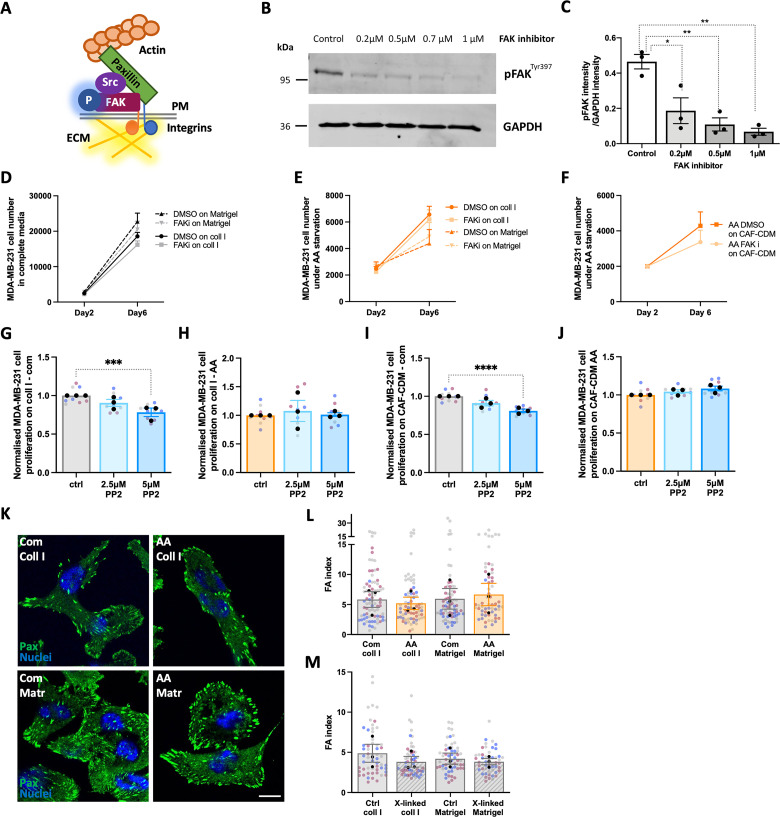
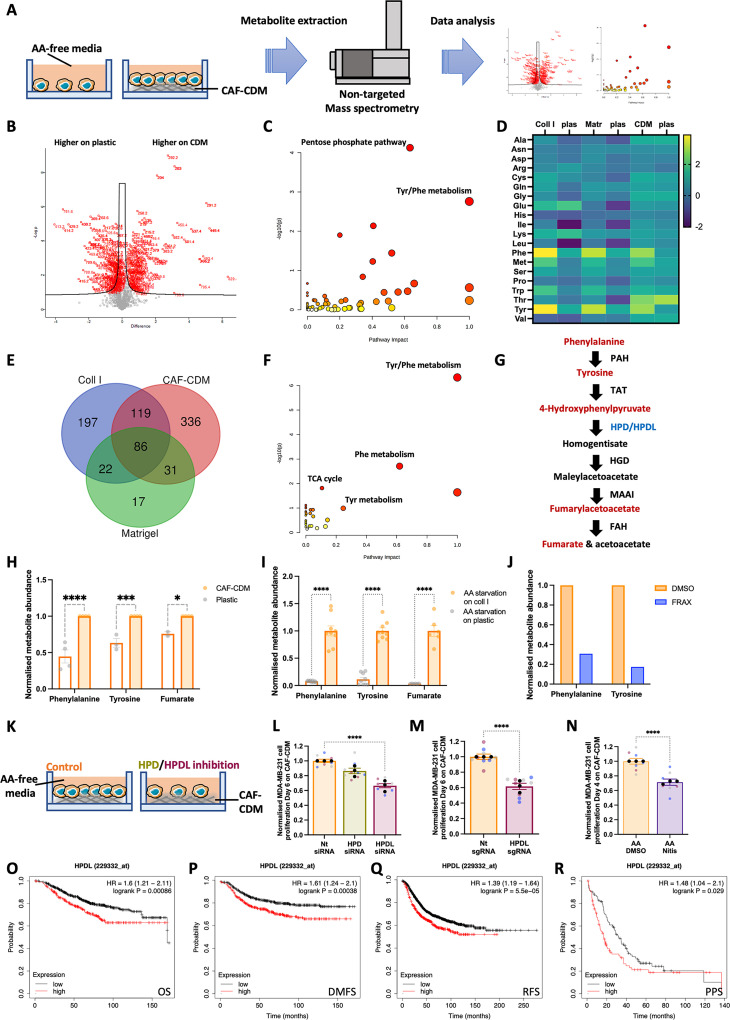
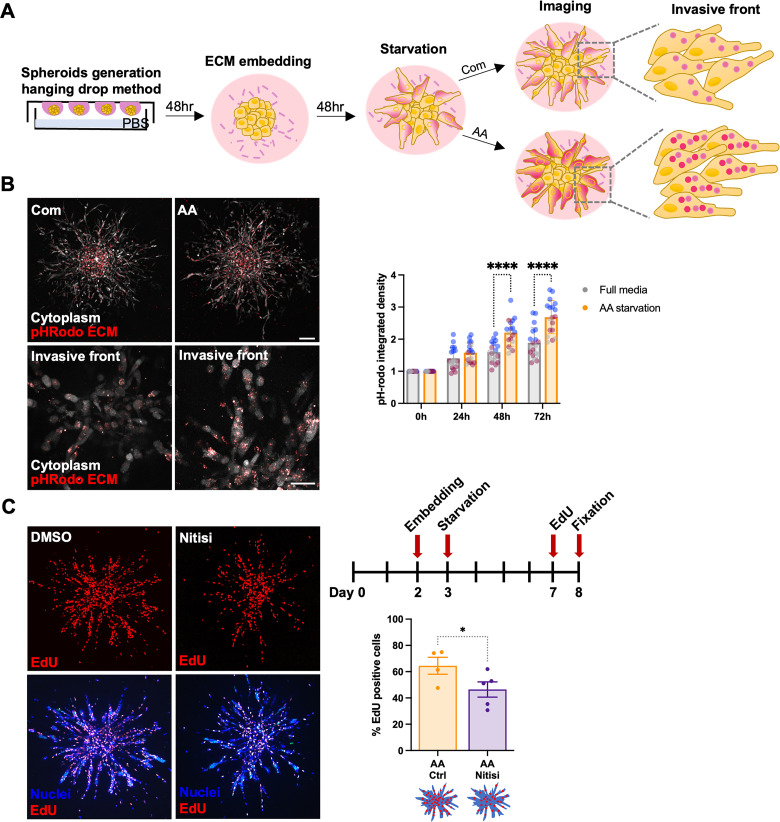
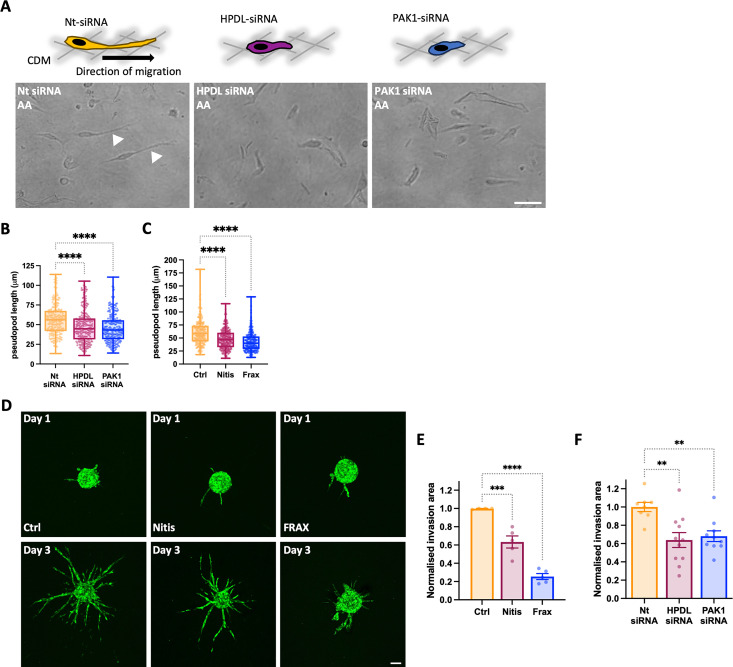
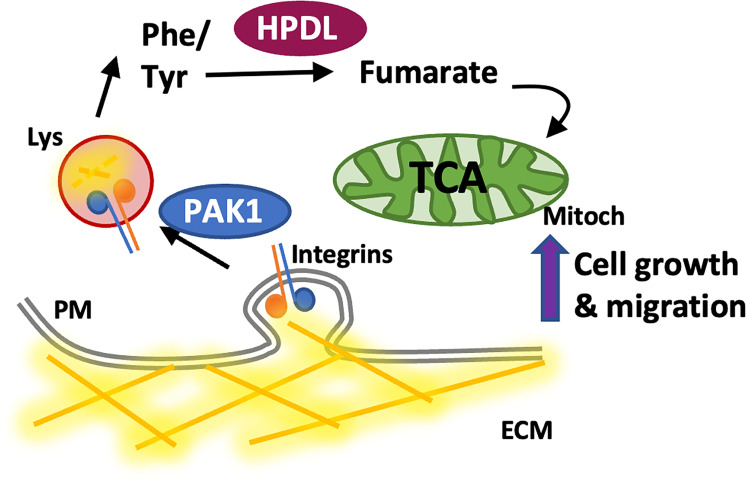
Breast tumours are embedded in a collagen I-rich extracellular matrix (ECM) network, where nutrients are scarce due to limited blood flow and elevated tumour growth. Metabolic adaptation is required for cancer cells to endure these conditions. Here, we demonstrated that the presence of ECM supported the growth of invasive breast cancer cells, but not non-transformed mammary epithelial cells, under amino acid starvation, through a mechanism that required macropinocytosis-dependent ECM uptake. Importantly, we showed that this behaviour was acquired during carcinoma progression. ECM internalisation, followed by lysosomal degradation, contributed to the up-regulation of the intracellular levels of several amino acids, most notably tyrosine and phenylalanine. This resulted in elevated tyrosine catabolism on ECM under starvation, leading to increased fumarate levels, potentially feeding into the tricarboxylic acid (TCA) cycle. Interestingly, this pathway was required for ECM-dependent cell growth and invasive cell migration under amino acid starvation, as the knockdown of p-hydroxyphenylpyruvate hydroxylase-like protein (HPDL), the third enzyme of the pathway, opposed cell growth and motility on ECM in both 2D and 3D systems, without affecting cell proliferation on plastic. Finally, high HPDL expression correlated with poor prognosis in breast cancer patients. Collectively, our results highlight that the ECM in the tumour microenvironment (TME) represents an alternative source of nutrients to support cancer cell growth by regulating phenylalanine and tyrosine metabolism.


Conflict of interest statement

The authors have declared that no competing interests exist.

Figures

Fig 1
Fig 1. The ECM supported cell growth under starvation.
(A, H) Schematic, cell proliferation assays. (B–D) MDA-MB-231 cells were seeded on plastic or 2 mg/ml collagen I (coll I) for 8 days under complete media, glutamine (Gln) and amino acid (AA) starvation, fixed, stained with DRAQ5, and imaged with a Licor Odyssey system. Signal intensity was calculated by Image Studio Lite software. (E–G) MDA-MB-231 cells were seeded on plastic, NF-CDM (E, G) or CAF-CDM (F,G) under Gln or AA starvation for 8 days, fixed and stained with Hoechst 33342. Images were collected by ImageXpress micro and analysed by MetaXpress software. (I–K) MDA-MB-231 cells were seeded on plastic, 2 mg/ml collagen I (coll I) or 3 mg/ml Matrigel (I, J) or on CAF-CDM (K) in complete Plasmax media or Plasmax diluted 1:4 in PBS (25%) for 8 or 6 days, fixed and stained with DRAQ5 (I, J) or Hoechst 33342 (K) and quantified as above. Values are mean ± SEM from at least 3 independent experiments (the black dots in the bar graphs represent the mean of individual experiments). *p < 0.05, **p < 0.01, ****p < 0.0001 (C, E, F, I, J, K) two-way ANOVA, Tukey’s multiple comparisons test. (D, G) Kruskal–Wallis, Dunn’s multiple comparisons test. All the raw data associated with this figure are available in S1 Data. CAF, cancer-associated fibroblast; CDM, cell-derived matrix; ECM, extracellular matrix; NF, normal fibroblast.
Fig 2
Fig 2. The ability to use the ECM to promote cell growth was acquired during carcinoma progression.
Schematic, normal mammary gland (A), DCIS (E), and invasive carcinoma (I). MCF10A, MCF10A-DCIS, and MCF10CA1 cells were seeded on plastic, (B–D, F–H, J–L) 2 mg/ml collagen I (coll I) or (M, N) CAF-CDM for 8 or 6 days under complete media, glutamine (Gln) and amino acid (AA) starvation, fixed, stained with DRAQ5 (B–D, F–H, J–L) or Hoechst 33342 (M, N) and imaged with a Licor Odyssey system (B–D, F–H, J–L) or ImageXpress micro (M, N). Signal intensity was calculated by Image Studio Lite software (B–D, F–H, J–L) or MetaXpress software (M, N). Values are mean ± SEM from at least 3 independent experiments (the black dots in the bar graphs represent the mean of individual experiments). *p < 0.05, **** p <0.0001 (C, K, M, N) two-way ANOVA, Tukey’s multiple comparisons test. (L) Kruskal–Wallis, Dunn’s multiple comparisons test. All the raw data associated with this figure are available in S2 Data. CAF, cancer-associated fibroblast; CDM, cell-derived matrix; DCIS, ductal carcinoma in situ; ECM, extracellular matrix.
Fig 3
Fig 3. Collagen I and Matrigel induced cell proliferation and rescued mTORC1 activity under amino acid starvation.
(A) Timeline of EdU incorporation experiments. (B–E) MDA-MB-231 cells were seeded on plastic, (B, E) 2 mg/ml collagen I (coll I) or (C, E) 3 mg/ml Matrigel under complete media (Com), glutamine (Gln) or amino acid (AA) starvation. (B, C) Cells were incubated with EdU at day 6 post starvation, fixed and stained with Hoechst 33342 and Click iT EdU imaging kit at day 8. Images were collected by ImageXpress micro and analysed by MetaXpress software. (D) Schematic, mTORC1 activation on the lysosomal membrane. (E) Cells were fixed and stained for p-S6 and nuclei at day 3 post starvation. Images were collected by ImageXpress micro and analysed by CME software. (F) MDA-MB-231 cells were seeded on uncoated or 1 mg/ml collagen I-coated glass-bottomed dishes for 24 h in complete media, kept in complete (Com) or amino acid-free (AA) media for 24 h, fixed and stained for mTOR (green), LAMP2 (red), actin (white), and nuclei (blue). Samples were imaged with a Nikon A1 confocal microscope. Scale bar, 10 μm. mTOR/LAMP2 co-localisation (Icorr index) and mTOR endosomal accumulation (mTOR endosomal index) were quantified with Image J. The mTOR endosomal index was calculated by thresholding the green channel to identify the objects and plotting the percentage of the ratio between object area and cell area. Values are mean ± SEM from 3 independent experiments (the black dots represent the mean of individual experiments). *p < 0.05, **p < 0.01, ***p < 0.001, ****p < 0.0001 Kruskal–Wallis, Dunn’s multiple comparisons test. All the raw data associated with this figure are available in S3 Data. mTORC1, mammalian target of rapamycin complex 1.
Fig 4
Fig 4. PAK1-mediated ECM macropinocytosis was required for ECM-dependent cell growth under amino acid starvation.
MCF10A (10A), MCF10A-DCIS (DCIS), and MCF10CA1 (CA1) were seeded on pH-rodo-labelled 1 mg/ml collagen I (A) or NF-CDM (B) for 6 h, stained with Hoechst 33342 (blue) and imaged live with a Nikon A1 confocal microscope. Scale bar, 20 μm. ECM uptake index was quantified with Image J. (C) Schematic, main endocytic pathways and inhibitor targets. (D, E) MDA-MB-231 cells were seeded on pH-rodo labelled 0.5 mg/ml Matrigel, 0.5 mg/ml collagen I (coll I), or NF-CDM (CDM, white) in the presence of DMSO control, 20 μm or 40 μm dynasore, 3.75 μg/ml or 5 μg/ml filipin, 25 μm or 35 μm EIPA for 6 h, stained with Hoechst 33342 (blue), imaged live with an Opera Phenix microscope and analysed with Columbus software. Scale bar, 20 μm. (F) MDA-MB-231 cells were transfected with a siRNA targeting PAK1 (PAK1-siRNA) or a non-targeting siRNA control (nt-siRNA), plated on pH-rodo labelled CAF-CDM (red) for 6 h, stained with Hoechst 33342 (blue) and imaged live with a Nikon A1 confocal microscope. Scale bar, 20 μm. ECM uptake index was quantified with Image J. (G) Schematic, cell proliferation experiments. MDA-MB-231 (H, I) and MDA-MB-231 CRSPRi (I) cells were plated on 2 mg/ml collagen I (coll I, H) or CAF-CDM (I), transfected with a siRNA targeting PAK1 (PAK1-siRNA), a non-targeting siRNA control (nt-siRNA, H,I), a synthetic guide RNA targeting PAK1 (PAK1-sgRNA) or a non-targeting synthetic guide RNA control (nt-sgRNA, I) and cultured under amino acid starvation for 6 days. MDA-MB-231 cells (J) and MCF10CA1 cells (L) were grown on CAF-CDM (J) or 2 mg/ml collagen I (coll I, L) under amino acid (AA) starvation for 4 days in the presence of 3 μm (J) or 1 μm (L) FRAX597, fixed and stained with Hoechst 33342. (K) MCF10CA1 cells were transfected with a siRNA targeting PAK1 (PAK1-siRNA) or a non-targeting siRNA control (nt-siRNA) and cultured under amino acid (AA) starvation for 4 days. Cells were fixed and stained with Hoechst 33342. Images were collected by ImageXpress micro and analysed by MetaXpress software. Values are mean ± SEM and from 3 independent experiments (the black dots represent the mean of individual experiments). *p < 0.05, **p < 0.01, ****p < 0.0001 Mann–Whitney test (F, H, J–L) or Kruskal–Wallis, Dunn’s multiple comparisons test (A, B, I). All the raw data associated with this figure are available in S4 Data. CAF, cancer-associated fibroblast; CDM, cell-derived matrix; DCIS, ductal carcinoma in situ; ECM, extracellular matrix; NF, normal fibroblast.
Fig 5
Fig 5. FA signalling was not required for ECM-dependent cell growth.
(A) Schematic, FAs. (B, C) MDA-MB-231 cells were suspended in complete media containing either 0.2 μm, 0.5 μm, 0.7 μm, or 1 μm PF573228 (FAK inhibitor) or DMSO (vehicle) for 30 min. Cells were seeded on 0.5 mg/ml collagen I for 30 min in the same media, lysed and proteins analysed by western blotting. The intensity of the bands was quantified using the Licor Odyssey system. Values are mean ± SEM from 3 independent experiments. *p < 0.05, **p < 0.01 Kruskal–Wallis, Dunn’s multiple comparisons test. (D–F) MDA-MB-231 cells were seeded on either 2 mg/ml collagen I (coll I), 3 mg/ml Matrigel, CAF-CDM or plastic under complete media or amino acid starvation for 6 days and treated with 0.5 μm PF573228 (FAKi) or DMSO (control) every 2 days. Cells were fixed and stained with Hoechst 33342. Images were collected by ImageXpress micro and analysed by MetaXpress software. Values are mean ± SEM from at least 3 independent experiments. (G–J) MDA-MB-231 cells were seeded on 2 mg/ml collagen I (coll I), CAF-CDM, or plastic under complete media or amino acid starvation for 4 days and treated with 2.5 μm, 5 μm PP2 or DMSO (control) every 2 days, stained and analysed as in (D). Values are mean ± SEM from 3 independent experiments. ***p < 0.001, ****p < 0.0001 Kruskal–Wallis, Dunn’s multiple comparisons test. (K–M) MDA-MB-231 cells were plated on 2 mg/ml collagen I (coll I) or 3 mg/ml Matrigel (Matr), previously cross-linked with 10% glutaraldehyde where indicated (x-linked), for 3 days in complete (Com) or amino acid-free (AA) media, fixed and stained for paxillin (green) and nuclei (blue). Bar, 10 μm. Images were acquired with a Nikon A1 confocal microscope and quantified with Image J. Values are mean ± SEM from 3 independent experiments (the black dots represent the mean of individual experiments). All the raw data associated with this figure are available in S5 Data. CAF, cancer-associated fibroblast; CDM, cell-derived matrix; ECM, extracellular matrix; FAK, focal adhesion kinase.
Fig 6
Fig 6. ECM-dependent cell growth was mediated by tyrosine catabolism.
(A) Metabolomics workflow. MDA-MB-231 cells were plated on plastic or CAF-CDM for 6 days in amino acid-free media. Metabolites were extracted and quantified by non-targeted mass spectrometry. Volcano plot (B), enriched metabolic pathways (C) and changes in amino acid levels (D) are presented. This dataset is deposited in ORDA (https://doi.org/10.15131/shef.data.21608490). (E) Venny diagram and metabolic pathway analysis (F) of the statistically significant up-regulated metabolites in cells plated on 2 mg/ml collagen I (coll I), CAF-CDM, or 3 mg/ml Matrigel under amino acid starvation for 6 days. (G) Schematic, phenylalanine catabolism. (H–J) Metabolites were prepared as in (A), or in the presence of 2 μm FRAX597, and the levels of phenylalanine, tyrosine, and fumarate were measured by targeted mass spectrometry. (K, L) MDA-MB-231 cells were plated on CAF-CDM, transfected with siRNA targeting HPD (HPD siRNA), siRNA targeting HPDL (HPDL siRNA), or non-targeting siRNA control (Nt siRNA) and cultured under amino acid (AA) starvation for 6 days. Cells were fixed and stained with Hoechst 33342. Images were collected by ImageXpress micro and analysed by MetaXpress software. (M) MDA-MB-231 CRSPRi cells were plated on CAF-CDM, transfected with a synthetic guide RNA targeting HPDL (HPDL sgRNA) and a non-targeting synthetic guide RNA control (Nt sgRNA) and analysed as in (L). (N) MDA-MB-231 cells were grown on CAF-CDM under amino acid (AA) starvation for 4 days in the presence of 40 μm Nitisinone (Nitis) and analysed as in (L). *p < 0.05, ***p < 0.001, ****p < 0.0001 two-way ANOVA, Tukey’s multiple comparisons test (H, I), Mann–Whitney test (N, M) or Kruskal–Wallis, Dunn’s multiple comparisons test (L). (O–R) 943 breast cancer patients were stratified into low and high HPDL expressors based on median gene expression. The Kaplan–Meier analysis compared OS, DMFS, RFS, and PPS of patients with tumours expressing high levels of HPDL (red), with those expressing low HPDL levels (black). The numerical data associated with this figure are available in S6 Data. CAF, cancer-associated fibroblast; CDM, cell-derived matrix; DMFS, distant metastasis-free survival; ECM, extracellular matrix; HPDL, p-hydroxyphenylpyruvate hydroxylase-like protein; OS, overall survival; RFS, relapse-free survival.
Fig 7
Fig 7. Tyrosine catabolism supported cell growth in 3D systems.
(A) Schematic, ECM uptake in 3D spheroids. (B) MDA-MB-231 cell spheroids were generated by the hanging drop method, embedded in 3 mg/ml pH-rodo labelled collagen I and geltrex (50:50) mixture for 2 days, starved of amino acid (AA) or kept in complete media (Com) for 2 days and imaged live with a Nikon A1 confocal microscope. Representative images of whole spheroids and higher magnification of the invasive front are shown. Scale bar, 132 μm and 42 μm, respectively. Values are mean ± SD from 3 independent experiments, ****p < 0.0001 two-way ANOVA, Tukey’s multiple comparisons test. (C) MDA.MB-231 cell spheroids were generated as in (B) in unlabelled 3 mg/ml collagen I and Geltrex (50:50) mixture, starved in amino acid-free (AA) media for 5 days, incubated with EdU for 1 day, fixed and stained with Hoechst 33342 and Click iT EdU imaging kit at day 6. The percentage of EdU-positive cells was measured with Image J. Values are mean ± SEM from 3 independent experiments *p = 0.0286 Mann–Whitney test. All the raw data associated with this figure are available in S7 Data. ECM, extracellular matrix.
Fig 8
Fig 8. Tyrosine catabolism supported cell migration and invasion in 3D systems.
(A–C) MDA-MB-231 cells, transfected with siRNA targeting PAK1 (PAK1 siRNA), HPDL (HPDL siRNA), or a non-targeting siRNA control (Nt siRNA) when indicated, where plated on CAF-CDM for at least 4 h, treated with 3 μm FRAX597 (FRAX) or 40 μm Nitisinone (Nitis) and imaged for 16 h by time lapse microscopy. Arrowheads indicate elongated pseudopods. Bar, 30 μm. Pseudopod elongation was measured with Image J. Values are from 3 independent experiments, ****p < 0.0001 Kruskal–Wallis, Dunn’s multiple comparisons test. (D–F) GFP-MDA-MB-231 cell spheroids were generated by the hanging drop method, embedded in 3 mg/ml collagen I and geltrex (50:50) mixture. Cells were transfected or spheroids were treated as in A–C, starved of amino acid and imaged live with a Nikon A1 confocal microscope. Invasion area was calculated with Image J, by subtracting the core area from the total spheroid area. Values are mean ± SEM from 3 independent experiments, **p < 0.01; ***p < 0.001; ****p < 0.0001 Kruskal–Wallis, Dunn’s multiple comparisons test. All the raw data associated with this figure are available in S9 Data. CAF, cancer-associated fibroblast; CDM, cell-derived matrix; HPDL, p-hydroxyphenylpyruvate hydroxylase-like protein.
Fig 9
Fig 9. Working model.
Invasive breast cancer cells internalised ECM components through PAK1-mediated macropinocytosis, resulting in ECM lysosomal degradation. This up-regulated phenylalanine/tyrosine catabolism, leading to an HPDL-dependent increased production of fumarate, supporting cell proliferation and invasive cell migration under amino acid starvation. ECM, extracellular matrix; HPDL, p-hydroxyphenylpyruvate hydroxylase-like protein; PM, plasma membrane; Lys, lysosome; Mitoc, mitochondria.

References

    1. Cowell CF, Weigelt B, Sakr RA, Ng CK, Hick J, King TA, et al.. Progression from ductal carcinoma in situ to invasive breast cancer: revisited. Mol Oncol. 2013;7:859–869. doi: 10.1016/j.molonc.2013.07.005 - DOI - PMC - PubMed
    1. Provenzano PP, Inman DR, Eliceiri KW, Knitter JG, Yan L, Rueden CT, et al.. Collagen density promotes mammary tumor initiation and progression. BMC Med. 2008;6:11. doi: 10.1186/1741-7015-6-11 - DOI - PMC - PubMed
    1. Kim SH, Lee HY, Jung SP, Kim S, Lee JE, Nam SJ, et al.. Role of secreted type i collagen derived from stromal cells in two breast cancer cell lines. Oncol Lett. 2014;8:507–512. doi: 10.3892/ol.2014.2199 - DOI - PMC - PubMed
    1. Hanahan D, Coussens LM. Accessories to the crime: functions of cells recruited to the tumor microenvironment. Cancer Cell. 2012;21:309–322. doi: 10.1016/j.ccr.2012.02.022 - DOI - PubMed
    1. Bergamaschi A, Tagliabue E, Sorlie T, Naume B, Triulzi T, Orlandi R, et al.. Extracellular matrix signature identifies breast cancer subgroups with different clinical outcome. J Pathol. 2008;214:357–367. doi: 10.1002/path.2278 - DOI - PubMed