. 2024 Jan 16;19(1):e0294187.
doi: 10.1371/journal.pone.0294187. eCollection 2024.

TET3 is a positive regulator of mitochondrial respiration in Neuro2A cells

Affiliations

TET3 is a positive regulator of mitochondrial respiration in Neuro2A cells

Valeria Leon Kropf et al. PLoS One. .

Erratum in

Abstract

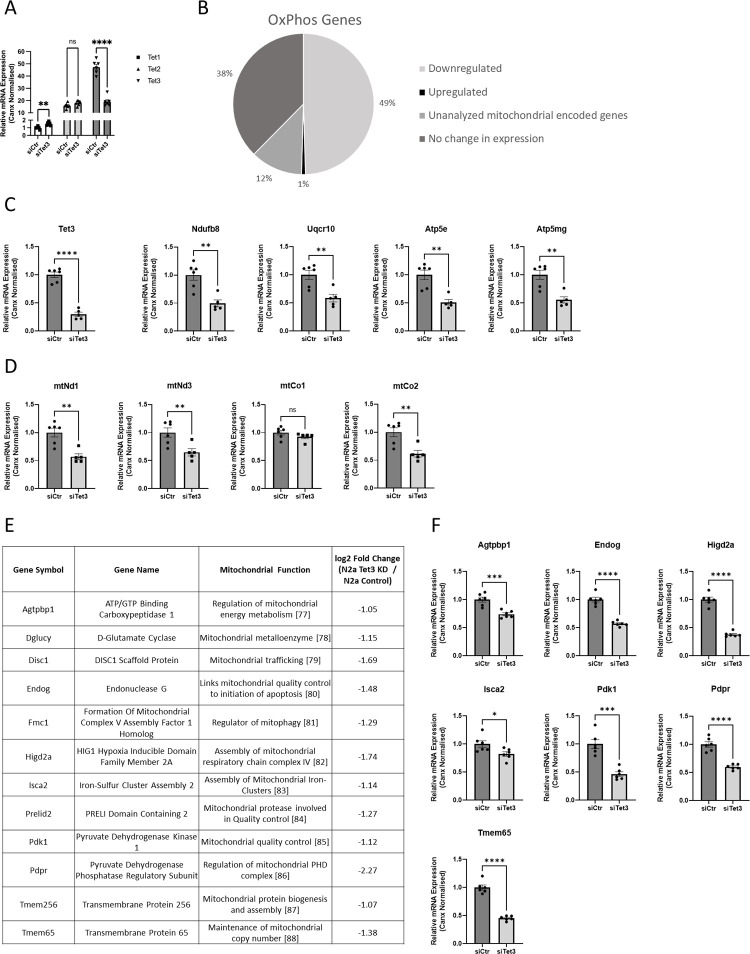
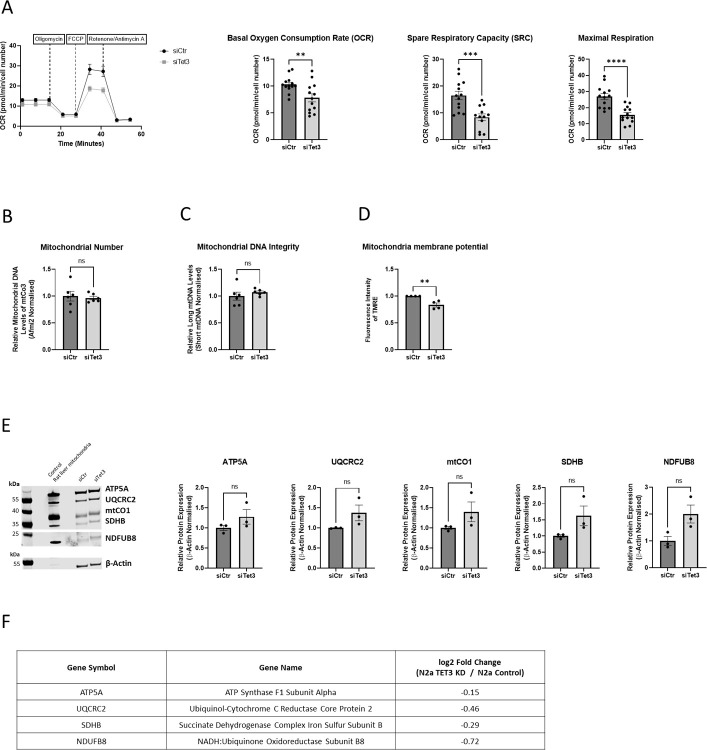
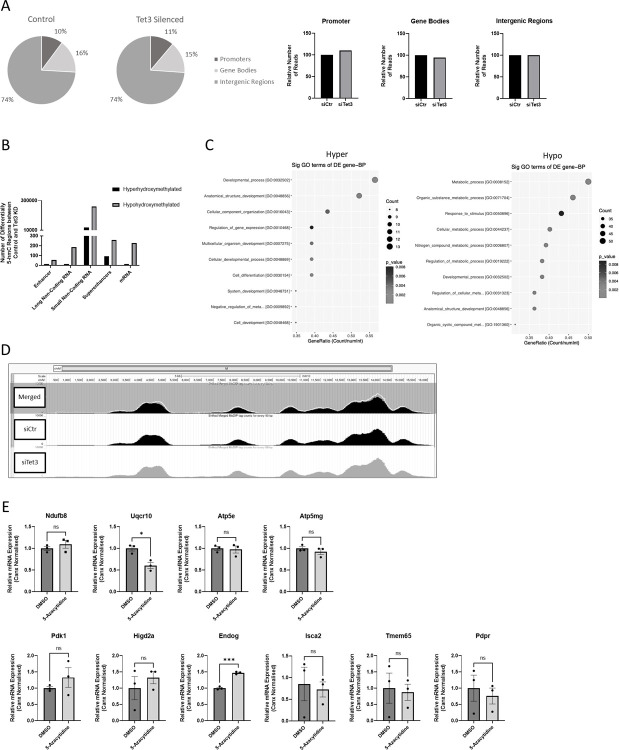
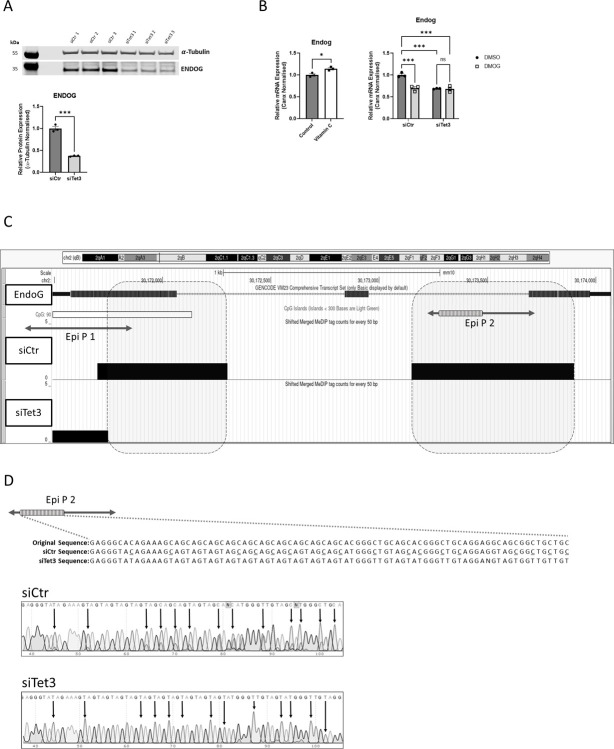
Ten-Eleven-Translocase (TET) enzymes contribute to the regulation of the methylome via successive oxidation of 5-methyl cytosine (5mC) to derivatives which can be actively removed by base-excision-repair (BER) mechanisms in the absence of cell division. This is particularly important in post-mitotic neurons where changes in DNA methylation are known to associate with changes in neural function. TET3, specifically, is a critical regulator of both neuronal differentiation in development and mediates dynamic changes in the methylome of adult neurons associated with cognitive function. While DNA methylation is understood to regulate transcription, little is known of the specific targets of TET3-dependent catalytic activity in neurons. We report the results of an unbiased transcriptome analysis of the neuroblastoma-derived cell line; Neuro2A, in which Tet3 was silenced. Oxidative phosphorylation (OxPhos) was identified as the most significantly down-regulated functional canonical pathway, and these findings were confirmed by measurements of oxygen consumption rate in the Seahorse bioenergetics analyser. The mRNA levels of both nuclear- and mitochondrial-encoded OxPhos genes were reduced by Tet3-silencing, but we found no evidence for differential (hydroxy)methylation deposition at these gene loci. However, the mRNA expression of genes known to be involved in mitochondrial quality control were also shown to be significantly downregulated in the absence of TET3. One of these genes; EndoG, was identified as a direct target of TET3-catalytic activity at non-CpG methylated sites within its gene body. Accordingly, we propose that aberrant mitochondrial homeostasis may contribute to the decrease in OxPhos, observed upon Tet3-downregulation in Neuro2A cells.


Conflict of interest statement

The authors have declared that no competing interests exist.

Figures

Fig 1
Fig 1. Silencing of Tet3 acts to decrease mRNA expression of OxPhos and other mitochondrial-related genes in N2A cells.
(A) Relative mRNA expression of Tet1, Tet2 and Tet3 in N2a cells in which Tet3 was silenced for 72 hours and in negative control siRNA-transfected N2a cells (n = 3). (B) Pie chart showing the percentage of the OxPhos genes which were downregulated, upregulated, unchanged or were not analysed in RNA-seq analyses of these cells. (C) Relative mRNA expression of Tet3 and of nuclear OxPhos or (D) mitochondrial-encoded OxPhos genes as indicated, in Tet3-silenced or control N2A cells (n = 6). (E) Table showing mitochondrial function-associated genes that exhibited > 2-fold downregulation in RNA-seq analyses of N2A cells after Tet3-silencing. (F) Relative mRNA expression of selected mitochondrial function associated genes in Tet3-silenced and control N2a cells (n = 6). mRNA expression levels were determined by Q-PCR and normalised to the expression of Canx in all cases. Quantified data are expressed as mean ± SEM, relative to the negative control siRNA samples. Analysed by an unpaired t-test. ns = not significant, * p<0.05, ** p<0.01, *** p<0.001, ****p<0.0001 [–88].
Fig 2
Fig 2. Silencing of TET3 acted to decrease mitochondrial respiration in N2A cells.
(A) Seahorse SF Mitochondrial Stress Test profile of oxygen consumption rate in N2a cells in which Tet3 was silenced for 72 hours compared to controls. Tet3-silenced cells exhibited reduced basal oxygen consumption rate, spare respiratory capacity and maximal respiration (n = 13 including 3 biological replicates). (B) Mitochondrial number and (C) Mitochondrial DNA integrity in Tet3-silenced, compared to control N2A cells were determined by QPCR (n = 6). (D) Mitochondria potentiation in TET3-silenced and control N2a cells was determined by Fluorescence-activated cell sorting of TMRE-stained cells, normalised to the number of live cells (n = 4). (E) Representative Western blot analyses of OxPhos proteins: ATP5A, UQCRC2, mtCO1, SDHB and NDFUB8 in Tet3-silenced and control N2a cells. Data are shown normalised to the expression of β-Actin (n = 3). To observe NDFUB8 a longer exposure time was carried out. Quantified data are expressed as mean ± SEM, relative to negative control siRNA samples. Analysed by an unpaired t-test ns = not significant, ** p<0.01, *** p<0.001, **** p<0.0001. Although there was no significant change in the expression of any of the individual proteins in E, when taken as a group and analysed by a paired t-test, a significant increase in protein expression upon TET3-depletion was evident (p = 0.02). (F) Table showing change in expression of (nuclear-expressed) OxPhos genes upon Tet3 silencing, as determined by RNA-seq analyses.
Fig 3
Fig 3. TET3 has catalytic activity in N2A cells.
Genomic DNAs from control and (72-hour) Tet3-silenced N2A cells were analysed by hMeDIP-seq (Arraystar). Statistically significant enriched regions (peaks) in each case were annotated by the nearest gene using the UCSC RefSeq database, and their positions were classified as promoter, genebody or intergenic. (A) The proportions of the annotated peaks in promoters, gene bodies and intergenic regions were calculated and were essentially equivalent between the control and TET3-depleted cell groups. (B) Differentially hydroxymethylated regions (DhMRs) which demonstrated statistical significance within the promoter regions of mRNA, and long- and short-non-coding RNAs, and within enhancer and superenhancer associated intergenic regions were identified. Tet3-silencing resulted in significantly less hyperhydroxymethylated (5-hmC-enriched regions) and significantly more hypohrydoxymethylated (less enriched) regions, on all these regulatory elements consistent with a loss of TET3-mediated hydroxymethylation (p≤0.01). (C) Functional BP (Biological Process) classification of genes associated with the hyper- and hypo-hydroxymethylated enhancer and superenhancer regions by Gene Ontology (GO) analysis (10 most significant are depicted). Count; the number of differentially-enriched (DE) genes associated with the listed GOID; GeneRatio: The GOID’s Gene Ratio Value (equal to Count/Total gene list). (D) 5-hmC enrichment in the mitochondrial genome of TET3-silenced and control N2a cells were visualised using UCSC Genome Browser (https://genome.ucsc.edu/). The pattern of enrichment of 5-hmC varies across the mitochondrial genome but is similar between TET3-silenced and control N2a cells. (E) Relative mRNA expression of nuclear-encoded OxPhos genes; NdufbB8, Uqcr10, Atp5e and Atp5mg and mitochondrial-function-associated genes; Pdk1, Higd2a, Endog, Isca2, Tmem65 and Pdpr in N2a cells treated with 5-azaC (1μM) for 72 hours and in vehicle control (DMSO)-treated cells were determined by Q-PCR, normalised to the relative expression of Canx. (n = 3). Quantified data are expressed as mean ± SEM, relative to vehicle control DMSO samples. Analysed by an unpaired t-test. ns = not significant, * p<0.05, *** p<0.001.
Fig 4
Fig 4. EndoG is a catalytic target of TET3.
(A) Relative protein expression of TET3 in N2a cells in which Tet3 was silenced for 72 hours and in negative control siRNA-transfected N2a cells (n = 3). (B) Relative mRNA expression of EndoG in N2a cells treated with vitamin C (50 mM; an activator of 2OGDDs) for 24 hours, compared to control cells and in Tet3-silenced or control N2a cells, both treated with either DMOG (1mM; an inhibitor of 2OGDD enzymes) for 48 hours or vehicle control (DMSO). Levels were determined by Q-PCR, normalised to the relative expression of CANX. (n = 3). Quantified data are expressed as mean ± SEM, relative to vehicle control DMSO and control samples. Analysed by an unpaired t-test and two-way ANOVA with Tukey’s multiple comparison test. ns = not significant, * p<0.05, *** p<0.001. (C) 5-hmC enrichment within the EndoG gene locus was visualised using UCSC Genome Browser (https://genome.ucsc.edu/) on hMeDIP-seq data of Tet3-silenced and control N2a cells. The signals (black lines) represent the extended read counts in every 50bp region. The grey hatched boxes highlight the loss of 5-hmC enrichment (black) between siCtr (middle section) and siTet3 (bottom section) within the EndoG (grey, top section) gene locus in N2a cells. A CpG island is represented with a white box. Enrichment of 5-hmC is lost at the 5’ end over the boundary of the coding region of the first exon and the first intron, including some of the CpG island region and at the 3’ end over the last intron/exon boundary. Locations of the amplicons that were generated and sequenced (EpiP1 and Epi P2) are shown as two-sided arrows. (D) The sequence of a region of Epi P2 after amplification from Tet3-silenced or control N2a cells. 5hmC residues within control, N2A genomic DNAs were protected from deamination by APOBEC, by conversion to glucosylated-hydroxymethylcytosine by treatment with T4 Phage β-glucosyltransferase. The original sequence is depicted. Unprotected cytosines are read as thymine and cytosines partially protected from conversion in the (SiControl) N2A genome are underlined. After Tet3-silencing all cytosines are read as thymine. The absence of any cytosines (indicated by black arrows) in Tet3-silenced N2a cells suggests the presence of 5-hmC in the control N2A cells is lost after Tet3 silencing.

Similar articles

Cited by

References

    1. Moore L.D., Le T., and Fan G., DNA methylation and its basic function. Neuropsychopharmacology, 2013. 38(1): p. 23–38. doi: 10.1038/npp.2012.112 - DOI - PMC - PubMed
    1. Li E. and Zhang Y., DNA methylation in mammals. Cold Spring Harb Perspect Biol, 2014. 6(5): p. a019133. doi: 10.1101/cshperspect.a019133 - DOI - PMC - PubMed
    1. Bhutani N., Burns D.M., and Blau H.M., DNA demethylation dynamics. Cell, 2011. 146(6): p. 866–72. doi: 10.1016/j.cell.2011.08.042 - DOI - PMC - PubMed
    1. Wu X. and Zhang Y., TET-mediated active DNA demethylation: mechanism, function and beyond. Nat Rev Genet, 2017. 18(9): p. 517–534. doi: 10.1038/nrg.2017.33 - DOI - PubMed
    1. Kraus T.F., Guibourt V., and Kretzschmar H.A., 5-Hydroxymethylcytosine, the "Sixth Base", during brain development and ageing. J Neural Transm (Vienna), 2015. 122(7): p. 1035–43. doi: 10.1007/s00702-014-1346-4 - DOI - PubMed