. 2024 Jan 23;121(4):e2315592121.
doi: 10.1073/pnas.2315592121. Epub 2024 Jan 16.

γδ T cell antigen receptor polyspecificity enables T cell responses to a broad range of immune challenges

Affiliations

γδ T cell antigen receptor polyspecificity enables T cell responses to a broad range of immune challenges

Jing Guo et al. Proc Natl Acad Sci U S A. .

Abstract

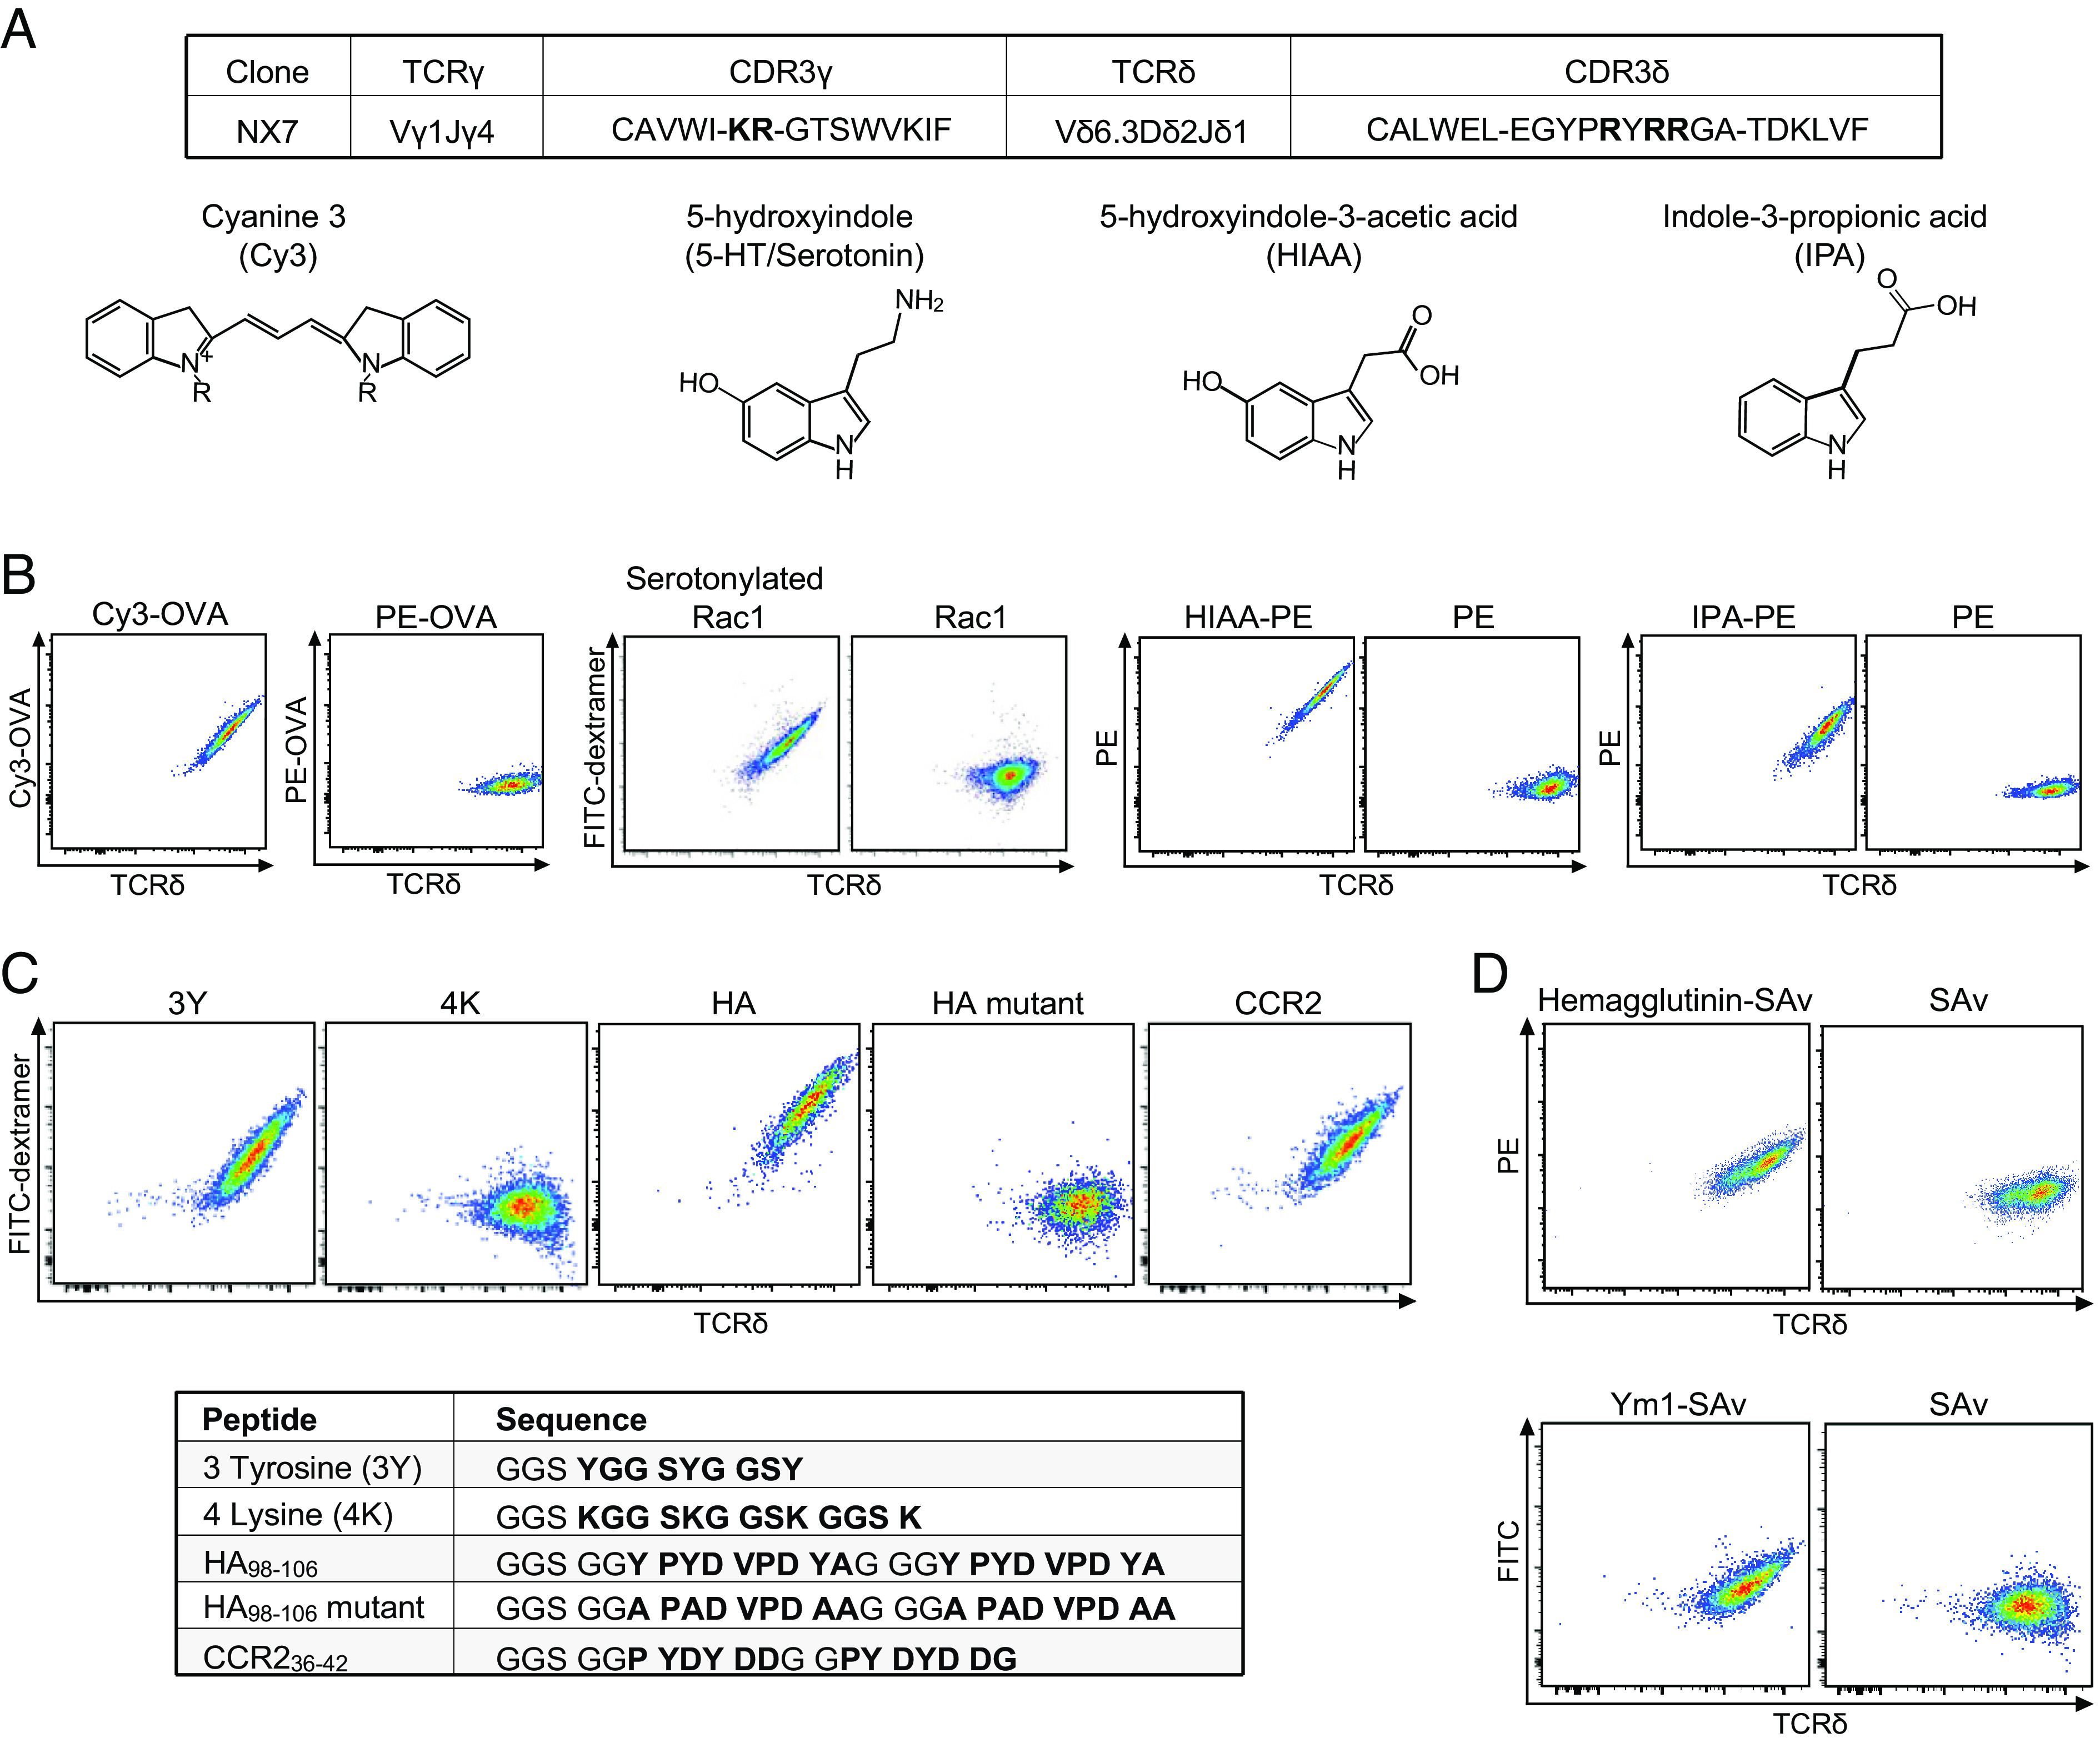
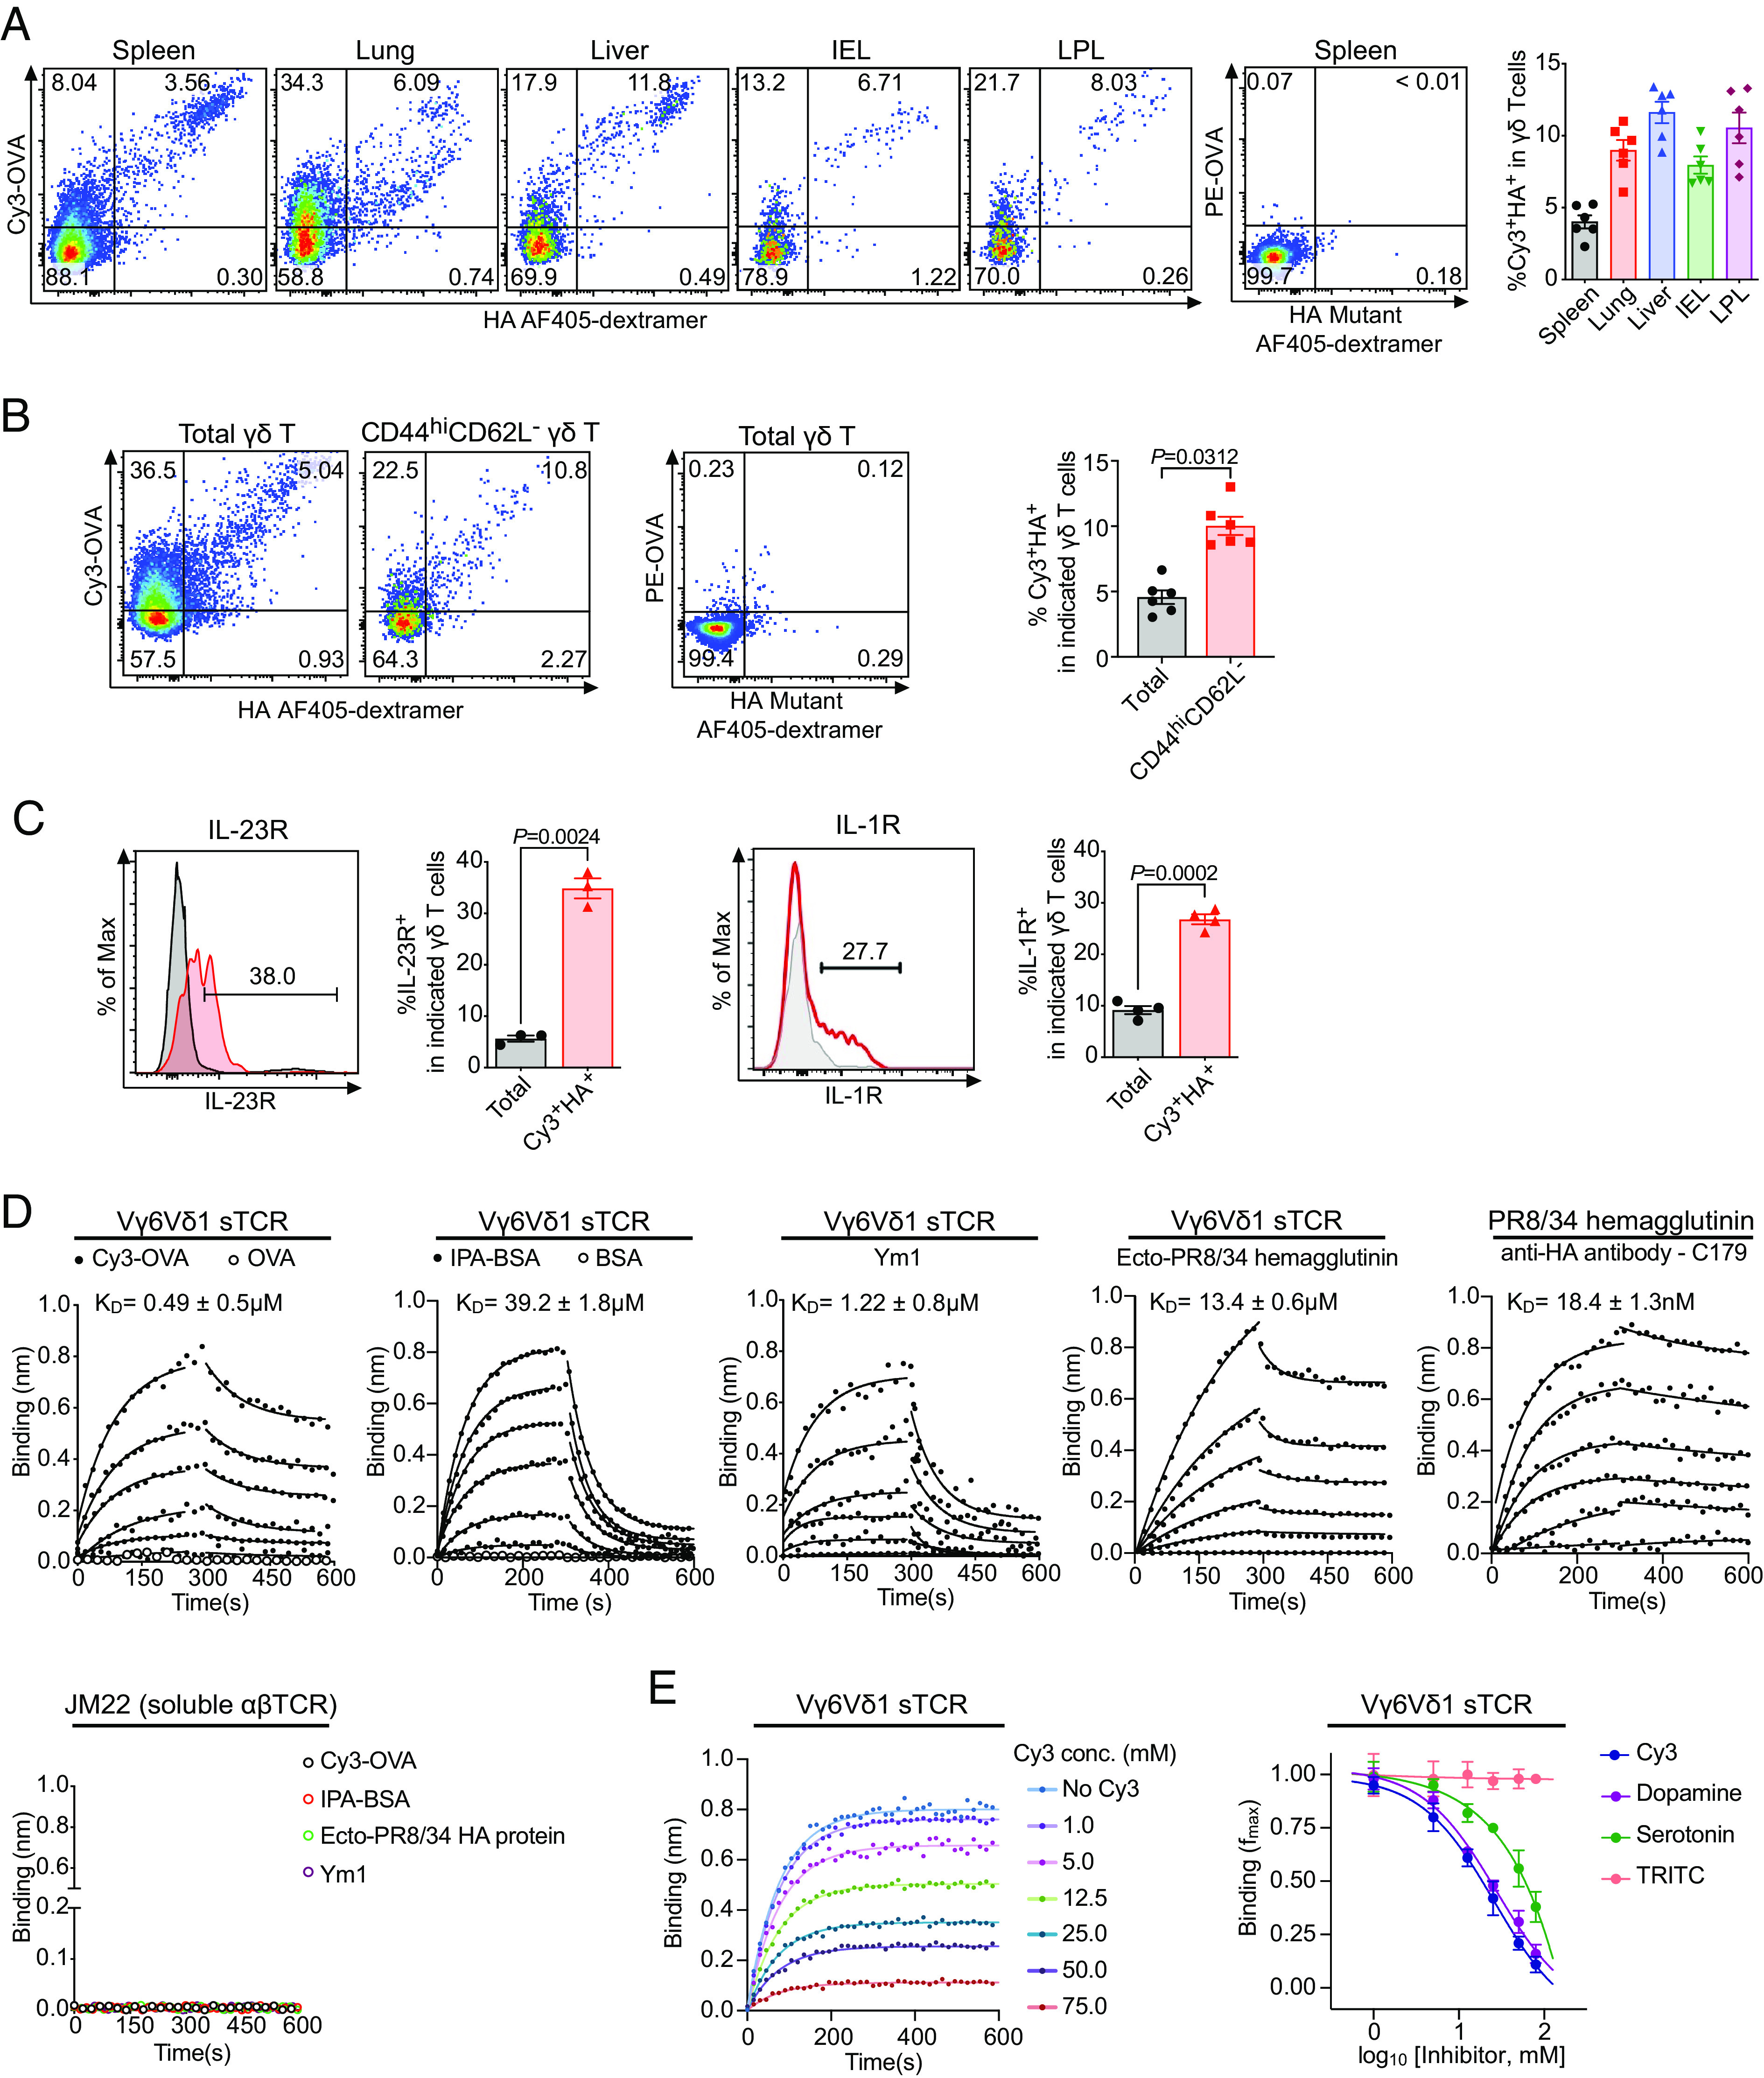
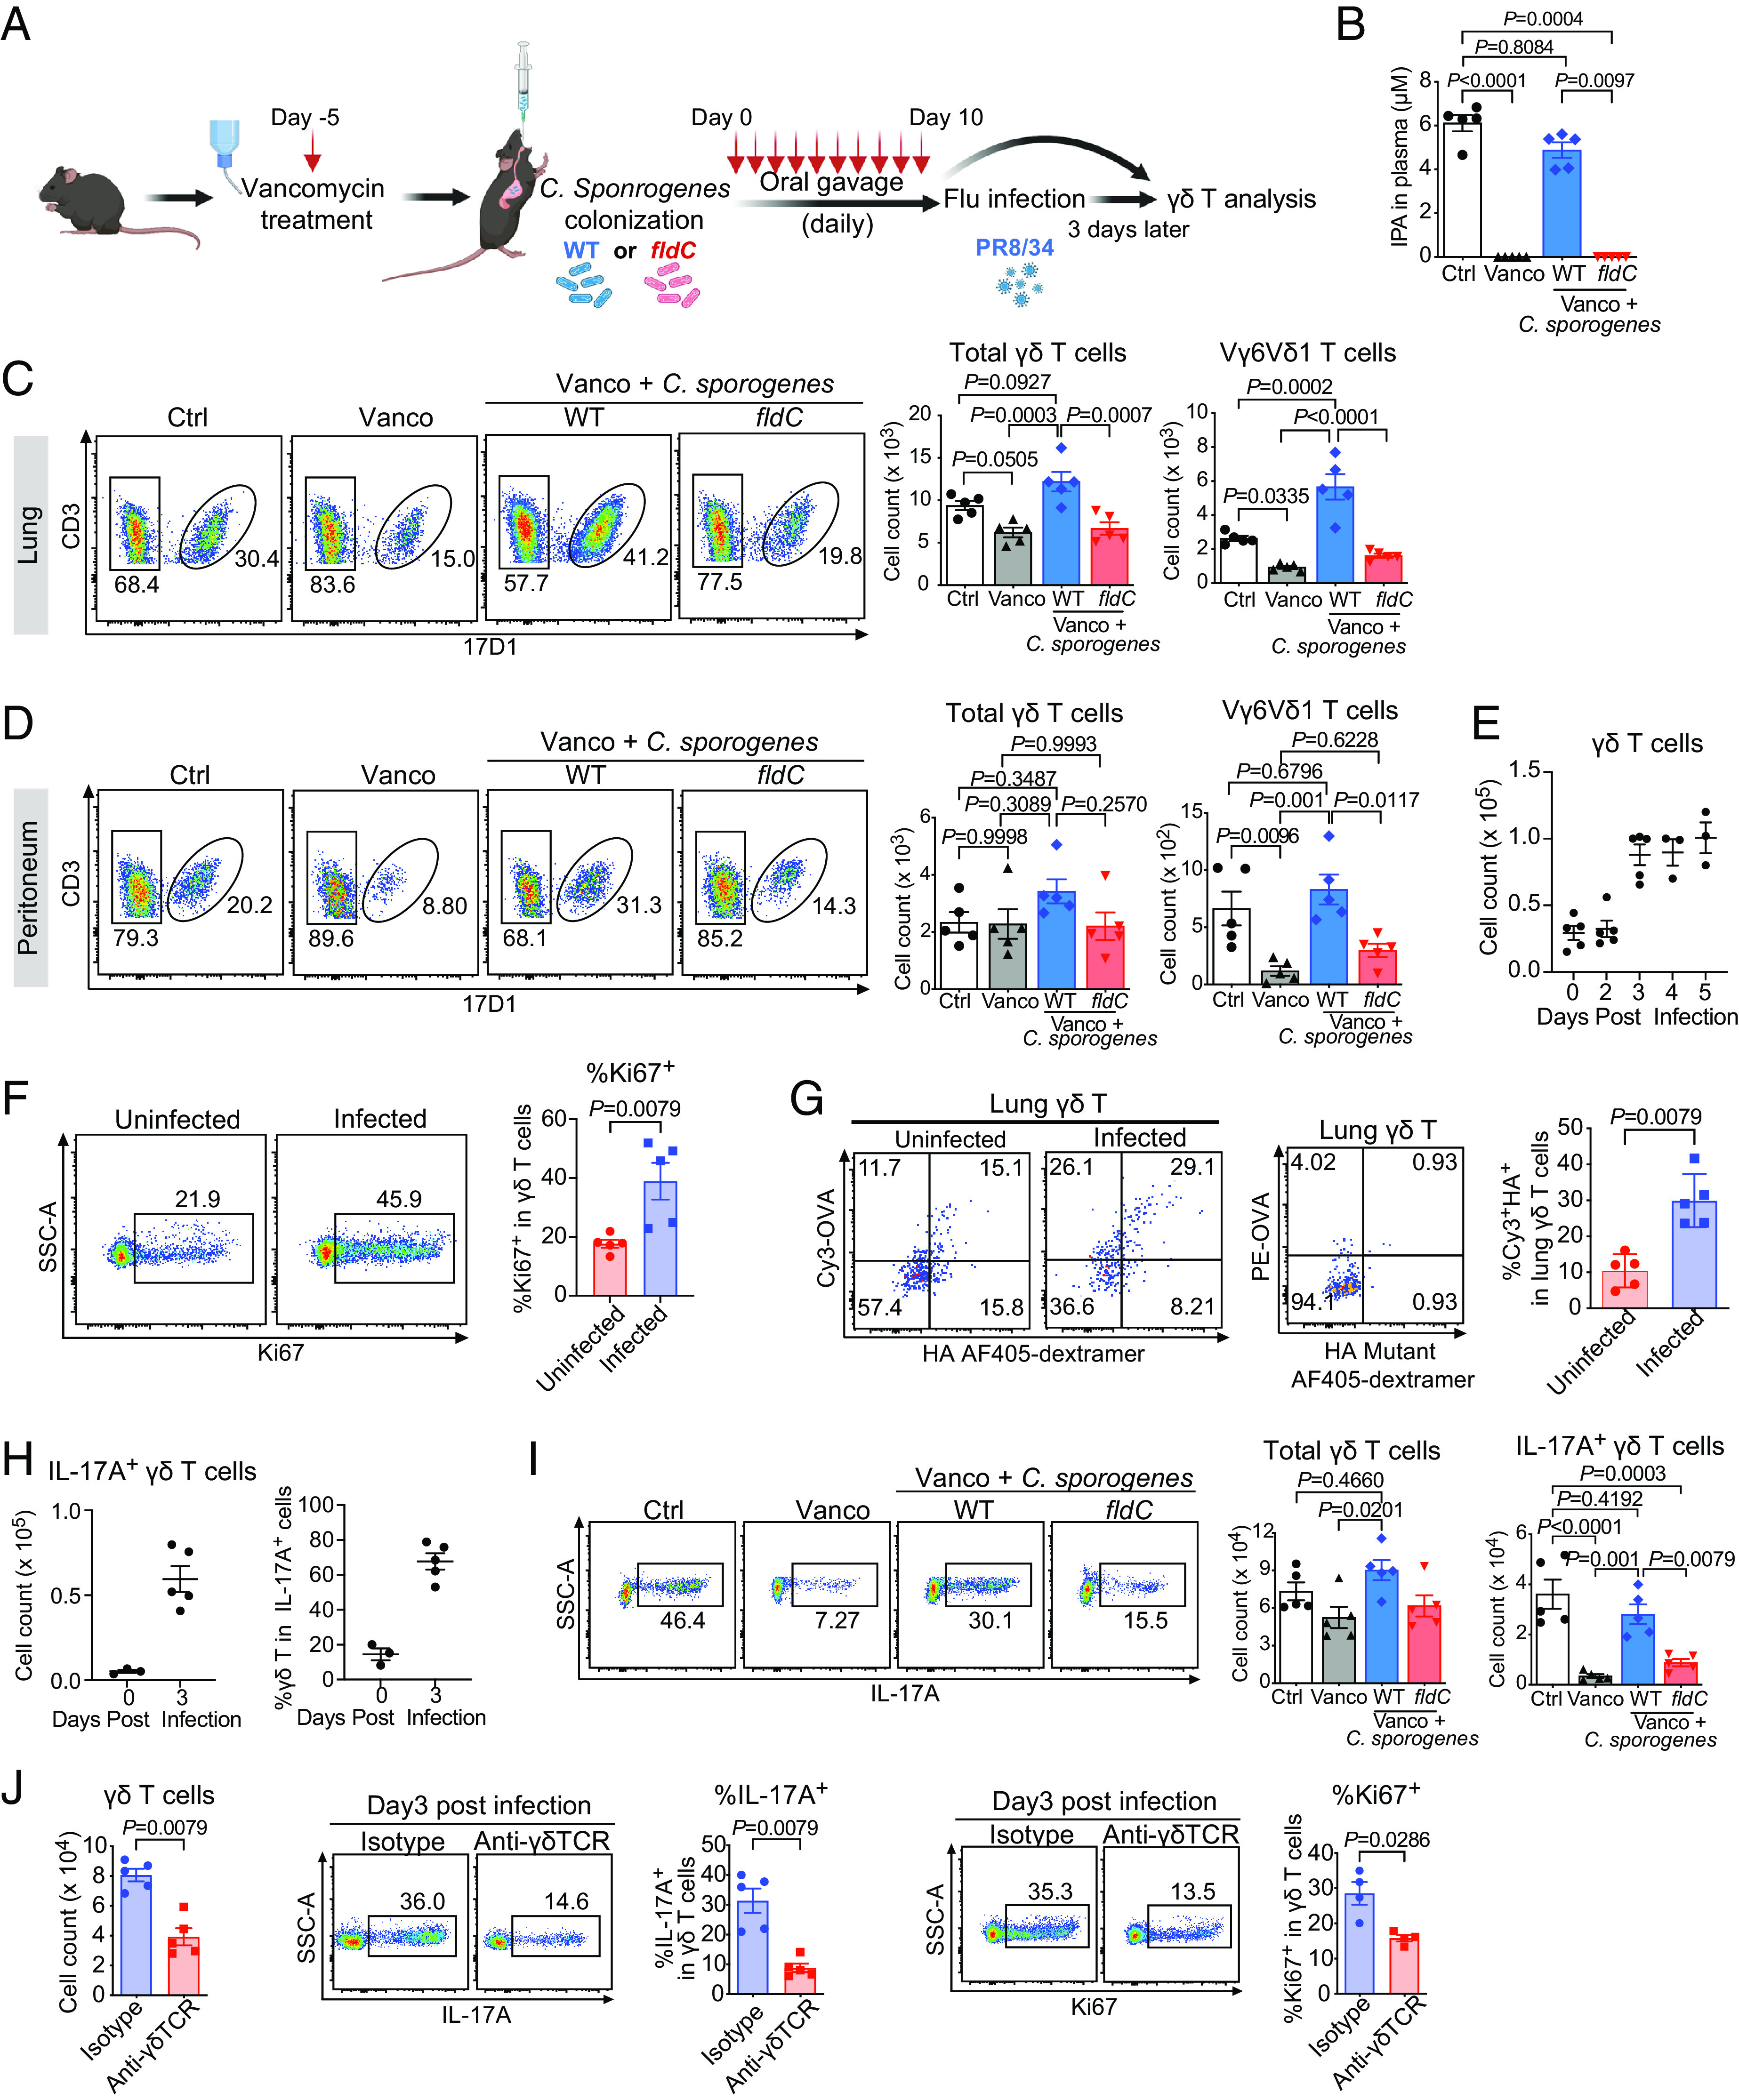
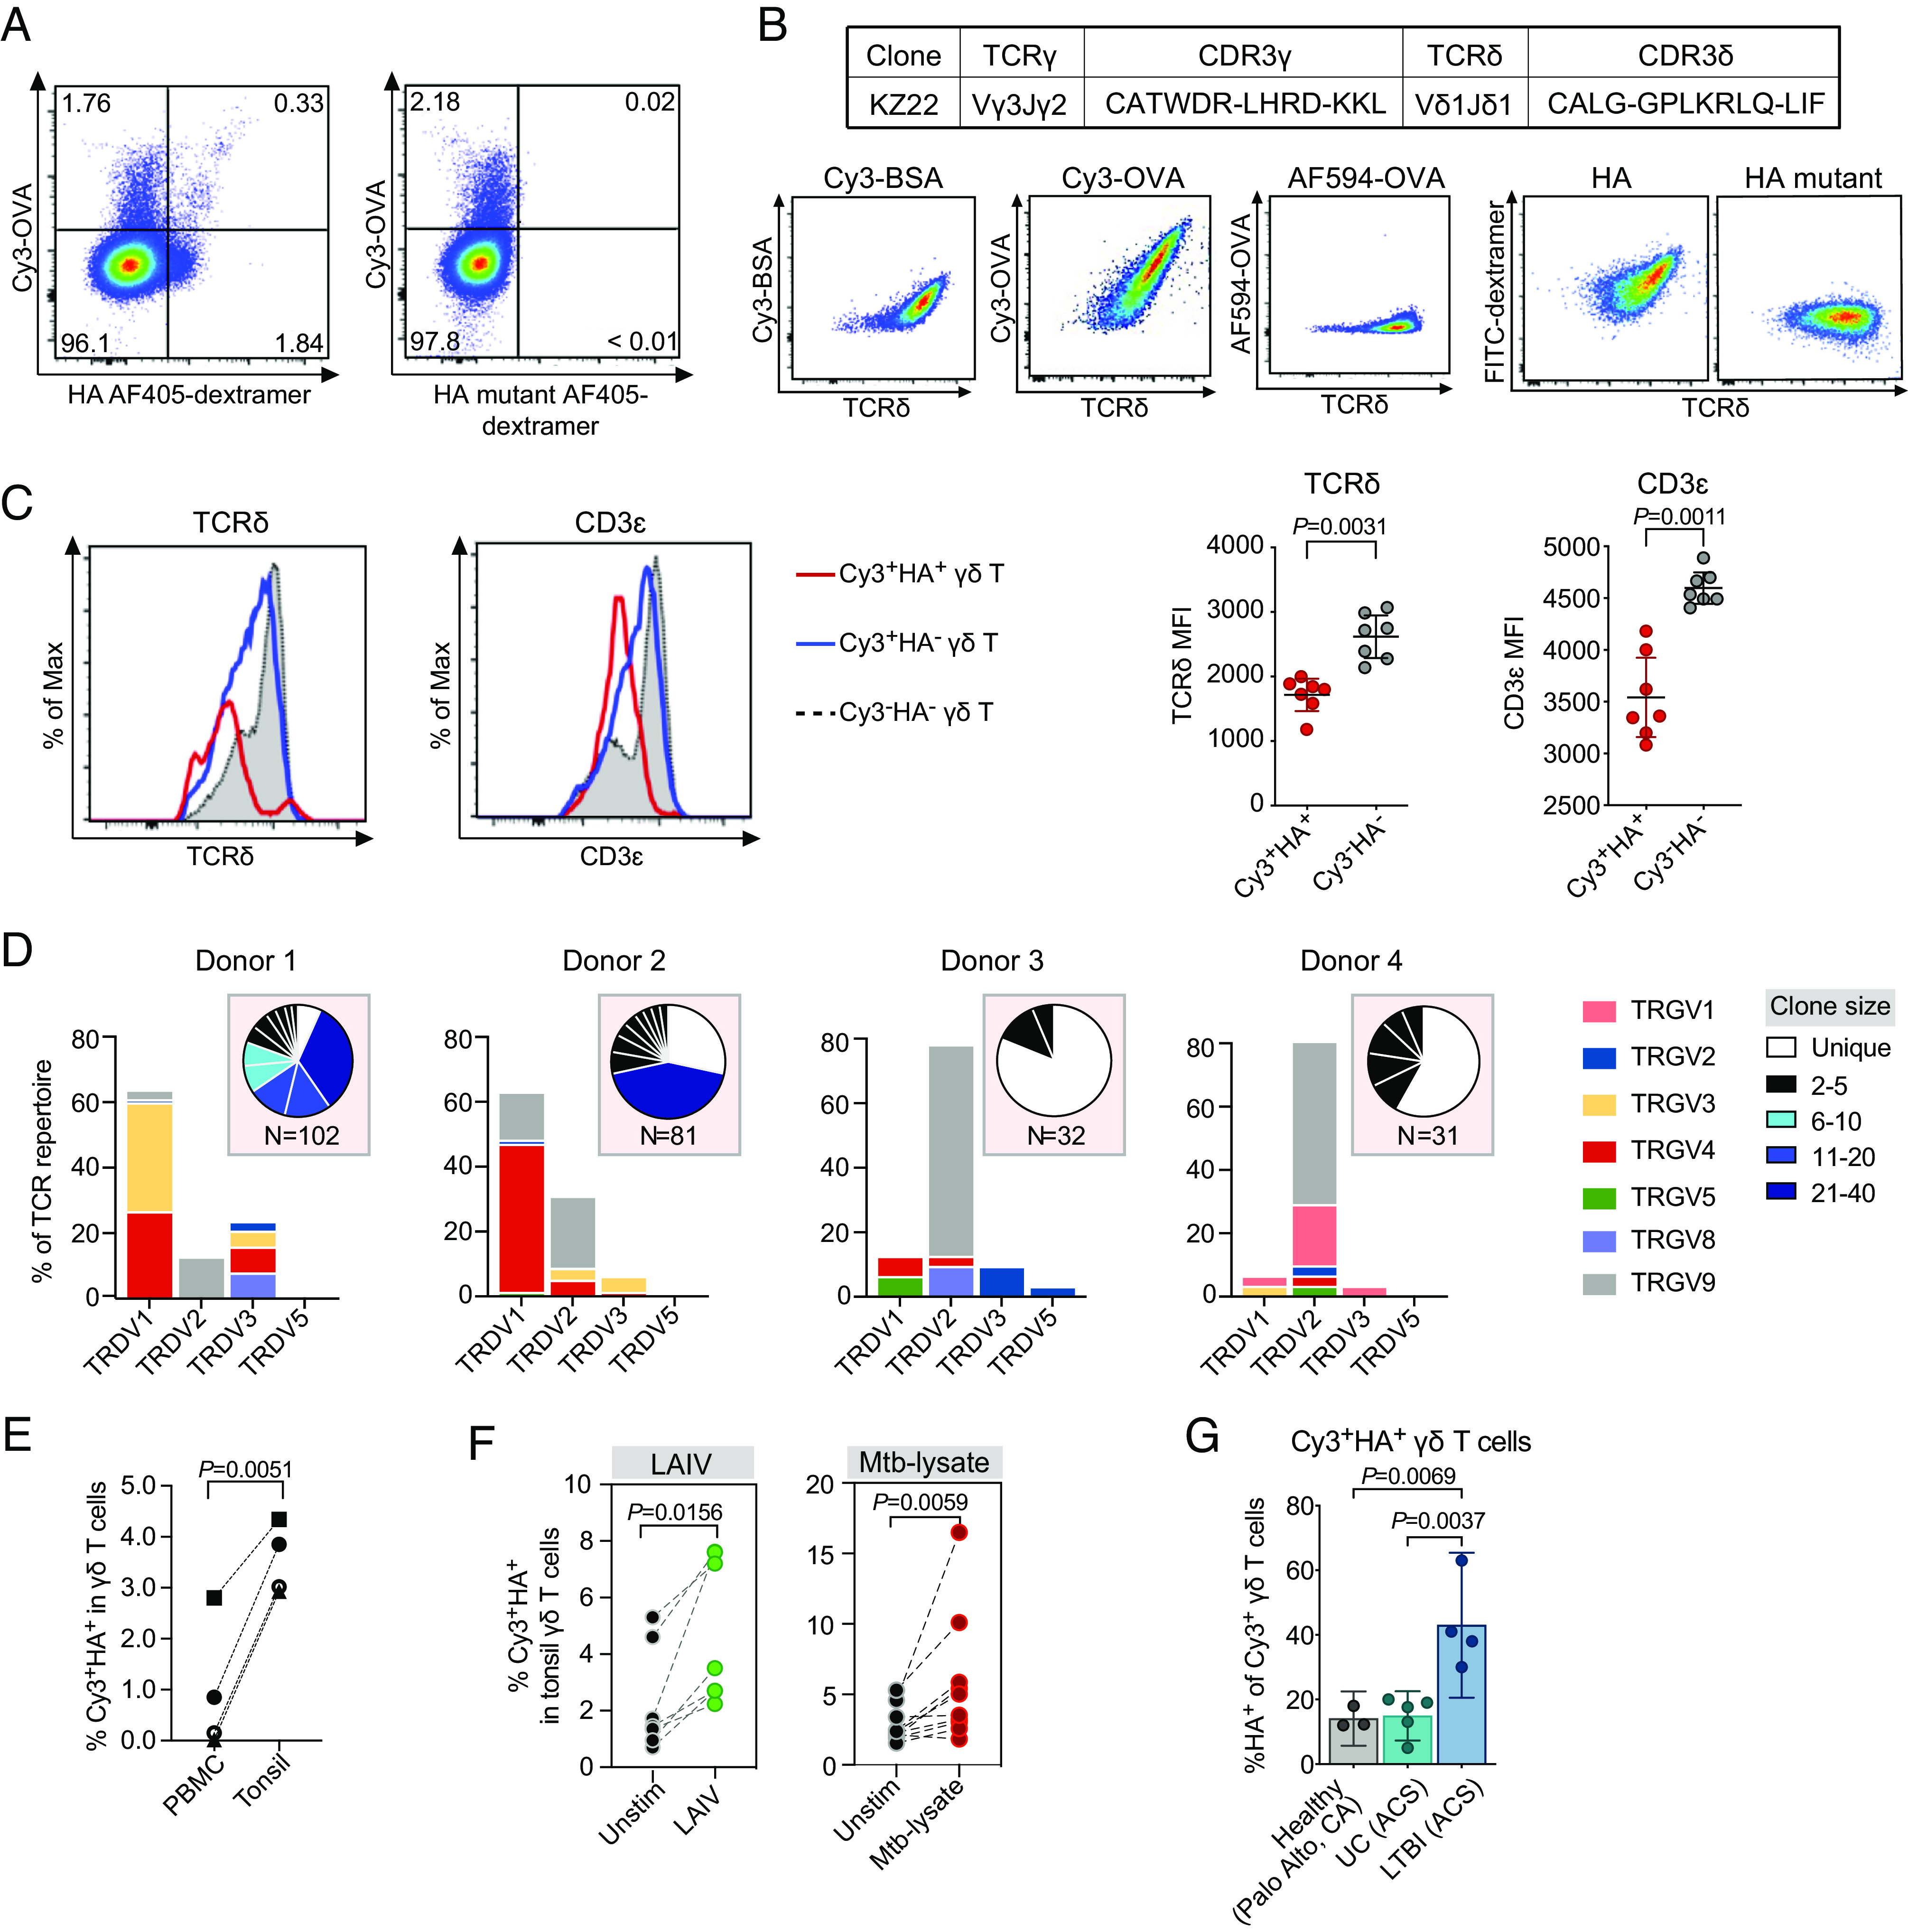
γδ T cells are essential for immune defense and modulating physiological processes. While they have the potential to recognize large numbers of antigens through somatic gene rearrangement, the antigens which trigger most γδ T cell response remain unidentified, and the role of antigen recognition in γδ T cell function is contentious. Here, we show that some γδ T cell receptors (TCRs) exhibit polyspecificity, recognizing multiple ligands of diverse molecular nature. These ligands include haptens, metabolites, neurotransmitters, posttranslational modifications, as well as peptides and proteins of microbial and host origin. Polyspecific γδ T cells are enriched among activated cells in naive mice and the responding population in infection. They express diverse TCR sequences, have different functional potentials, and include the innate-like γδ T cells, such as the major IL-17 responders in various pathological/physiological conditions. We demonstrate that encountering their antigenic microbiome metabolite maintains their homeostasis and functional response, indicating that their ability to recognize multiple ligands is essential for their function. Human γδ T cells with similar polyspecificity also respond to various immune challenges. This study demonstrates that polyspecificity is a prevalent feature of γδ T cell antigen recognition, which enables rapid and robust T cell responses to a wide range of challenges, highlighting a unique function of γδ T cells.

Keywords: antigen receptor poly-specificity; γδ T cell antigen recognition and response; γδ T cells.


Conflict of interest statement

Competing interests statement:The authors declare no competing interest.

Figures

Fig. 1.
Fig. 1.
A Cy3-specific γδ TCR recognizes multiple ligands of different molecular nature. (A) The NX7 γδ TCR CDR3 sequences (with positively charged amino acid residue in bold) and the chemical structures of Cy3, 5-HT (serotonin), HIAA, and IPA. (BD) Representative FACS plots of NX7/58αβ cells stained with (B) Cy3-OVA (1 μg/mL), PE-OVA (3 μg/mL), serotonylated or unmodified Rac1 peptide (Biotin-Ahx-GGS GGD TAG QED GGD TAG QED GGD TAG QED, with the Rac1 sequence in bold. Ahx: 6-aminohexanoic acid.) coupled with FITC SAv-dextramer (0.45 μM, SAv concentration), HIAA-PE (1 μg/mL) or PE (1 μg/mL), IPA-PE (10 μg/mL) or PE (10 μg/mL); (C) biotinylated 3-tyrosine peptide (3Y), 4-lysine peptide (4K), HA98-106 peptide (abbreviated as HA), HA98-106 mutant peptide (abbreviated as HA mutant), and murine CCR236-42 peptide (abbreviated as CCR2) coupled with FITC SAv-dextramer (0.45 μM, SAv concentration). The peptide sequences were shown in bold; (D) surface cleaved hemagglutinin protein-coupled PE SAv tetramer (2 μM, SAv concentration) or PE-labeled SAv (2 μM, SAv concentration), Ym1 protein-coupled FITC SAv tetramer (10 μM, SAv concentration) or FITC labeled SAv (10 μM, SAv concentration). Hemagglutinin and Ym1 were randomly biotinylated. The results in BD were representative of at least three independent experiments.
Fig. 2.
Fig. 2.
Polyspecific γδ T cells are enriched in activated cells in naive mice and include the innate-like Vγ6Vδ1 cells. (AC) A representative FACS plot of (A) Cy3 and HA staining of total γδ T cells from spleen, lung, liver, intestinal epithelium (IEL), and lamina propria (LPL) of naive C57BL/6 mice (Left), PE-OVA and HA mutant staining of splenic γδ T cells (Middle), and the frequencies of Cy3+HA+ cells among total γδ T cells in each organ (Right). (B) Cy3 and HA staining of total γδ T and CD44hiCD62L- γδ T cells from spleens of naive C57BL/6 mice (Left), PE-OVA and HA mutant staining of splenic γδ T cells (Middle), and the frequencies of Cy3+HA+ cells among indicated γδ T cells (Right); (C) IL-23R staining on total γδ T cells (gray line) and Cy3+HA+ γδ T cells (red line) from the spleen of naive IL-23R reporter mice (Top) and IL-1R staining on total γδ T cells (gray line) and Cy3+HA+ γδ T cells (red line) from the spleen of naive C57BL/6 mice (Bottom), and the percentage of IL-23R+ and IL-1R+ cells in total γδ T cells and Cy3+HA+ γδ T cells. Enriched γδ T cells from each organ were stained with Cy3-OVA (2 μg/mL), PE-OVA (2 μg/mL), HA coupled AF405-dextramer (1.35 μM), and HA mutant coupled AF405-dextramer (1.35 μM). Each data point represented the result from an individual mouse. Summary results are graphed as the mean ± SEM. The P values in C were determined using a two-tailed, paired t test. (D) Binding kinetics and dissociation constants (KD) of soluble Vγ6Vδ1 TCR with Cy3-OVA, OVA, IPA-BSA (indole-3-propionic acid conjugated bovine serum albumin), BSA, Ym1, and the fusion-competent ectodomain of influenza virus A/PR8/34 (Ecto-PR8/34) hemagglutinin as determined by biolayer interferometry (BLI). The conformation of the fusion-competent ectodomain of PR/34 HA was confirmed by the binding of HA conformation-specific antibody, C179, as control. Graphs showed overlays of binding traces at 20 μM followed by twofold dilutions of the analytes with the Vγ6Vδ1 TCR, and binding traces at 100 nM followed by twofold dilutions of the analyte with C179 binding. The data points were represented as circles, and the fits were indicated by solid lines. An irrelevant αβ TCR JM22 was served as control. The data shown were representative traces from one of three independent experiments. (E) Representative traces of Ym1 binding to soluble Vγ6Vδ1 TCR in the presence of increasing concentration of Cy3 (Left) and the competition of Ym1 binding to soluble Vγ6Vδ1 TCR in the presence of increasing concentration of Cy3 (Left) and by indicated small molecules (Right) as determined by biolayer interferometry. The fractional reduction in maximal Ym1 binding (fmax) as a function of increasing concentration of the indicated small molecules was plotted. As shown, the negative control TRITC (Tetramethylrhodamine) did not inhibit Ym1 binding. Mean ± SD was shown for three independent experiments.
Fig. 3.
Fig. 3.
Commensal microbiota metabolite IPA maintains polyspecific innate-like Vγ6Vδ1 T cell homeostasis and response to infection. (A) Schematic of the experiment: C57BL/6 mice were treated with vancomycin, followed by WT or fldC mutant C. sporogenes colonization. Mice were either analyzed directly after bacteria colonization (C and D) or subjected to influenza virus infection and analyzed on day 3 after infection (I). (B) Plasma IPA level from mice of indicated groups as determined by liquid chromatography-mass spectrometry (LC–MS) measurement. Ctrl: mice without treatment, Vanco: mice treated with vancomycin, Vanco + C. sporogenes: mice treated with vancomycin followed by WT or fldC mutant C. sporogenes colonization. (C and D) A representative FACS plot of 17D1 (which identifies Vγ6Vδ 1 γδ T cells) staining of (C) lung and (D) peritoneal γδ T cells (Left), and the summary of total lung γδ T cell (Middle) and Vγ6Vδ1 (17D1+) γδ T cell (Right) numbers from vancomycin-treated mice after WT or fldC mutant C. sporogenes colonization. (E) Cell counts of γδ T cells in the lungs of C57BL/6 mice at indicated days after influenza virus infection. (F) A representative FACS plot of Ki67 staining (Left) and the summary of Ki67+ cell frequencies (Right) of lung γδ T cells from uninfected and influenza virus-infected mice at Day 3 after infection. (G) A representative FACS plot of Cy3 and HA staining of lung γδ T cells from uninfected and influenza virus-infected mice at Day 3 after infection (Left), PE-OVA and HA mutant staining of lung γδ T cells (Middle), and the frequencies of Cy3+HA+ cells among total γδ T cells in indicated groups (Right). Enriched lung γδ T cells were stained with Cy3-OVA (2 μg/mL), PE-OVA (2 μg/mL), HA coupled AF405-dextramer (1.35 μM), and HA mutant coupled AF405-dextramer (1.35 μM). (H) Cell counts of IL-17A-producing γδ T cells (Left) and the percentage of γδ T cells in total IL-17A+ cells (Right) in the lungs of C57BL/6 mice at indicated days after influenza virus infection. (I) A representative FACS plot of lung IL-17A+ γδ T cells (Left) and the summary of total γδ T and IL-17A+ γδ T cell numbers (Right) from mice treated as indicated in (A) followed by influenza virus infection for 3 d. (J) Cell counts of total lung γδ T cells (Left), and FACS analysis of IL-17A (Middle) and Ki67 (Right) staining of lung γδ T cells from isotype or anti-γδTCR (GL3) antibody treated TCRδ-GFP mice at day 3 after influenza virus infection. GFP+ cells were gated as γδ T cells. Results were shown as the mean ± SEM. Each data point represented the result from one mouse. The P values in BD and I were determined using one-way ANOVA with Tukey’s multiple comparisons test. The P values in F, G, and J were determined using the Mann–Whitney test. The results were representative of at least 2 independent experiments.
Fig. 4.
Fig. 4.
Human polyspecific γδ T cells respond to immune challenges. (A) A representative FACS plot of peripheral blood γδ T cells from a healthy donor stained with Cy3-OVA (60 μg/mL) and AF405 labeled SAv-dextramer coupled HA (Left) or HA mutant peptide (Right) (0.45 μM, SAv concentration). (B) The CDR3 sequences of KZ22 γδ TCR and FACS analysis of KZ22/Jurkat β cells stained with Cy3-BSA (5 μg/mL), Cy3-OVA (1 μg/mL), Alexa Fluor 594-OVA (1 μg/mL), and FITC labeled SAv-dextramer (0.45 μM, SAv concentration) coupled with HA or HA mutant peptides. The results were representative of at least three independent experiments. (C) Representative histograms comparing the expression levels of CD3ε and TCRδ on indicated γδ T cells. The results are representative of at least 3 independent experiments (Left). The mean fluorescent intensities (MFI) of CD3ε and TCRδ expression across different donors (Right). The P values were determined using the paired t test. Normality was assessed using the Shapiro–Wilk test. Error bars represented mean and 95% CI. (D) TCR V gene usage of Cy3+HA+ γδ T cells isolated from four blood bank PBMC samples and their corresponding clonal expansions, indicated in pie charts. (E) Frequency of Cy3+HA+ γδ T cells in total γδ T cells from PBMCs and tonsils of the same donor. The P values were determined using the paired t test. Normality was assessed using the Shapiro–Wilk test. (F) Frequency of Cy3+HA+ γδ T cells in tonsil organoids unstimulated or stimulated with LAIV (Left) or Mtb-lysate (Right). The P values were determined using the nonparametric Wilcoxon rank-sum test. (G) Frequency of Cy3+HA+ cells in local healthy donors and uninfected (UC) and Mtb-infected donors from a South African adolescent cohort (ACS). Cy3+ γδ T cells were gated to analyze the percentage of HA+ cells. Error bars represented mean and 95% CI. The P values were determined using one-way ANOVA with Tukey’s multiple comparisons test.

Comment in

References

    1. Chien Y. H., Meyer C., Bonneville M., gammadelta T cells: First line of defense and beyond. Annu. Rev. Immunol. 32, 121–155 (2014). - PubMed
    1. Ribot J. C., Lopes N., Silva-Santos B., γδ T cells in tissue physiology and surveillance. Nat. Rev. Immunol. 21, 221–232 (2020). - PubMed
    1. Mann A. O., et al. , IL-17A-producing gammadeltaT cells promote muscle regeneration in a microbiota-dependent manner. J. Exp. Med. 219, e20211504 (2022). - PMC - PubMed
    1. Fujikado N., et al. , Aire inhibits the generation of a perinatal population of interleukin-17A-producing gammadelta T cells to promote immunologic tolerance. Immunity 45, 999–1012 (2016). - PMC - PubMed
    1. Papotto P. H., Reinhardt A., Prinz I., Silva-Santos B., Innately versatile: Gammadelta17 T cells in inflammatory and autoimmune diseases. J. Autoimmun. 87, 26–37 (2018). - PubMed