. 2024 May 1;14(5):752-765.
doi: 10.1158/2159-8290.CD-23-0700.

TREX1 Inactivation Unleashes Cancer Cell STING-Interferon Signaling and Promotes Antitumor Immunity

Affiliations

TREX1 Inactivation Unleashes Cancer Cell STING-Interferon Signaling and Promotes Antitumor Immunity

Tetsuo Tani et al. Cancer Discov. .

Abstract

A substantial fraction of cancers evade immune detection by silencing Stimulator of Interferon Genes (STING)-Interferon (IFN) signaling. Therapeutic reactivation of this program via STING agonists, epigenetic, or DNA-damaging therapies can restore antitumor immunity in multiple preclinical models. Here we show that adaptive induction of three prime exonuclease 1 (TREX1) restrains STING-dependent nucleic acid sensing in cancer cells via its catalytic function in degrading cytosolic DNA. Cancer cell TREX1 expression is coordinately induced with STING by autocrine IFN and downstream STAT1, preventing signal amplification. TREX1 inactivation in cancer cells thus unleashes STING-IFN signaling, recruiting T and natural killer (NK) cells, sensitizing to NK cell-derived IFNγ, and cooperating with programmed cell death protein 1 blockade in multiple mouse tumor models to enhance immunogenicity. Targeting TREX1 may represent a complementary strategy to induce cytosolic DNA and amplify cancer cell STING-IFN signaling as a means to sensitize tumors to immune checkpoint blockade (ICB) and/or cell therapies.

Significance: STING-IFN signaling in cancer cells promotes tumor cell immunogenicity. Inactivation of the DNA exonuclease TREX1, which is adaptively upregulated to limit pathway activation in cancer cells, recruits immune effector cells and primes NK cell-mediated killing. Targeting TREX1 has substantial therapeutic potential to amplify cancer cell immunogenicity and overcome ICB resistance. This article is featured in Selected Articles from This Issue, p. 695.


Conflict of interest statement

Declaration of Interest

D.A.B. is a consultant for N of One/Qiagen and Nerviano Medical Sciences, is a founder and shareholder in Xsphera Biosciences, has received honoraria from Merck, H3 Biomedicine/Esai, EMD Serono, Gilead Sciences, Abbvie, and Madalon Consulting, and research grants from BMS, Takeda, Novartis, Gilead, and Lilly. C.P.P is a consultant for DropWorks and XSphera Biosciences, has stock and other ownership interests in XSphera Biosciences. Received honoraria from Bio-Rad and has sponsored research agreements with Daiichi Sankyo, Bicycle Therapeutics, Transcenta, Bicara Therapeutics, AstraZeneca, Intellia Therapeutics, Janssen Pharmaceuticals, Array Biopharma. S.K. has a sponsored research agreement with Boehringer-Ingelheim. H.M., A.K., J.P, M.W., B.J.W. and J.C. are employees of Gilead Sciences.

Figures

Figure 1.
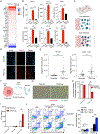
Figure 1.. Restoration of cGAS-STING signaling in KL cells induces TREX1.
(A) Schematic of protocol for RNA sequencing. H1944 cells treated with DMSO or BAY1217389 for 48h, followed by 24 h washout and RNA sequencing. Schematic created with BioRender.com. (B) Gene set enrichment analysis (GSEA) showing significant differentially expressed pathways. GSEA hallmark categories of upregulated hallmark pathways in BAY1217389 treated cells relative to DMSO treated cells. (C) GSEA of IFN-α signature in H1944 cells treated with DMSO or 100 nM BAY1217389. (D) Volcano plot of H1944 cells treated with DMSO or 100 nM BAY1217389. p < 0.05 and absolute value fold change > 1 were considered significant. Green indicates IFN stimulated genes, pink antigen presentation machinery genes, and blue negative regulator of immune signaling. (E) Immunoblot of the indicated proteins in H1944 cells transduced with the indicated vectors and treated with DMSO or 100 nM BAY-1217389. (F-G) Immunoblot (F) or ELISA of human CXCL10 or IFN-β (G) in conditioned-media derived from H1944 transduced with the indicated vectors and treated with DMSO or 100 nM BAY-1217389. (H) Structure of TREX1 with dsDNA. The structure of TREX1-DNA complex was obtained from PDB (https://www.rcsb.org) ID 7TQQ. (I-J) Immunoblot (I) or ELISA of human CXCL10 or IFN-β in conditioned-media (J) derived from H1944 transduced with the indicated vectors. p-values were calculated by two-way ANOVA followed by Sidak’s post-hoc test (G), or one-way ANOVA followed Tukey’s post-hoc test (J), *p<0.05, **p<0.01.
Figure 2.
Figure 2.. TREX1 Depletion Unleashes an Autocrine Signaling Loop that Amplifies Tumor Cell cGAS-STING Signaling
(A-B) Immunoblot (A) or ELISA of human CXCL10 or IFN-β in conditioned-media (B) derived from KL cells transduced with the indicated vectors. (C-D) Immunoblot (C), ELISA of human CXCL10 or IFN-β in conditioned-media (D) derived from H1944 transduced with the indicated vectors. (E-F) ELISA of human CXCL10 or IFN-β in conditioned-media (E), or Immunoblot in H1944 with the indicated vectors at 24hr, 72hr, or 120hr (F). (G) Schematic of STING pathway suppression by TREX1 (H) Immunoblot of the indicated proteins in H1944 cells transduced with the indicated vectors treated with IFN-β at the indicated concentration at 24hr. (I) Immunoblot of the indicated proteins in H1944 cells transduced with the indicated vectors. p-values were calculated by unpaired two-tailed Student’s t test (B, D, E), *p<0.05, **p<0.01. ns, not significant.
Figure 3.
Figure 3.. TREX1 knockout in cancer cells recruits T cells and primes NK cell activation
(A) Heatmap of cytokine/chemokine profiling of H1944 TREX1 sg / TREX1 and cGAS sg conditioned media. Data expressed as relative log fold change (L2FC). (B) Representative absolute cytokine levels (pg/mL) measured using Luminex. Mean ± s.e.m of duplicate samples shown. # indicates values above assay and max CCL5 value used to calculate L2FC. (C) Schematic of migration assay in 3D device. (D) Representative images of NK cells migration. (E) Immune cells infiltration into peri-tumor region (F) Schematic depicting paracrine interactions between tumor cells and NK cells. (G) Representative images at 4 hr post addition of 1.5:1 E:T NK cells to H1944 parental or TREX1 sg cells. (H) Viability of tumor cells in parental and TREX1 sg co-cultures 22 hr post NK cell addition. (I) IFN-γ production. Data representative of 3 independent experiments. (J) Flow cytometric analysis of Annexin V and Helix NP of H1944 cells transduced with the indicated vectors treated with IFN-γ at the indicated concentration for 72 hr (left) and the proportion of dead cells is shown (mean ± SD) (right). Data representative of 3 independent experiments. Ratio of dead cells indicates the propotion of Annexin V- and/or Helix NP-stained cells. p-values were calculated by unpaired two-tailed Student’s t test (B, E, H), and one-way ANOVA followed by Tukey’s post-hoc test (J), *p<0.05, **p<0.01, ns, not significant. Schematics created using BioRender
Figure 4.
Figure 4.. TREX1 inactivation broadly primes immunogenicity in tumor cells
(A) Expression of TREX1 in normal tissue(Gtex). vs. tumor (TCGA) in multiple types of malignant tumors. PRAD, prostate adenocarcinoma; UCEC, uterine corpus endometrial carcinoma; SARC, sarcoma; OV, ovarian cancer; BLCA, bladder urothelial carcinoma; BRCA, breast invasive carcinoma; KIRC, kidney renal clear cell carcinoma; CRC, colorectal cancer; STAD, stomach adenocarcinoma; LIHC, liver hepatocellular carcinoma. (B) Fold induction in IFN-β levels (qPCR) in TREX1 siRNA knockdown and non-targeting (NT) control siRNA in cancer cell lines. Data collected 6 days post siRNA transfection. Mean ± SEM of n = 3 biological replicates are shown. (C) ELISA of human CXCL10 in conditioned-media from KLE with the indicated vectors at 24hr, 72hr, or 120hr. **p<0.01 using unpaired two-tailed Student’s t test. (D) Tumor volume of wild-type and TREX1 KO tumors in combination with isotype or anti-PD-1 treatment. n=10 mice per group (WT vs. TREX1 KO isotype, **p=0.006, 2 way Anova at Day 17) (E-F) CD3+ T cell (E) and NK cell (F) and percentages in all groups indicated above (n=5 for each group). For all comparisons in E and F: **p<0.01, *** p<0.001, **** p<0.0001 using one-way ANOVA. (G) Gene set enrichment scores for IFN related signaling in the four groups (expression data from RNA-sequencing). (H) Tumor growth in the CT26 model. Day 0 = start of anti-PD-1 (TV ~100-160mm3). n=15 each group. When TV reached 500-600mm3, n=5 removed from study; n=10 at endpoint. ****p<0.0001 (2-way ANOVA) . (I) Mean tumor volume of 393P-KL cells after subcutaneous inoculation into 129S2/SvPasCrl mice. Mice were treated with anti-PD-1 antibody on day 7, 10 after implantation. *** p<0.001, ****p<0.0001 (2-way ANOVA). (J) Mean tumor volume of 393P-KL cells after subcutaneous inoculation into NSG (NOD.Cg-Prkdcscid Il2rgtm1Wjl/SzJ) female mice. Mice were treated with anti-PD-1 antibody on days 1 and 4 after randomization. ns, not significant (2-way ANOVA).

References

    1. Morad G, Helmink BA, Sharma P, Wargo JA. Hallmarks of response, resistance, and toxicity to immune checkpoint blockade. Cell 2021;184(21):5309–37 doi 10.1016/j.cell.2021.09.020. - DOI - PMC - PubMed
    1. Keenan TE, Burke KP, Van Allen EM. Genomic correlates of response to immune checkpoint blockade. Nat Med 2019;25(3):389–402 doi 10.1038/s41591-019-0382-x. - DOI - PMC - PubMed
    1. Falahat R, Perez-Villarroel P, Mailloux AW, Zhu G, Pilon-Thomas S, Barber GN, et al. STING Signaling in Melanoma Cells Shapes Antigenicity and Can Promote Antitumor T-cell Activity. Cancer Immunol Res 2019;7(11):1837–48 doi 10.1158/2326-6066.Cir-19-0229. - DOI - PMC - PubMed
    1. Kitajima S, Ivanova E, Guo S, Yoshida R, Campisi M, Sundararaman SK, et al. Suppression of STING Associated with LKB1 Loss in KRAS-Driven Lung Cancer. Cancer Discov 2019;9(1):34–45 doi 10.1158/2159-8290.Cd-18-0689. - DOI - PMC - PubMed
    1. Hu J, Sánchez-Rivera FJ, Wang Z, Johnson GN, Ho YJ, Ganesh K, et al. STING inhibits the reactivation of dormant metastasis in lung adenocarcinoma. Nature 2023;616(7958):806–13 doi 10.1038/s41586-023-05880-5. - DOI - PMC - PubMed

Publication types