. 2024 Jan 30;18(4):3681-3698.
doi: 10.1021/acsnano.3c11445. Epub 2024 Jan 16.

Systemic Delivery of Paclitaxel by Find-Me Nanoparticles Activates Antitumor Immunity and Eliminates Tumors

Affiliations

Systemic Delivery of Paclitaxel by Find-Me Nanoparticles Activates Antitumor Immunity and Eliminates Tumors

Soonbum Kwon et al. ACS Nano. .

Abstract

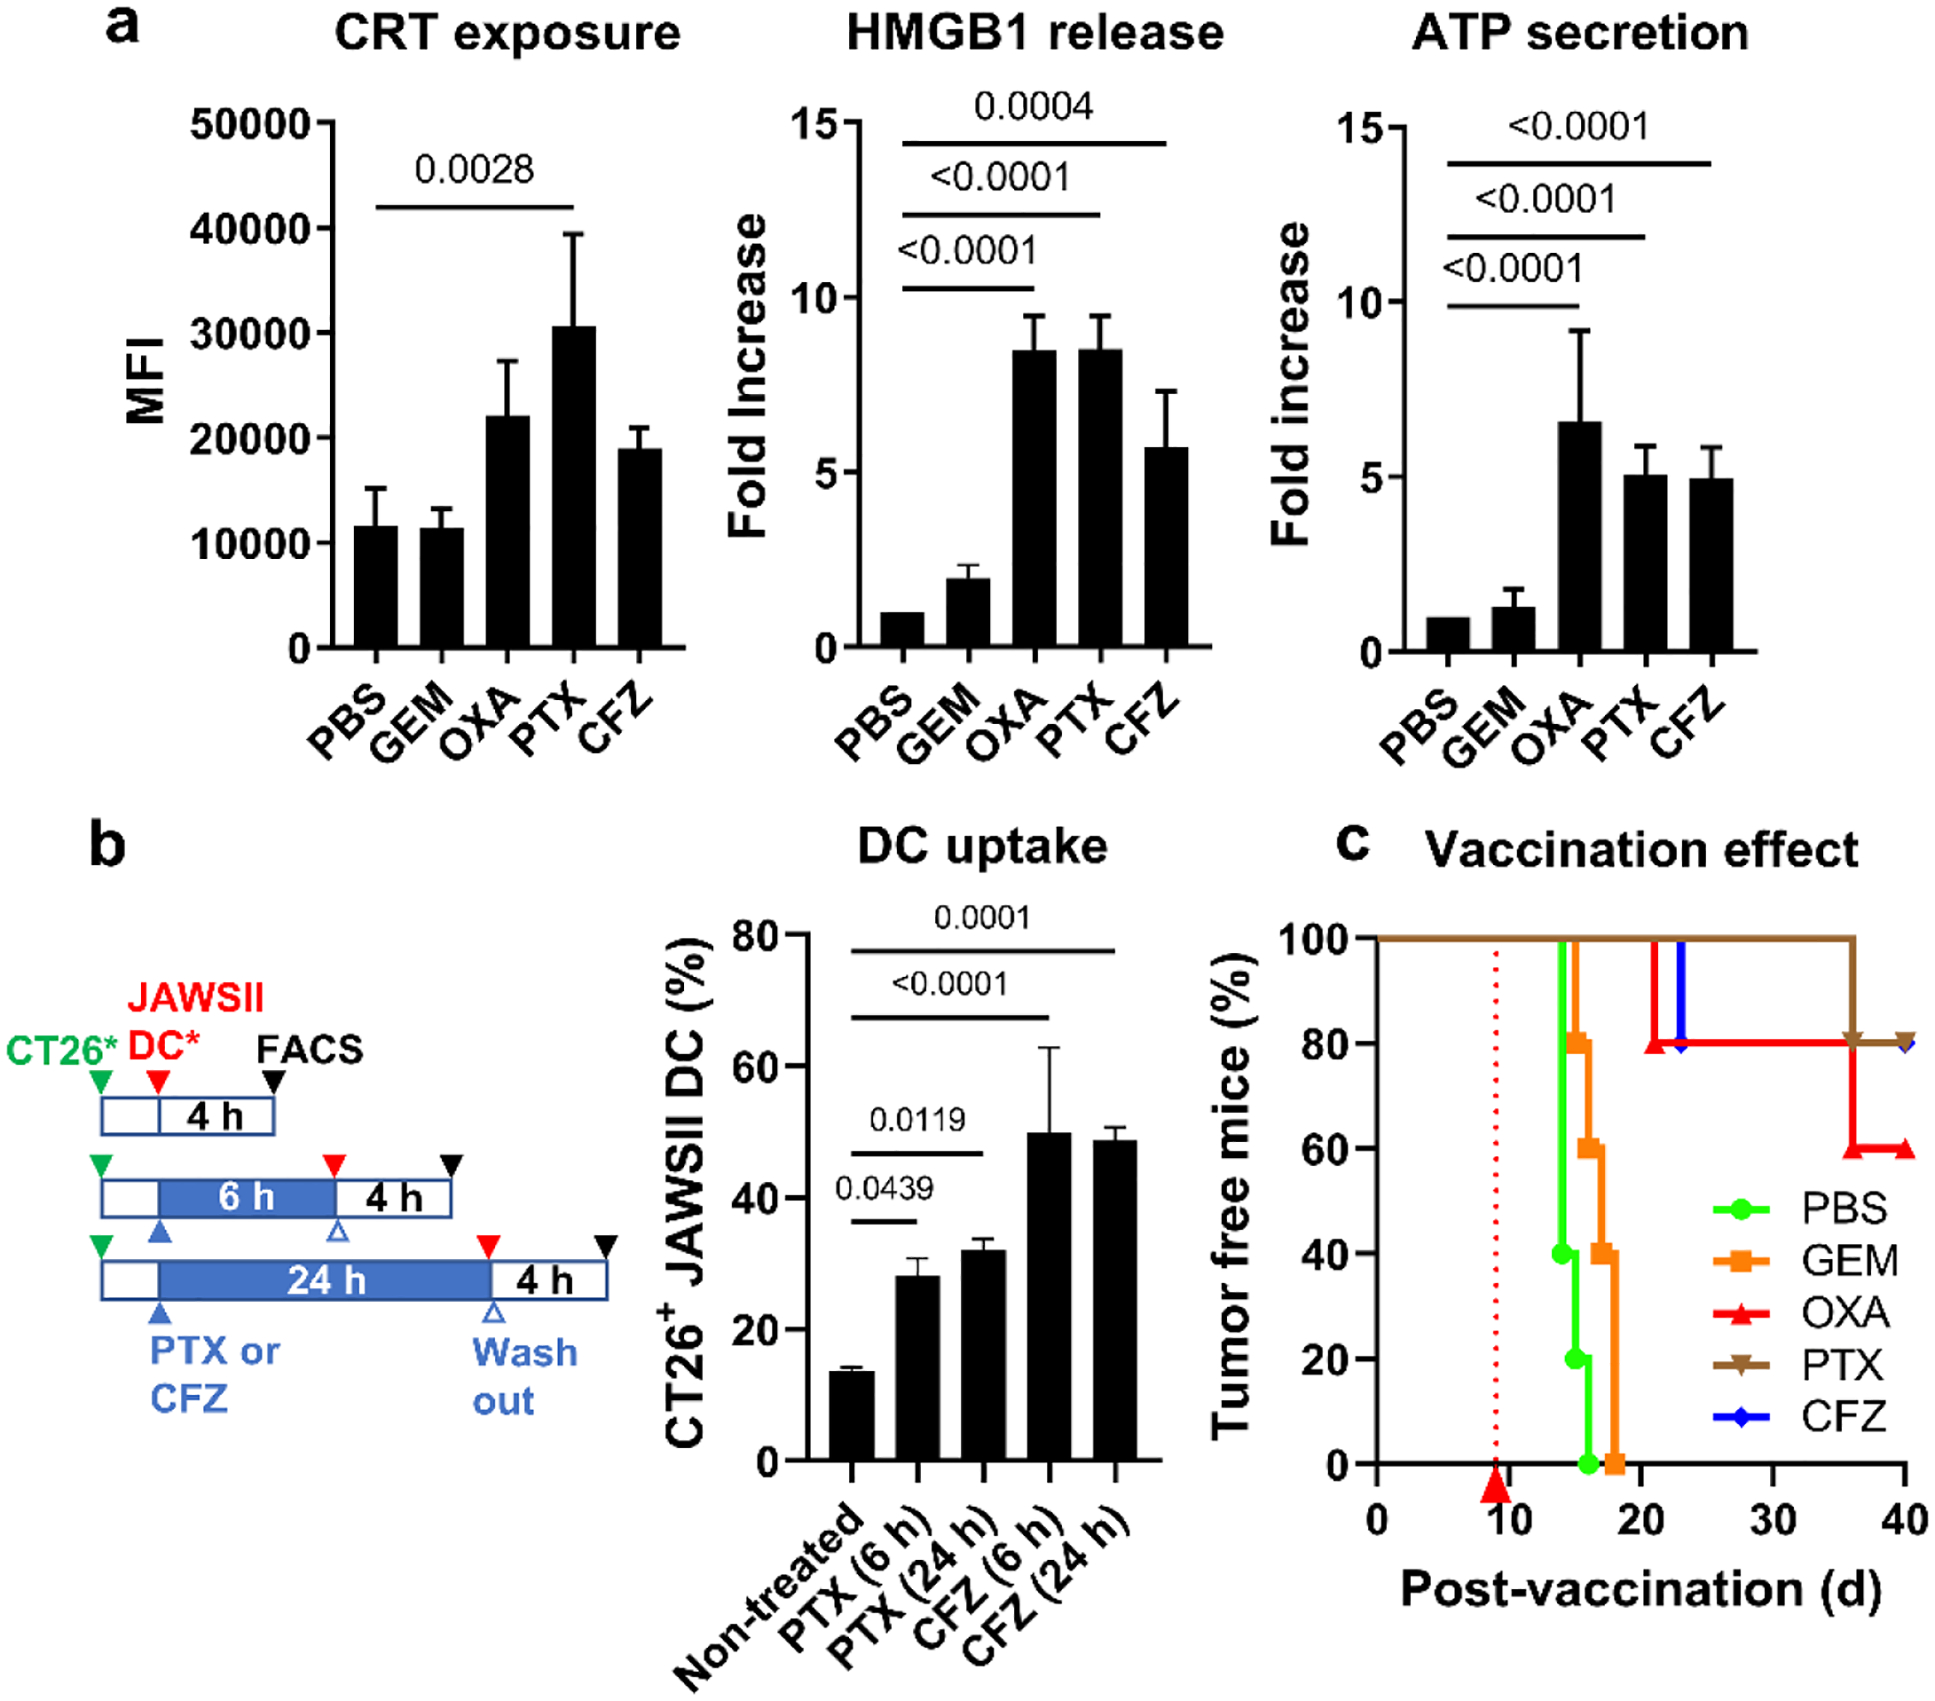
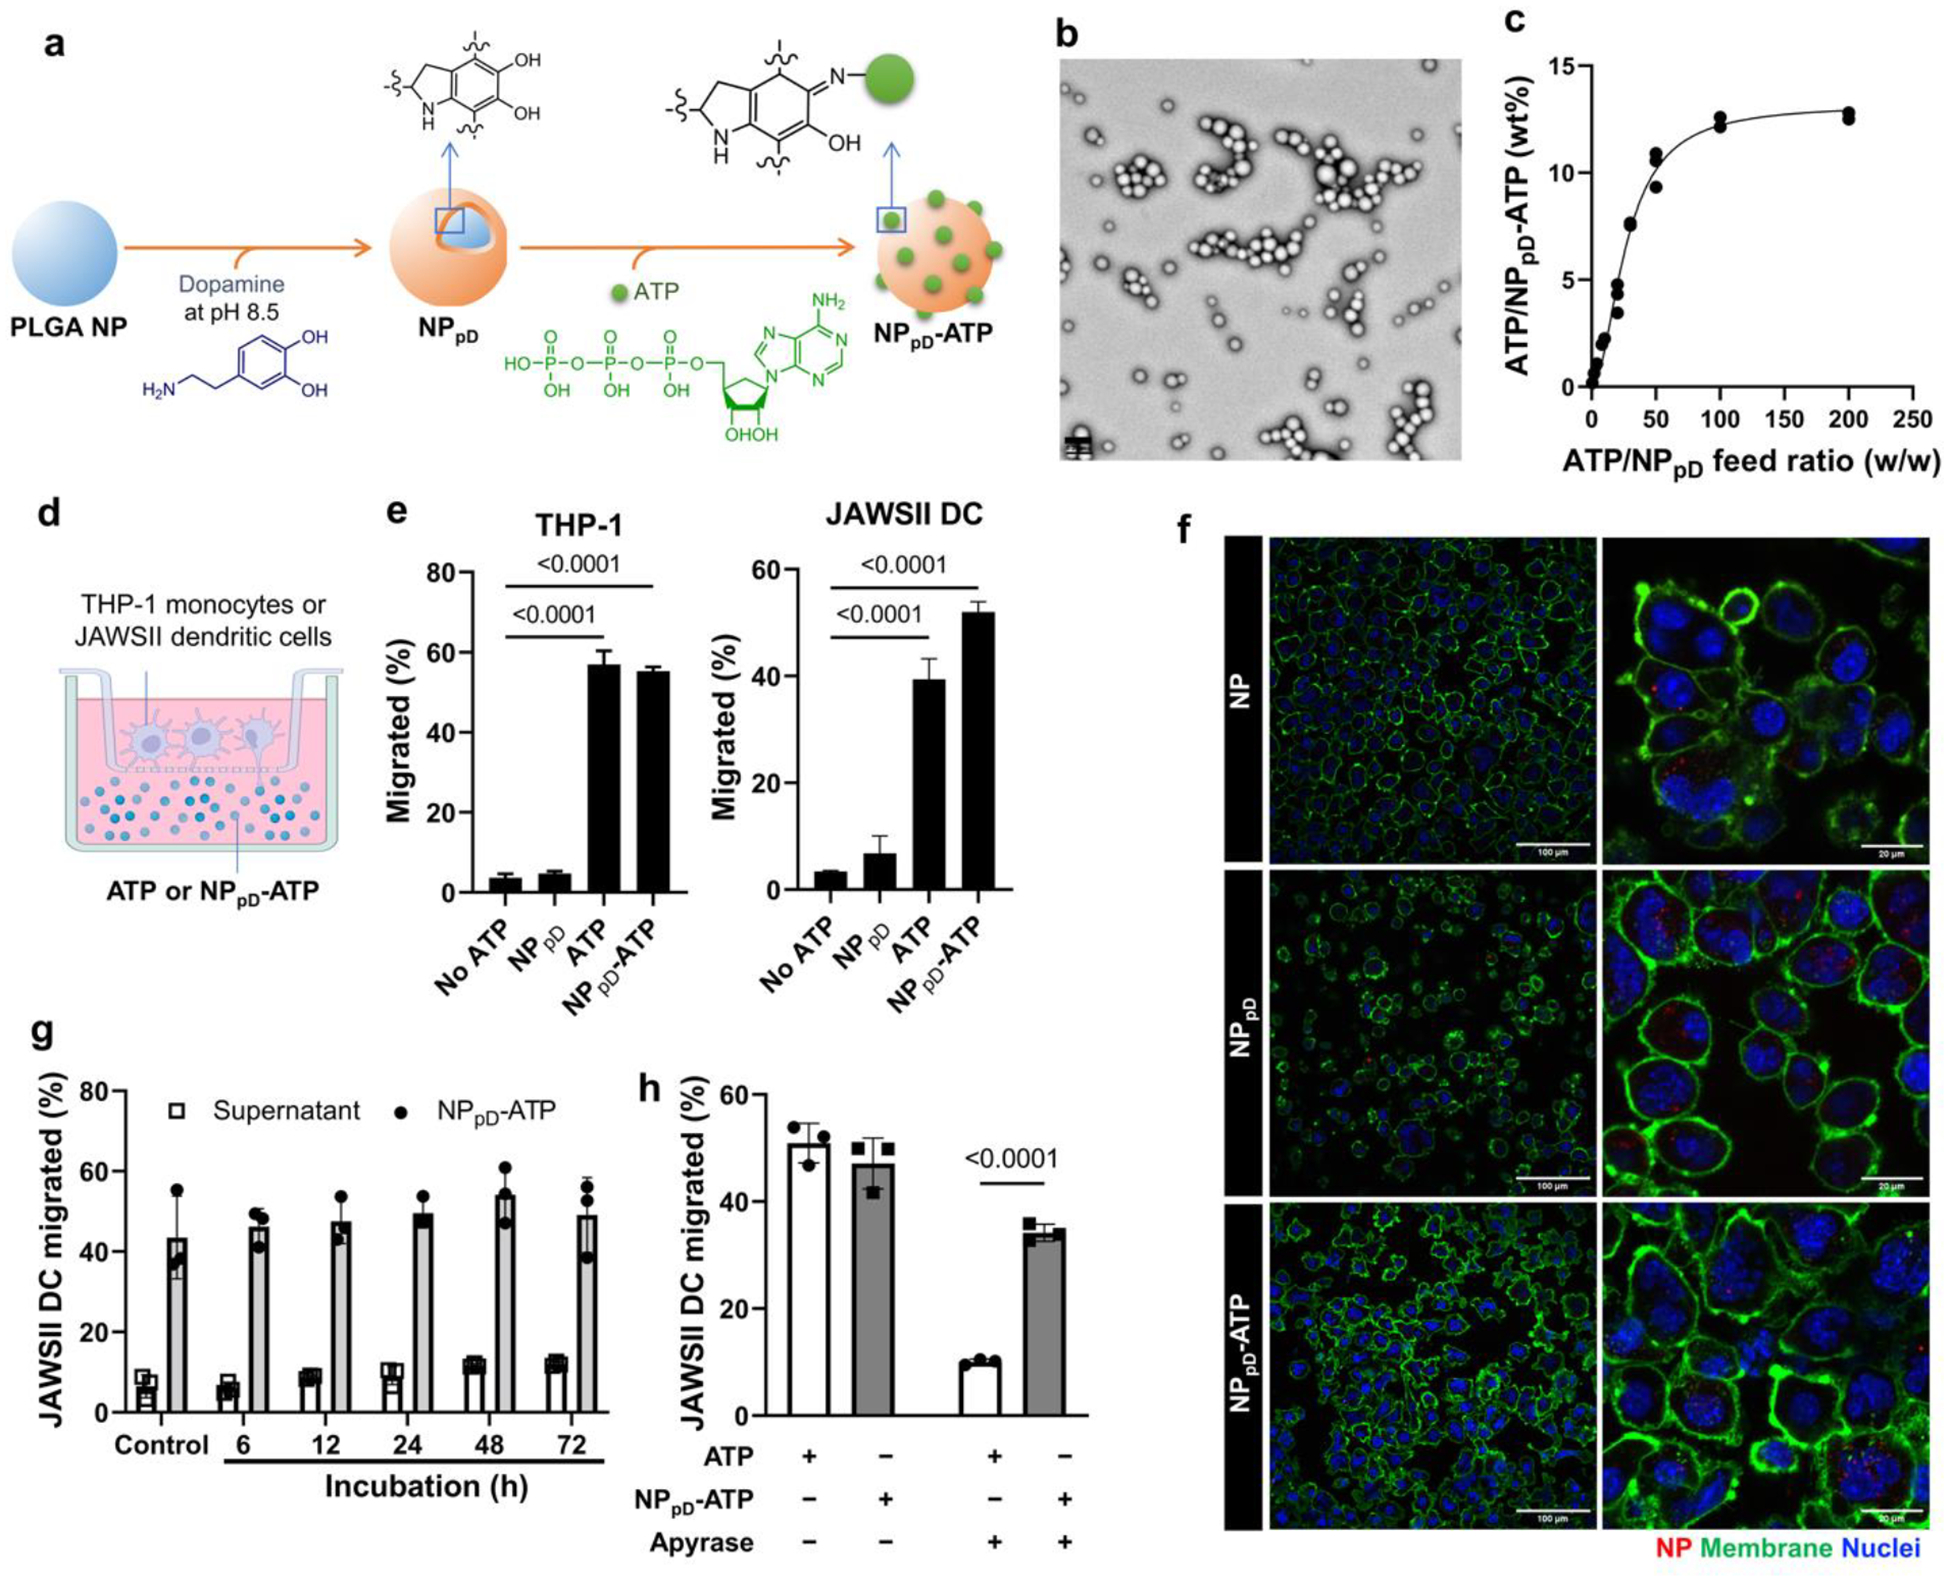
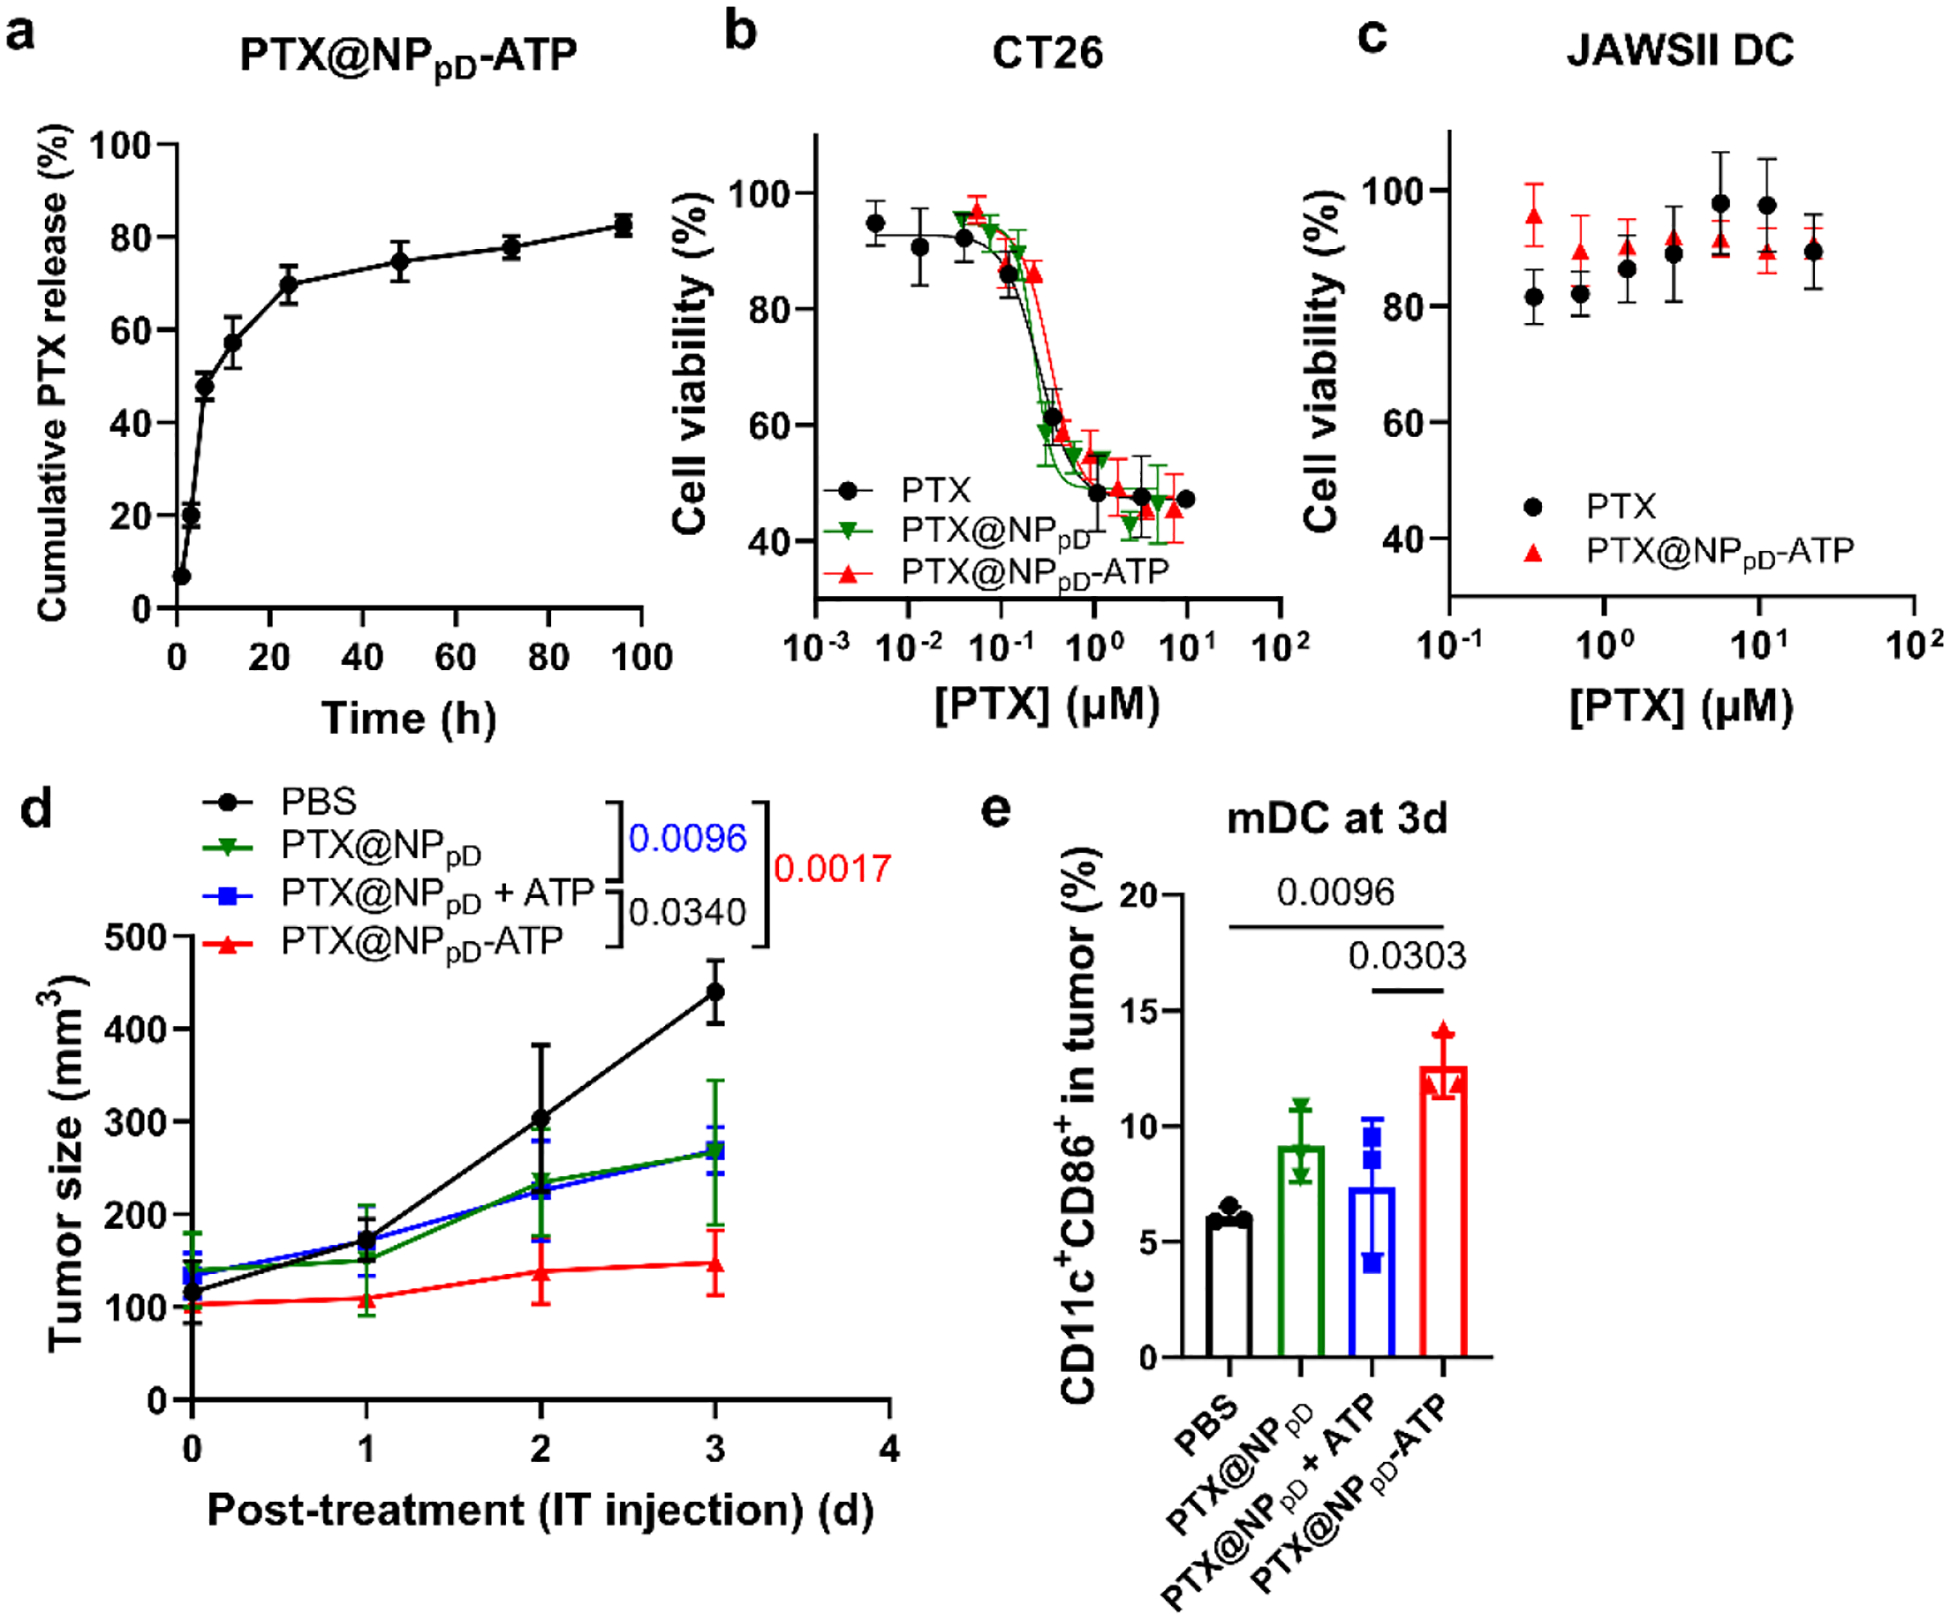
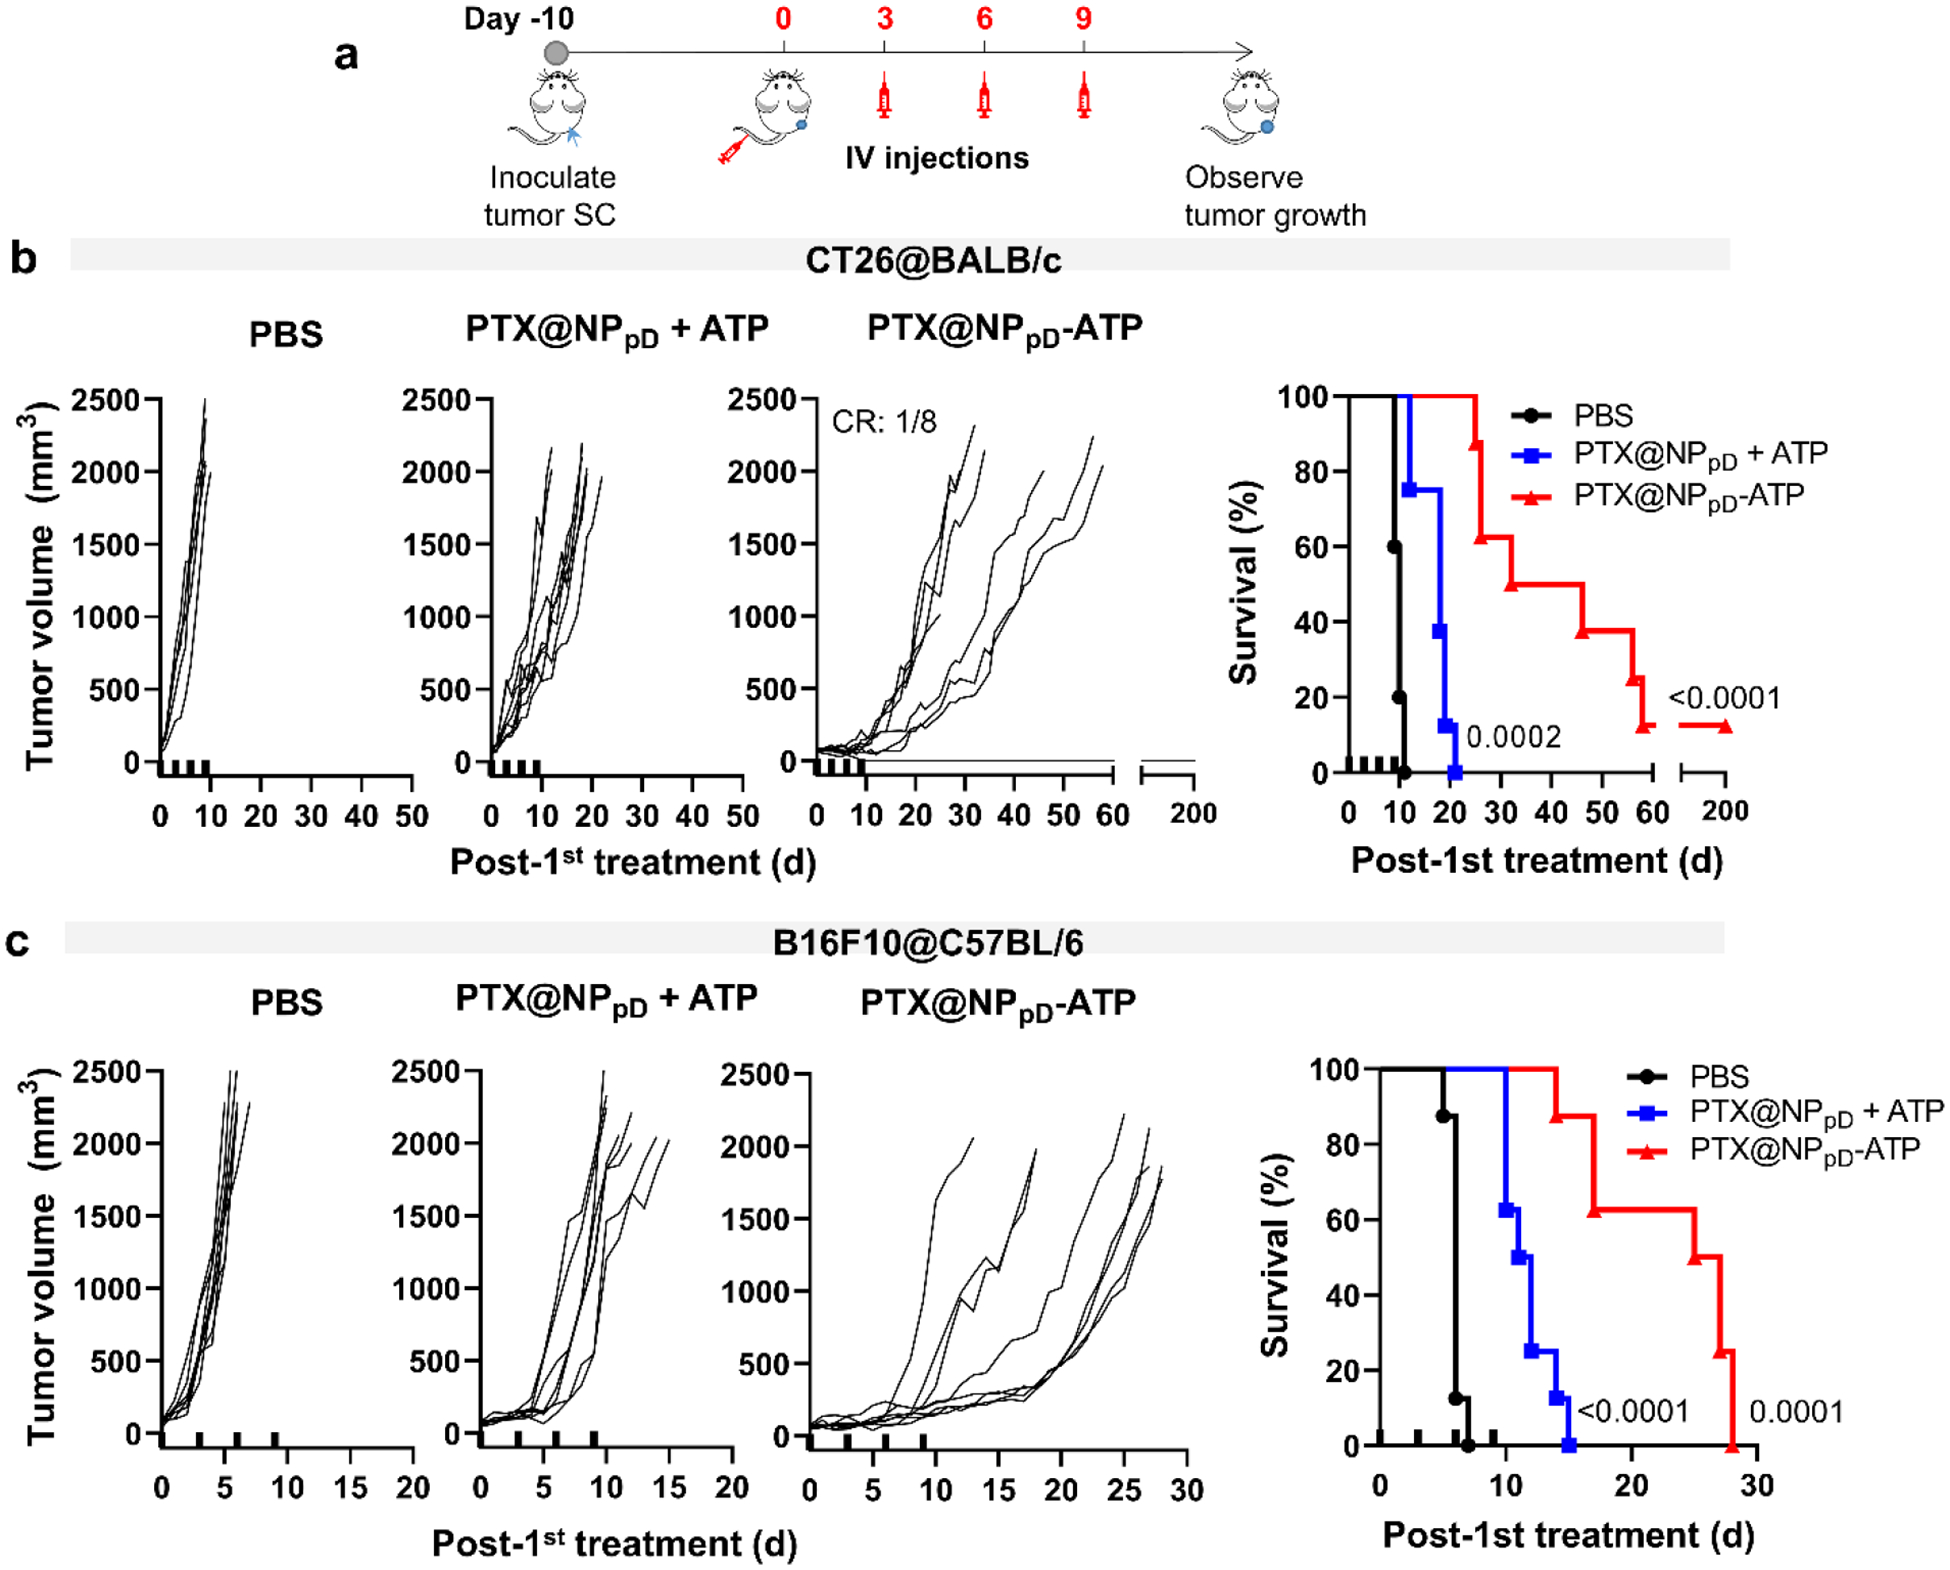
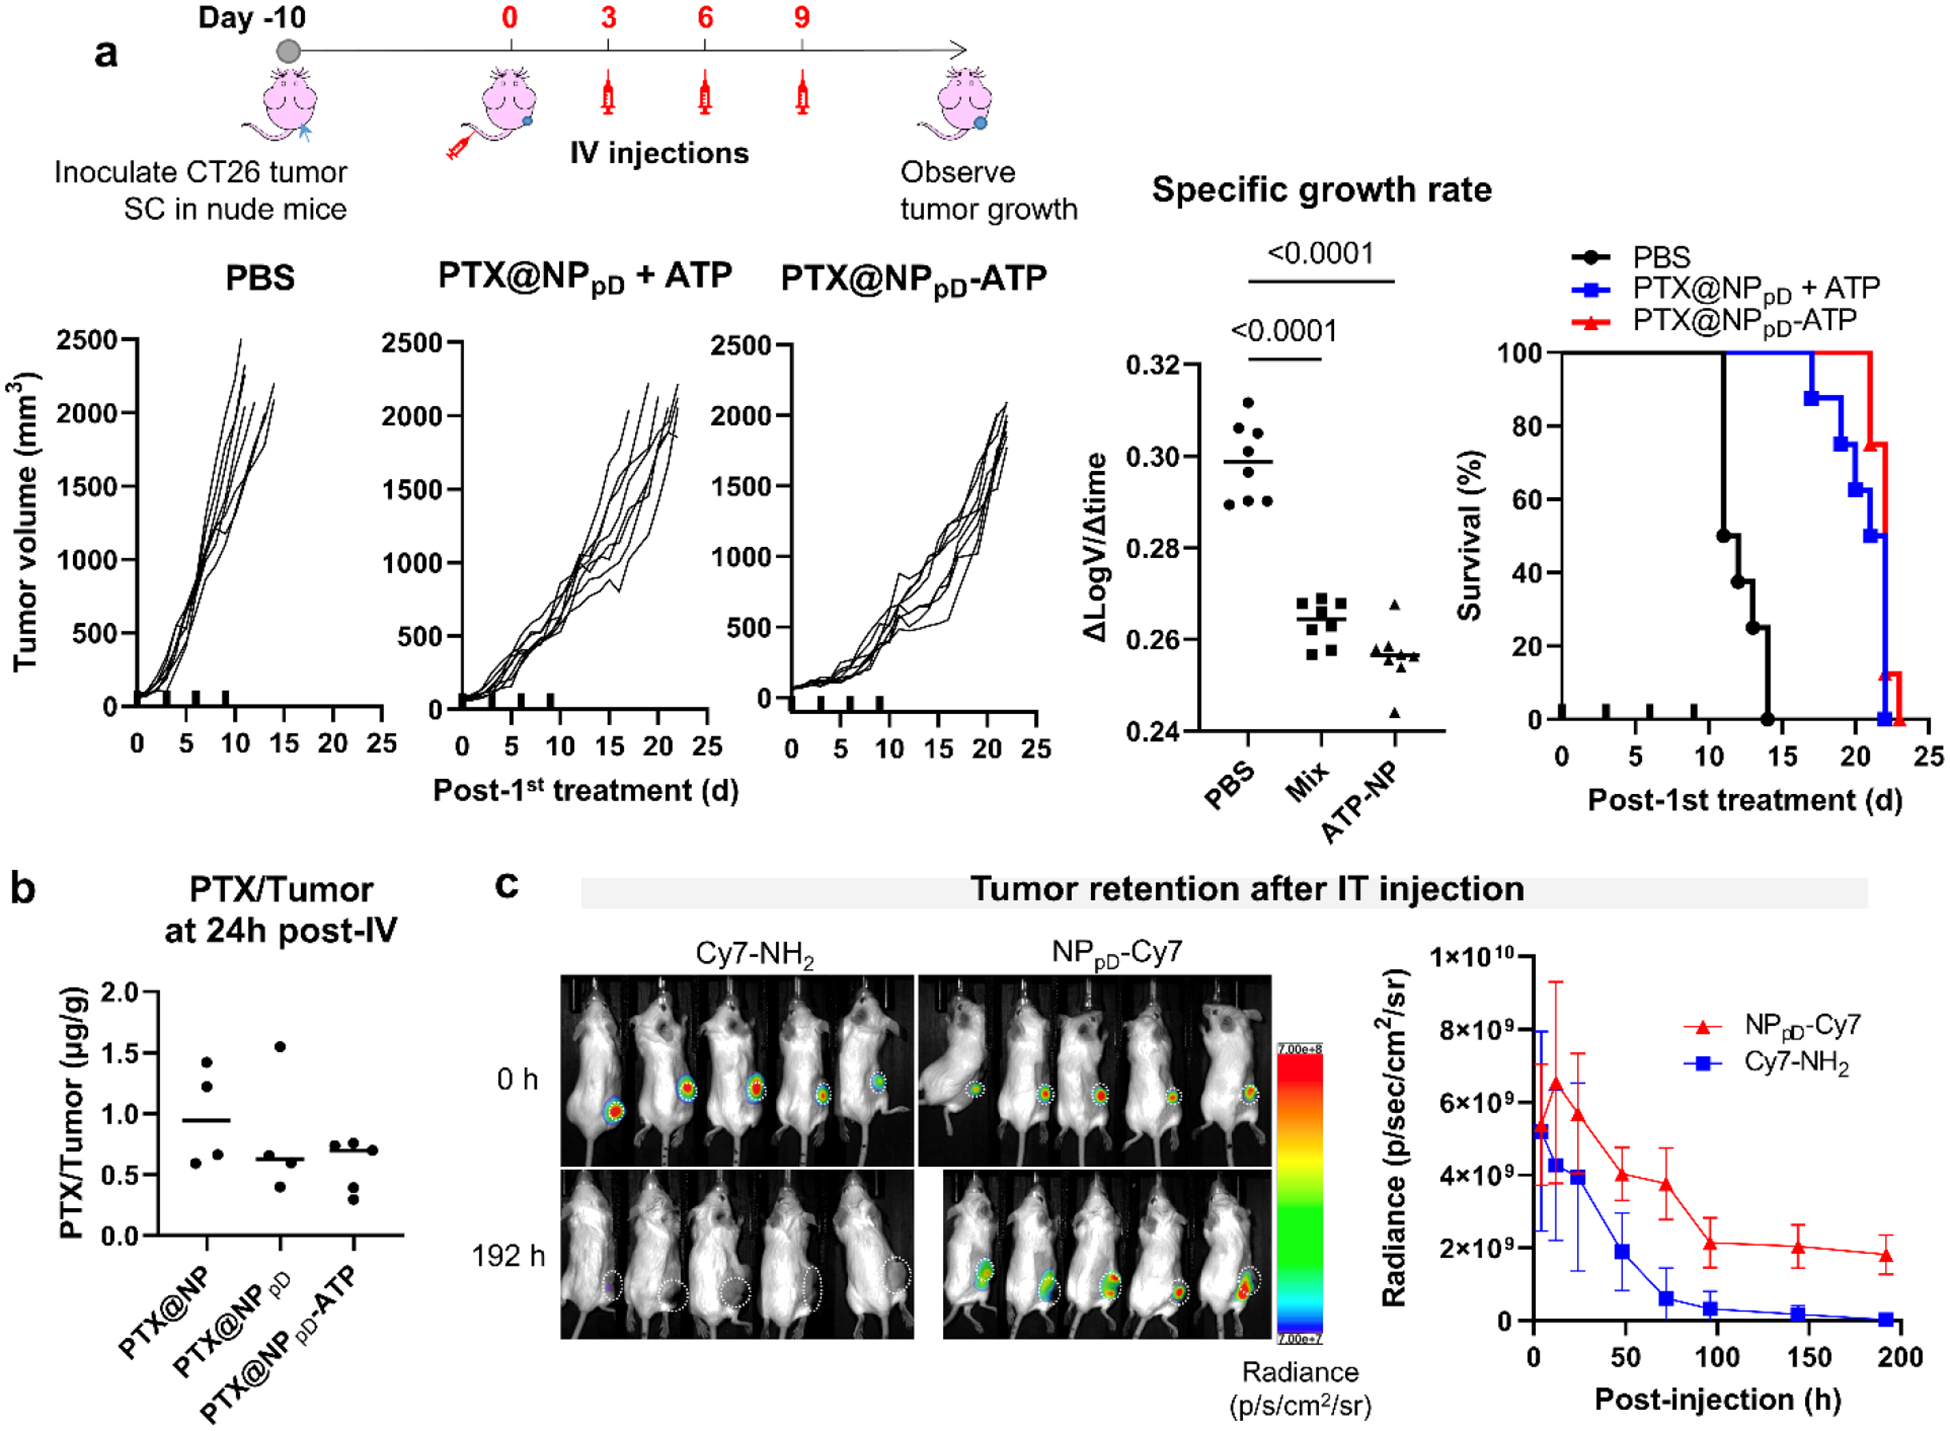
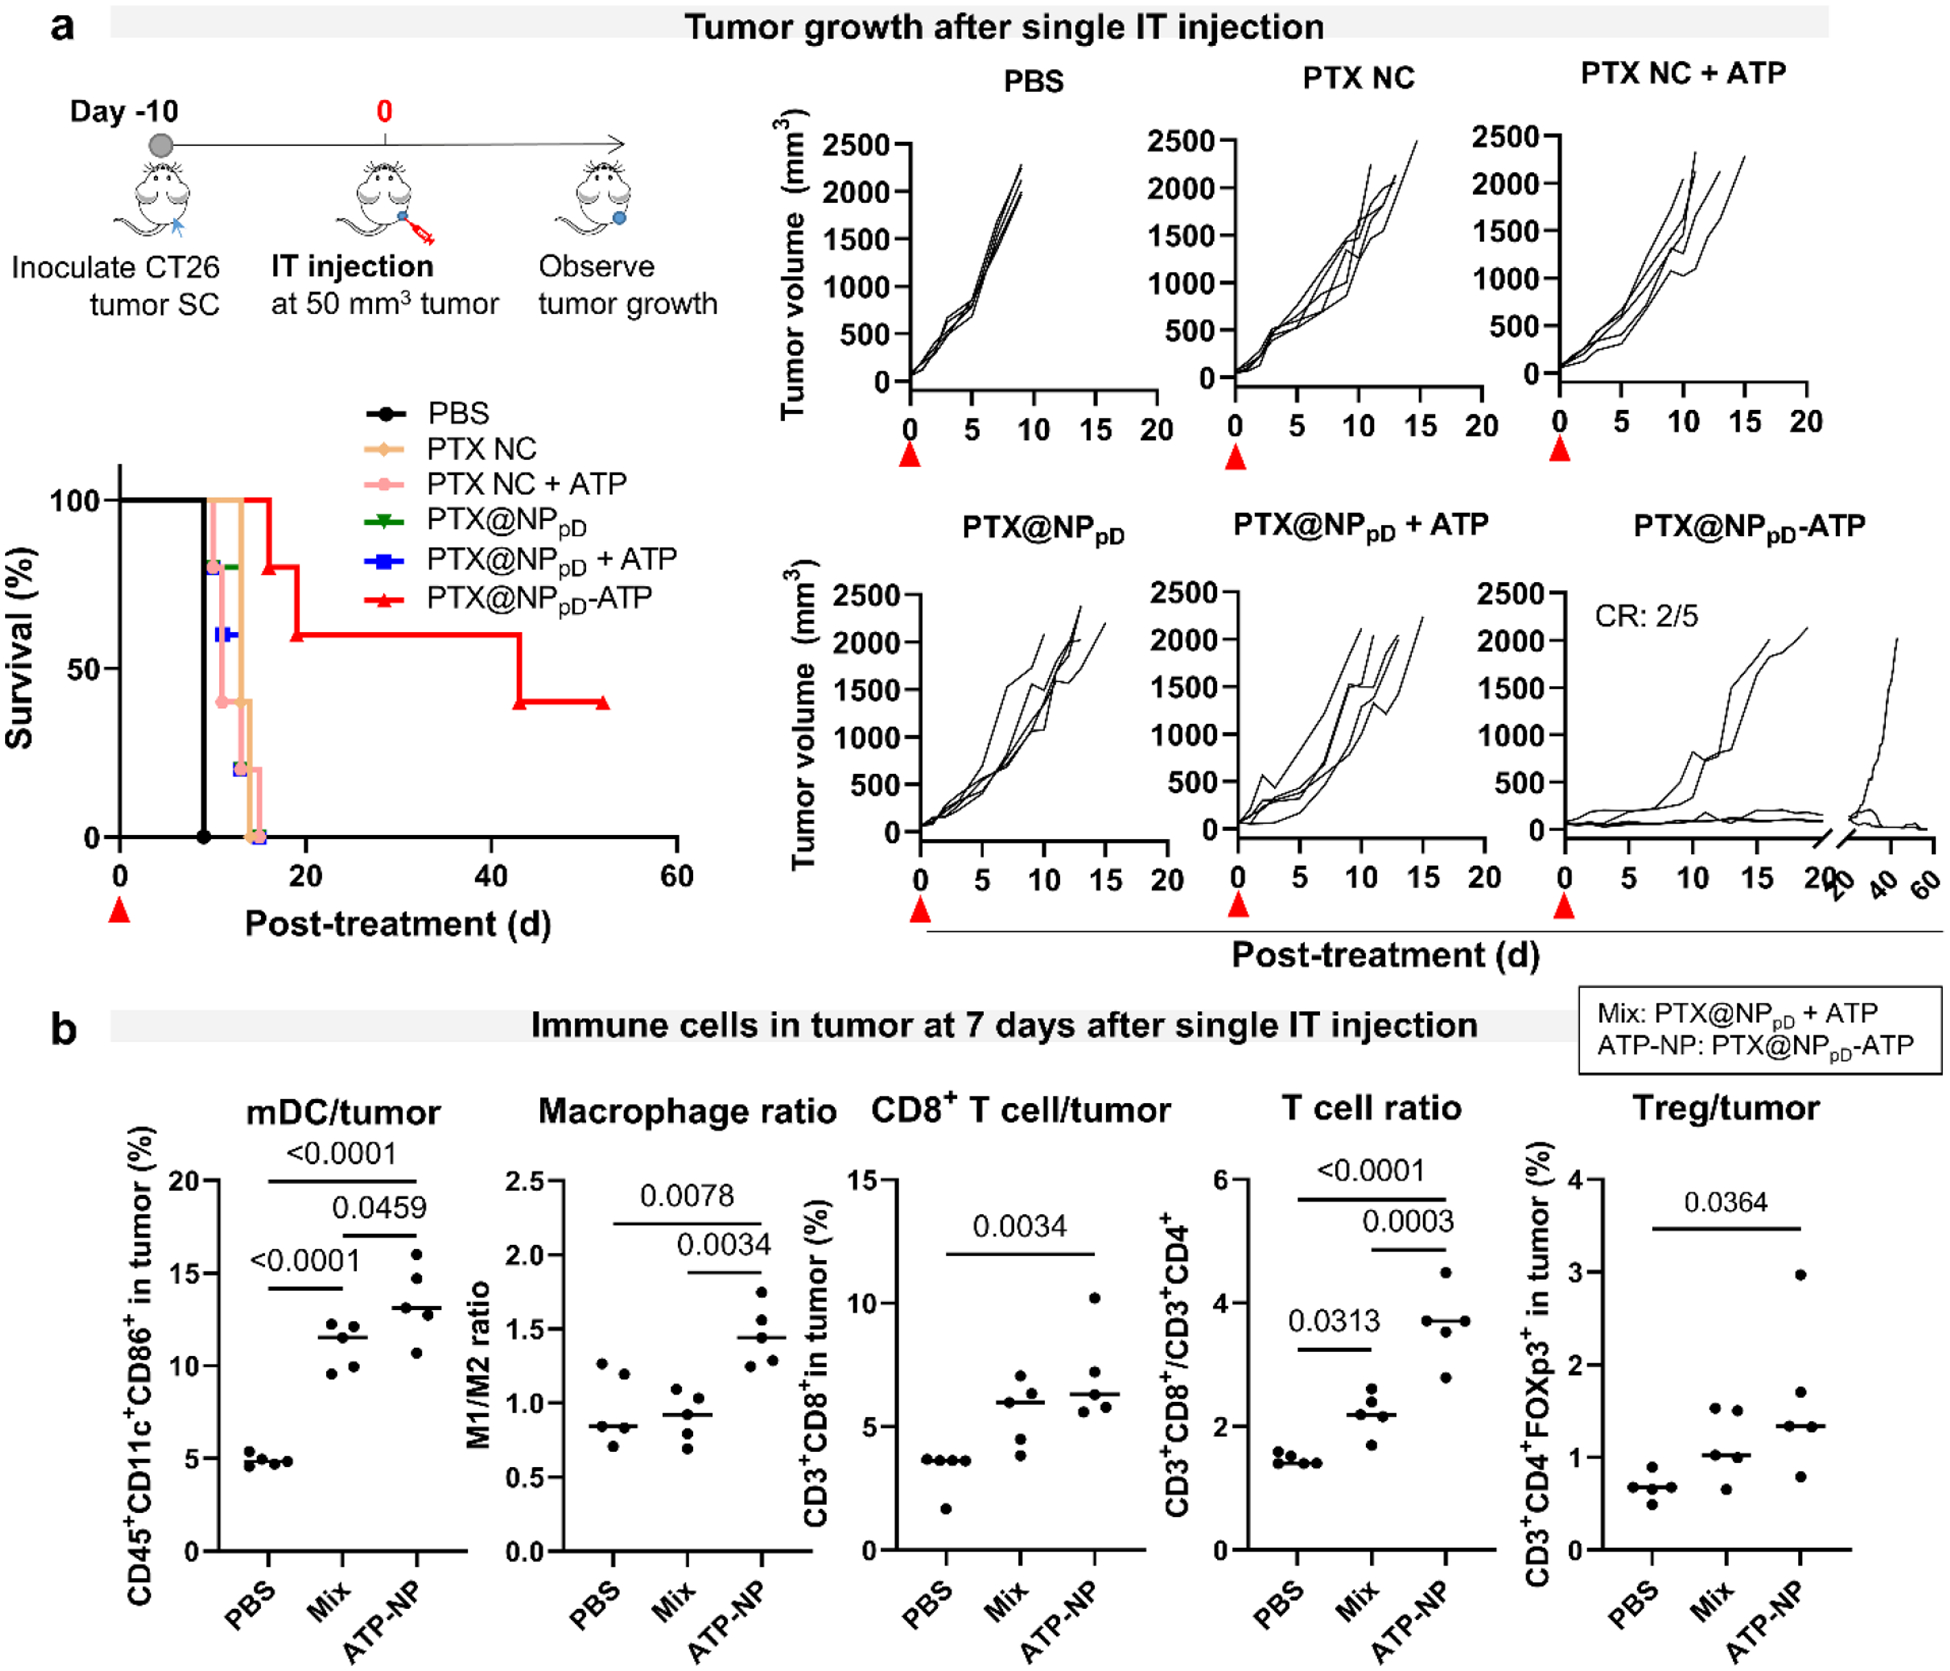
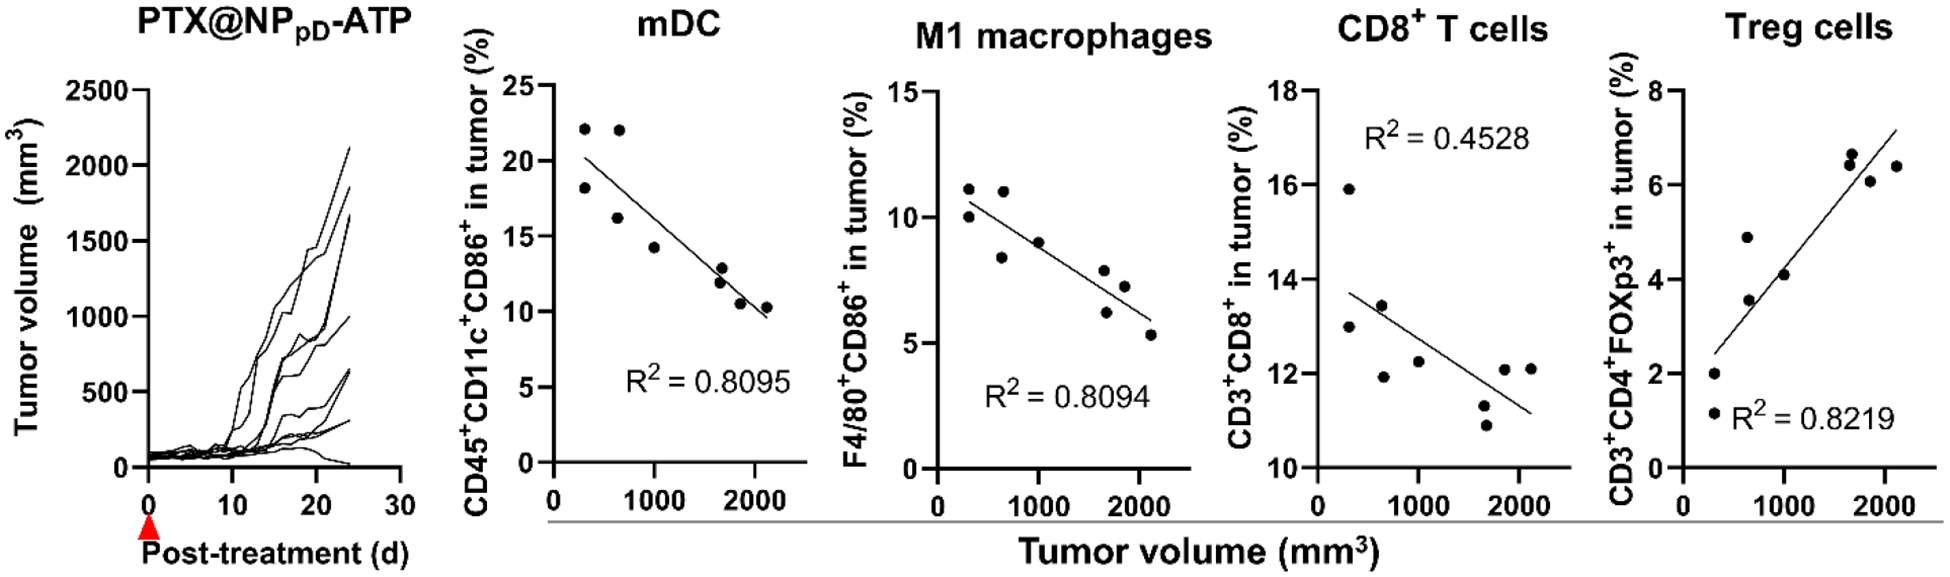
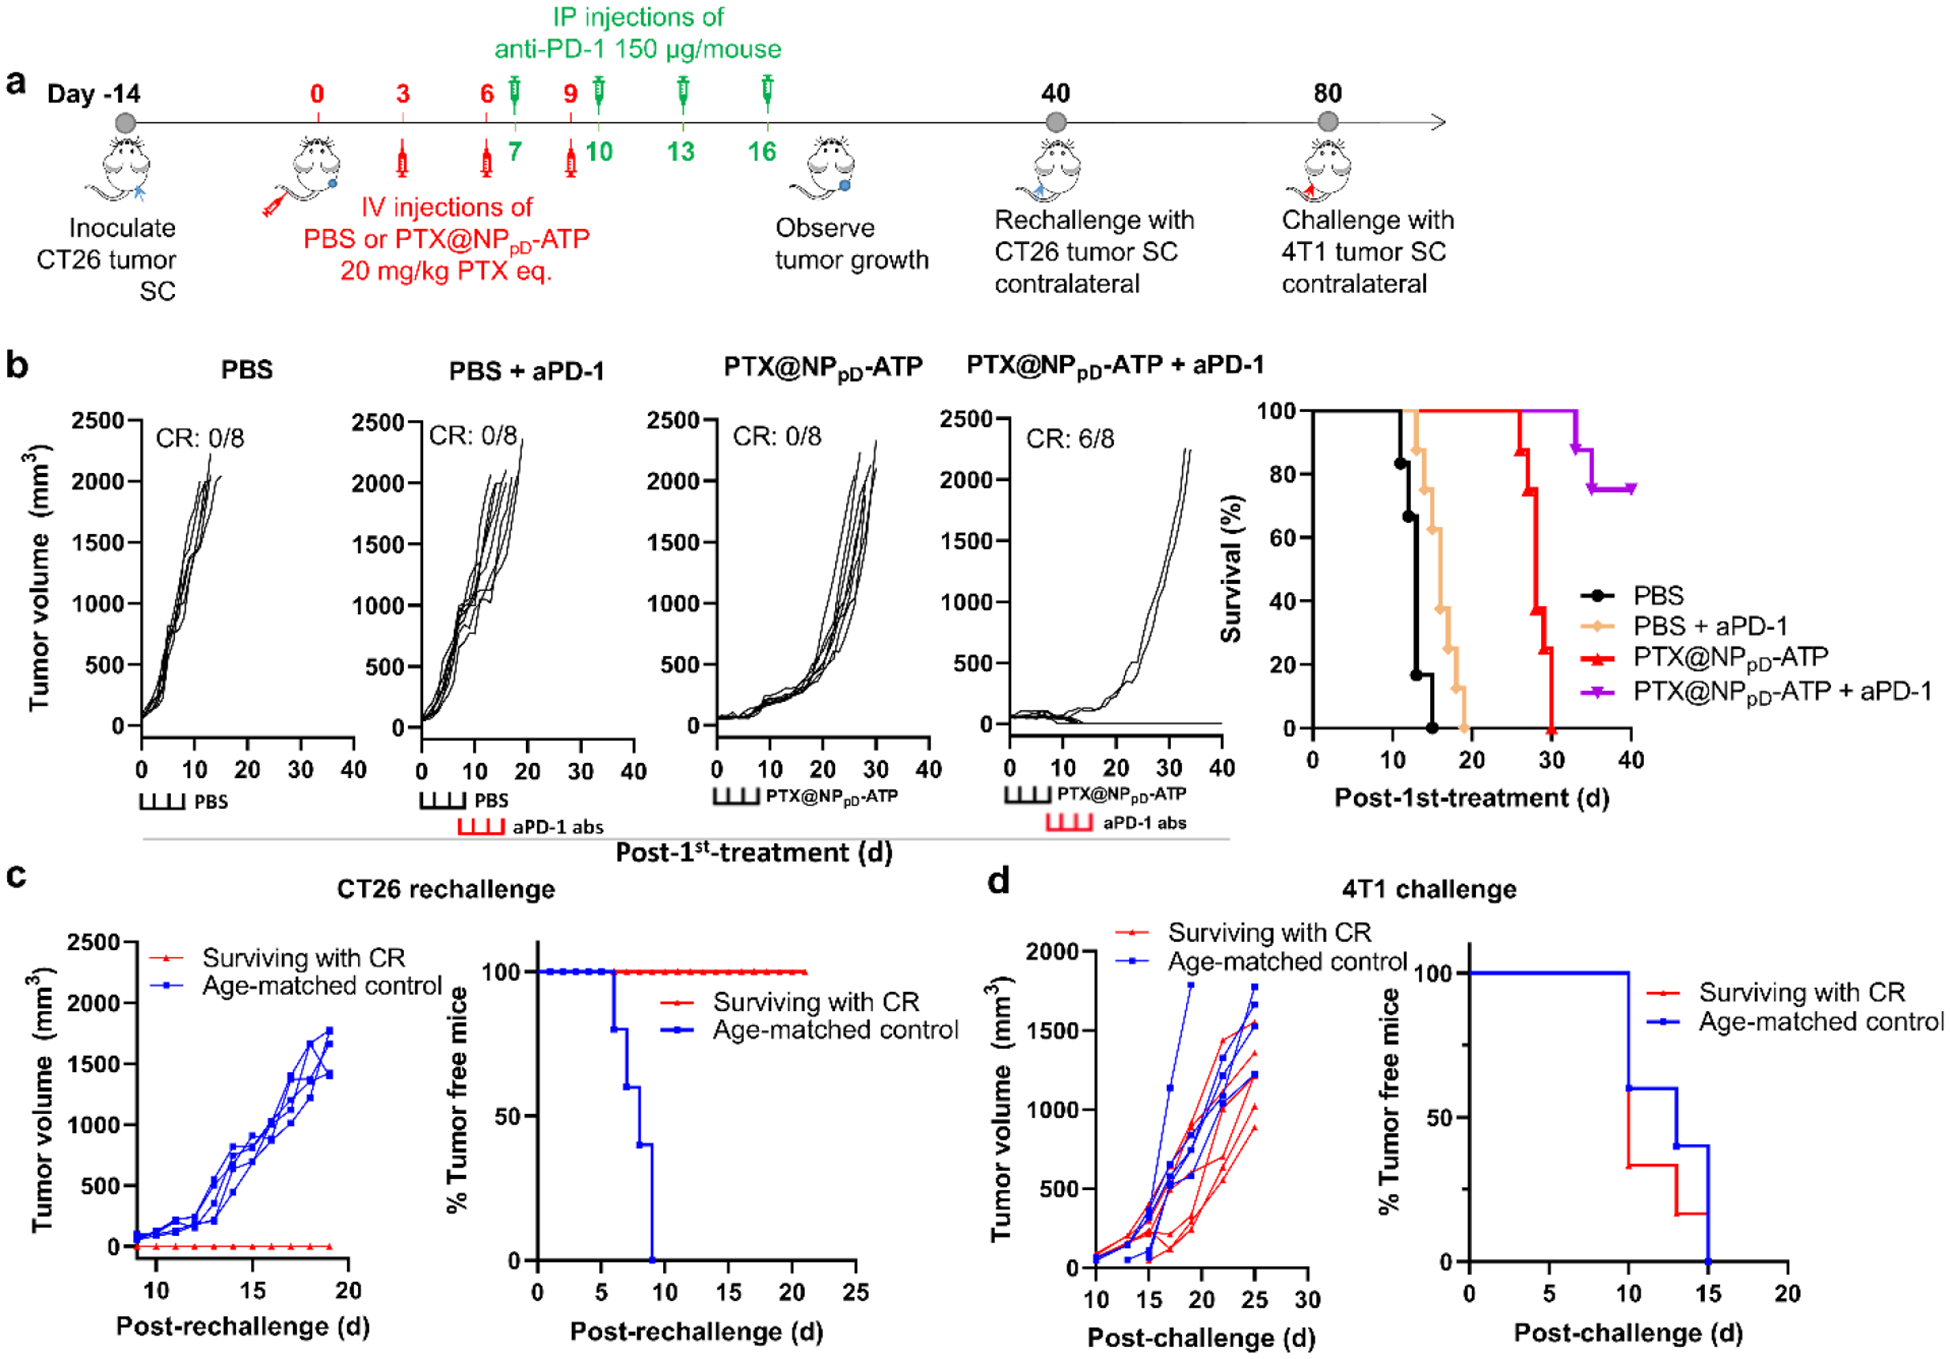
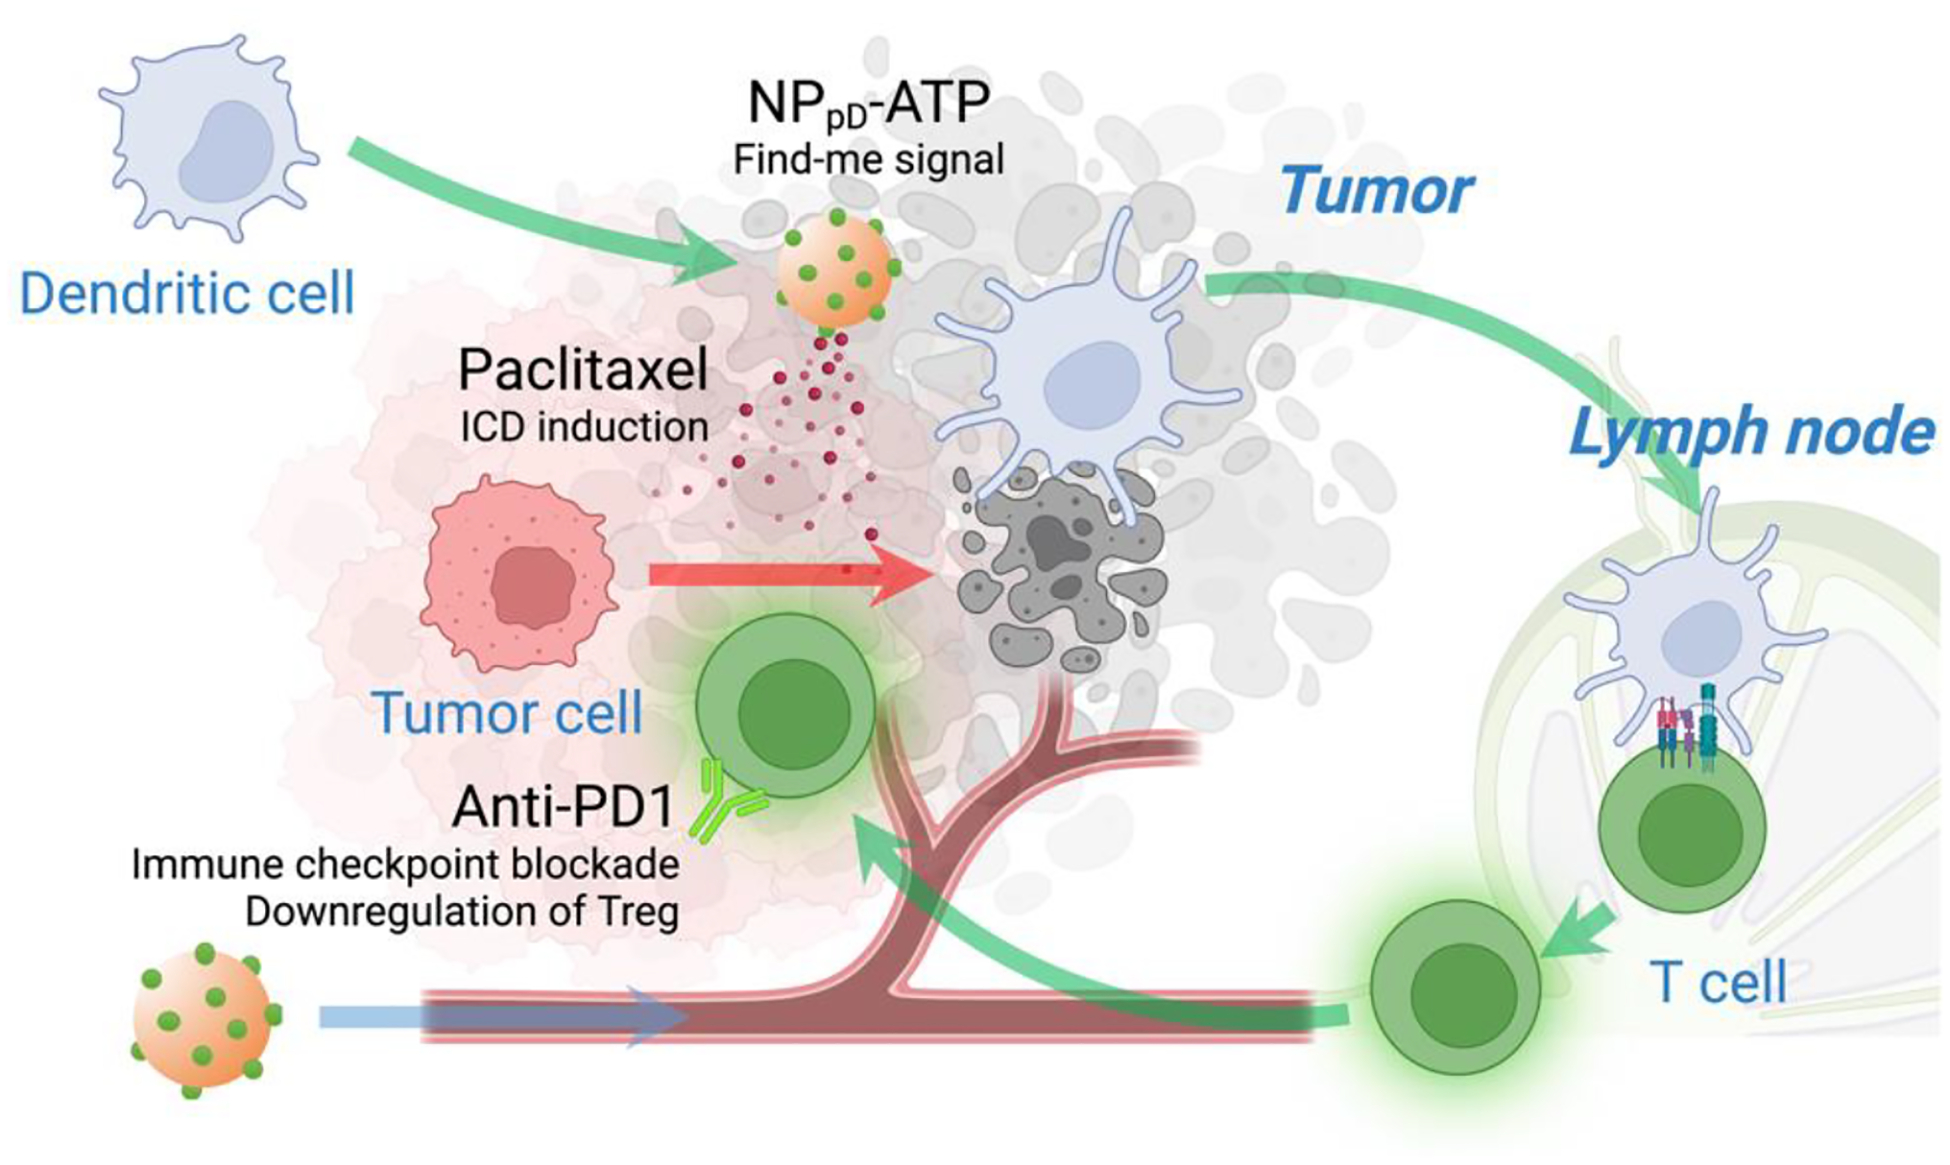
Local delivery of immune-activating agents has shown promise in overcoming an immunosuppressive tumor microenvironment (TME) and stimulating antitumor immune responses in tumors. However, systemic therapy is ultimately needed to treat tumors that are not readily locatable or accessible. To enable systemic delivery of immune-activating agents, we employ poly(lactic-co-glycolide) (PLGA) nanoparticles (NPs) with a track record in systemic application. The surface of PLGA NPs is decorated with adenosine triphosphate (ATP), a damage-associated molecular pattern to recruit antigen-presenting cells (APCs). The ATP-conjugated PLGA NPs (NPpD-ATP) are loaded with paclitaxel (PTX), a chemotherapeutic agent inducing immunogenic cell death to generate tumor antigens in situ. We show that the NPpD-ATP retains ATP activity in hostile TME and provides a stable "find-me" signal to recruit APCs. Therefore, the PTX-loaded NPpD-ATP helps populate antitumor immune cells in TME and attenuate the growth of CT26 and B16F10 tumors better than a mixture of PTX-loaded NPpD and ATP. Combined with anti-PD-1 antibody, PTX-loaded NPpD-ATP achieves complete regression of CT26 tumors followed by antitumor immune memory. This study demonstrates the feasibility of systemic immunotherapy using a PLGA NP formulation that delivers ICD-inducing chemotherapy and an immunostimulatory signal.

Keywords: PLGA nanoparticles; adenosine triphosphate; chemoimmunotherapy; immunogenic cell death; paclitaxel; systemic delivery.


Conflict of interest statement

The authors declare no competing financial interest.

Figures

Fig. 1.
Fig. 1.. PTX and CFZ induce immunogenic cell death.
(a) Damage-associated molecular patterns (DAMPs: CRT exposed on the cell surface, HMGB1 in the medium, and ATP in the medium) expressed by CT26 cells after the treatment with cytotoxic agents at IC50. Gemcitabine (GEM): non-ICD inducer, negative control; oxaliplatin (OXA): known ICD inducer, positive control. n=3 replicates of a representative batch, mean ± SD. (b) JAWSII dendritic cell phagocytosis of CT26 cells treated with CFZ or PTX for 6 or 24 hours. n=3 replicates of a representative batch, mean ± SD. (c) Vaccination study with PBS as a negative control, GEM as a known non-ICD inducer, OXA as a known ICD inducer, and PTX and CFZ as candidate ICD inducers. P-values were calculated by one-way ANOVA with Dunnett’s multiple comparisons test.
Fig. 2.
Fig. 2.. PLGA NPs coated with ATP (NPpD-ATP) protect ATP and attract dendritic cells.
(a) Schematic illustration of ATP conjugation to PLGA NPs. PLGA-NPs were coated with a polydopamine (pD) layer at pH 8.5 to make NPpD. ATP was conjugated to NPpD via Schiff’s base reaction, resulting in NPpD-ATP. (b) Transmission electron micrographs (TEM) of NPpD-ATP. Visualized by negative staining with 1% uranyl acetate. Scale bar: 200 nm. (c) ATP content (wt%) vs. ATP to NP feed ratio (w/w). (d) Boyden chamber assay setup to evaluate cell migration in response to ATP or NPpD-ATP. (e) % THP-1 cells and JAWSII cells migrating to the lower compartment in response to the treatments. n=3 replicates of a representative batch, mean ± SD. (f) Morphology of JAWSII cells treated with NP, NPpD, or NPpD-ATP. Scale bars: 100 μm (left); 20 μm (right). Additional Figures are shown in Supporting Fig. 3. (g) % JAWSII cells migrating to the lower compartment in response to NPpD-ATP that had been pre-incubated in 10% FBS-containing medium or the supernatant (i.e., the conditioned medium). Control is fresh medium and fresh NPpD-ATP. n=3 replicates of a representative batch, mean ± SD. (h) % JAWSII cells migrating to the lower compartment in response to ATP and NPpD-ATP in the presence of apyrase (0.833 units/mL). n=3 replicates of a representative batch, mean ± SD. In e and g, p-values were calculated by one-way ANOVA with Dunnett’s multiple comparisons test. In h, p-values were calculated by two-way ANOVA with Šídák’s multiple comparisons test.
Fig. 3.
Fig. 3.. Bioactivities of PTX-loaded, ATP-coated PLGA NPs (PTX@NPpD-ATP).
(a) PTX release kinetics from PTX-loaded NPpD-ATP (PTX@NPpD-ATP), performed in PBS containing 0.2% Tween 80 with constant agitation at 37 °C. n=3 replicates of a representative batch, mean ± SD. (b) Viability of CT26 cells treated with unformulated PTX or NP-encapsulated PTX. PTX: unformulated drug (IC50: 255 nM); PTX@NPpD: PTX encapsulated in a pD-coated nanoparticle (IC50: 230 nM); PTX@NPpD-ATP: PTX encapsulated in a pD-coated nanoparticle decorated with ATP (IC50: 336 nM). (c) Viability of JAWSII dendritic cells treated with unformulated PTX or PTX@NPpD-ATP. (d) Changes in CT26 tumor size in immune-competent BALB/c mice after a single intratumoral injection of each treatment (equivalent to PTX 10 mg/kg), n=3 per group, mean ± SD. P-values were calculated with the tumor sizes measured on day 3 post-treatment by Tukey’s multiple comparisons test following two-way ANOVA. (e) % CD11c+CD86+ dendritic cells (mature DC, mDC) in tumor 3 days after each treatment. P-values were calculated by one-way ANOVA with Tukey’s multiple comparisons test.
Fig. 4.
Fig. 4.. PTX@NPpD-ATP suppress tumor growth by systemic administration.
(a) Schedule of CT26 or B16F10 tumor inoculation and treatments in immune-competent syngeneic hosts. SC: subcutaneous. IV: intravenous. Each treatment (PTX@NPpD + ATP and PTX@NPpD-ATP) contained PTX equivalent to 20 mg/kg/injection. (b) Changes in CT26 tumor size and the survival of the mice over time after intravenous injection of each treatment, n=8 per group. CR: Complete regression. (c) Changes in B16F10 tumor size and the survival of the mice over time after intravenous injection of each treatment, n=8 per group. In b and c, thick ticks on the X-axis indicate the time of each injection. P-values in the survival curves were calculated by the log-rank (Mantel-Cox) test vs. the PBS group.
Fig. 5.
Fig. 5.. The antitumor effect of PTX@NPpD-ATP is mediated by immune system.
(a) Schedule of CT26 tumor inoculation and treatments in athymic nude mice; changes in CT26 tumor size after intravenous injection of each group in nude mice (PTX: 20 mg/kg/injection); specific growth rates (ΔlogV/Δt) of tumors. Mix: PTX@NPpD + ATP. ATP-NP: PTX@NPpD-ATP. P-values: one-way ANOVA with Tukey’s multiple comparisons test; survival of the mice over time after intravenous injection of each treatment, n=8 per group. Thick ticks in the X-axis indicate the time of each injection. (b) PTX content in CT26 tumors at 24 hours after a single intravenous injection of PTX@NP, PTX@NPpD or PTX@NPpD-ATP (PTX equivalent to 20 mg/kg), n=4 (PTX@NP) or 5 (PTX@NPpD and PTX@NPpD-ATP) per group (no tumor in one of the PTX@NPpD-treated mice). Other organs are shown in Supporting Fig. 10. (c) Radiance (p/sec/cm2/sr) of Cy7 from CT26 tumors immediately or 192 hours after a single intratumoral injection of free dye (Cy7-NH2) or Cy7-conjugated NP (NPpD-Cy7), n=5 per group, mean ± SD. Tumor areas are indicated by white dotted circles. Some of the fluorescence signals may spill over to adjacent region due to the strong intensity.
Fig. 6.
Fig. 6.. The antitumor effect of PTX@NPpD-ATP aligns with the increase of immune cell fraction.
(a) Schedule of CT26 tumor inoculation and treatments in immune-competent BALB/c mice; changes in CT26 tumor size after intratumoral injection of each treatment (PTX: 5 mg/kg); survival of the mice over time after the treatment, n=5 per group. PTX NC: nanocrystal formulation of PTX. (b) Immune cell fraction in CT26 tumors at day 7 after a single intratumoral treatment (PTX: 5 mg/kg), n=5 per group. Horizontal bars indicate median values. See Supporting Fig. 18 for the extended cell fraction profiles. Mix: PTX@NPpD + ATP; ATP-NP: PTX@NPpD-ATP. P-values were calculated by one-way ANOVA with Tukey’s multiple comparisons test.
Fig. 7.
Fig. 7.. Tumors resistant to PTX@NPpD-ATP have fewer mature dendritic cells, M1 macrophages, CD8+ T cells, and more regulatory T cells.
Relationship of tumor size and immune cell fraction in CT26 tumors inoculated in BALB/c mice 25 days after intratumoral injection of PTX@NPpD-ATP (PTX: 5 mg/kg), n=9. See Supporting Fig. 27 for the extended cell fraction profiles.
Fig. 8.
Fig. 8.. PTX@NPpD-ATP combined with anti-PD-1 antibody eliminates CT26 tumors and induces anti-tumor immune memory.
(a) Schedule of CT26 tumor inoculation and treatments in immune-competent BALB/c mice. The first anti-PD-1 antibody were given 7 days after the initial treatment. IP: Intraperitoneal injection. PTX@NPpD-ATP: PTX 20 mg/kg/IV injection; anti-PD-1 antibody: 150 μg/mouse/IP injection. (b) Individual growth curves of tumors and the survival of the mice over time after the treatment, n=8 per group. CR: Complete regression. Brackets at the bottom indicate the time of each treatment. (c) Individual growth curves of tumors and the percentage of tumor-free mice after rechallenge with CT26 tumor cells. Surviving with CR: mice that were treated with PTX@NPpD-ATP and anti-PD-1 antibody and reached complete regression (n=6); Age-matched control: age-matched tumor naïve mice (n=5). (d) Individual growth curves of tumors and the percentage of tumor-free mice after rechallenge with 4T1 tumor cells. Surviving with CR: mice that were treated with PTX@NPpD-ATP and anti-PD-1 antibody reached complete regression, were rechallenged with CT26 tumor cells, and survived with no tumor growth (n=6); Age-matched control: age-matched tumor naïve mice (n=5).
Fig. 9.
Fig. 9.. Schematic illustration of the action of PTX@NPpD-ATP, PTX-loaded PLGA nanoparticles coated with ATP.
Systemically administered, PTX@NPpD-ATP reaches the tumor through circulation. At the tumor, ATP sends off the “find-me” signal to recruit dendritic cells, and PTX is released from the nanoparticles to generate tumor-associated antigens. Dendritic cells loaded with tumor antigens migrate to lymph nodes to activate anti-tumor T cell immunity. Additional anti-PD1 antibody inhibit the checkpoint interaction between T cells and the cells in the tumor microenvironment, as well as the recruitment of immunosuppressive cells, such as MDSCs and Tregs implicated in the resistance to PTX@NPpD-ATP. Created with BioRender.com.

Similar articles

Cited by

References

    1. Murciano-Goroff YR, Warner AB & Wolchok JD The future of cancer immunotherapy: microenvironment-targeting combinations. Cell Res 30, 507–519 (2020). 10.1038/s41422-020-0337-2 - DOI - PMC - PubMed
    1. Garon EB et al. Pembrolizumab for the treatment of non-small-cell lung cancer. N Engl J Med 372, 2018–2028 (2015). 10.1056/NEJMoa1501824 - DOI - PubMed
    1. Larkin J, Hodi FS & Wolchok JD Combined Nivolumab and Ipilimumab or Monotherapy in Untreated Melanoma. N Engl J Med 373, 1270–1271 (2015). 10.1056/NEJMc1509660 - DOI - PubMed
    1. Jenkins RW, Barbie DA & Flaherty KT Mechanisms of resistance to immune checkpoint inhibitors. Br J Cancer 118, 9–16 (2018). 10.1038/bjc.2017.434 - DOI - PMC - PubMed
    1. Peng M et al. Neoantigen vaccine: an emerging tumor immunotherapy. Mol Cancer 18, 128 (2019). 10.1186/s12943-019-1055-6 - DOI - PMC - PubMed

Publication types

Substances