

Comparative analysis of the hypothalamus transcriptome of laying ducks with different residual feeding intake
- PMID: 38228061
- PMCID: PMC10823070
- DOI: 10.1016/j.psj.2023.103355
Comparative analysis of the hypothalamus transcriptome of laying ducks with different residual feeding intake
Abstract
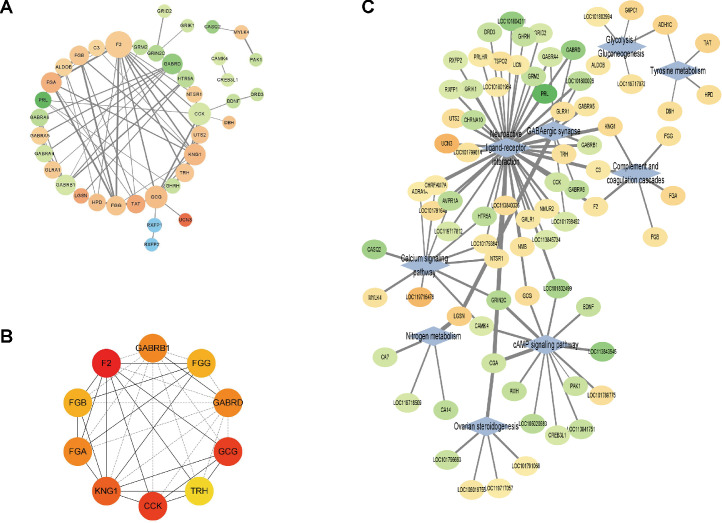
Feed costs account for approximately 60 to 70% of the cost of poultry farming, and feed utilization is closely related to the profitability of the poultry industry. To understand the causes of the differences in feeding in Shan Partridge ducks, we compared the hypothalamus transcriptome profiles of 2 groups of ducks using RNA-seq. The 2 groups were: 1) low-residual feed intake (LRFI) group with low feed intake but high feed efficiency, and 2) high-residual feed intake (HRFI) group with high feed intake but low feed efficiency. We found 78 DEGs were enriched in 9 differential Kyoto Encyclopedia of Genes and Genome (KEGG) pathways, including neuroactive ligand-receptor interaction, GABAergic synapse, nitrogen metabolism, cAMP signaling pathway, calcium signaling pathway, nitrogen metabolism, tyrosine metabolism, ovarian steroidogenesis, and gluconeogenesis. To further identify core genes among the 78 DEGs, we performed protein-protein interaction and coexpression network analyses. After comprehensive analysis and experimental validation, 4 core genes, namely, glucagon (GCG), cholecystokinin (CCK), gamma-aminobutyric acid type A receptor subunit delta (GABRD), and gamma-aminobutyric acid type A receptor subunit beta1 (GABRB1), were identified as potential core genes responsible for the difference in residual feeding intake between the 2 breeds. We also investigated the level of cholecystokinin (CCK), neuropeptide Y (NPY), peptide YY (PYY), ghrelin, and glucagon-like peptide1 (GLP-1) hormones in the sera of Shan Partridge ducks at different feeding levels and found that there was a difference between the 2 groups with respect to GLP-1 and NPY levels. The findings will serve as a reference for future research on the feeding efficiency of Shan Partridge ducks and assist in promoting their genetic breeding.
Keywords: RNA-seq; Shan Partridge ducks; hypothalamus; residual feed intake; serum hormone.
Copyright © 2024. Published by Elsevier Inc.
Figures


Similar articles
-
Association analysis between feed efficiency studies and expression of hypothalamic neuropeptide genes in laying ducks.Anim Genet. 2016 Oct;47(5):606-9. doi: 10.1111/age.12457. Epub 2016 Jun 22. Anim Genet. 2016. PMID: 27329478
-
Transcriptome analysis reveals key genes and signalling pathways related to residual feed intake in meat-type ducks.Animal. 2025 Jun;19(6):101521. doi: 10.1016/j.animal.2025.101521. Epub 2025 Apr 16. Animal. 2025. PMID: 40367888
-
Identification of key genes associated with residual feed intake in small-sized meat ducks through integrated analysis of mRNA and miRNA transcriptomes.Poult Sci. 2025 May;104(5):105058. doi: 10.1016/j.psj.2025.105058. Epub 2025 Mar 21. Poult Sci. 2025. PMID: 40132315 Free PMC article.
-
Neuroendocrine Peptides of the Gut and Their Role in the Regulation of Food Intake.Compr Physiol. 2021 Apr 1;11(2):1679-1730. doi: 10.1002/cphy.c200007. Compr Physiol. 2021. PMID: 33792904 Review.
-
Unveiling the Genetic Landscape of Feed Efficiency in Holstein Dairy Cows: Insights into Heritability, Genetic Markers, and Pathways via Meta-Analysis.J Anim Sci. 2024 Jan 3;102:skae040. doi: 10.1093/jas/skae040. J Anim Sci. 2024. PMID: 38354297 Free PMC article.
Cited by
-
Differential lipid metabolism in beef cattle: A comparative study of high and low residual feed intake bulls.Anim Nutr. 2025 Jul 12;22:214-229. doi: 10.1016/j.aninu.2025.03.019. eCollection 2025 Sep. Anim Nutr. 2025. PMID: 40896481 Free PMC article.
References
-
- Anand B.K., Brobeck J.R. Localization of a “feeding center” in the hypothalamus of the rat. Exp. Biol. Med. 1951;77:323–325. - PubMed
-
- Arango J. Hy-Line genetic program emphasizes efficient feed program. New Horiz. 2009;3:6–7.
-
- Beglinger C., Degen L. Fat in the intestine as a regulator of appetite—role of CCK. Physiol. Behav. 2004;83:617–621. - PubMed
MeSH terms
Substances
LinkOut - more resources
Full Text Sources
Miscellaneous
