. 2024 Feb 26;59(4):496-516.e6.
doi: 10.1016/j.devcel.2023.12.017. Epub 2024 Jan 15.

Tissue-resident macrophages specifically express Lactotransferrin and Vegfc during ear pinna regeneration in spiny mice

Affiliations

Tissue-resident macrophages specifically express Lactotransferrin and Vegfc during ear pinna regeneration in spiny mice

Jennifer Simkin et al. Dev Cell. .

Abstract

The details of how macrophages control different healing trajectories (regeneration vs. scar formation) remain poorly defined. Spiny mice (Acomys spp.) can regenerate external ear pinnae tissue, whereas lab mice (Mus musculus) form scar tissue in response to an identical injury. Here, we used this dual species system to dissect macrophage phenotypes between healing modes. We identified secreted factors from activated Acomys macrophages that induce a pro-regenerative phenotype in fibroblasts from both species. Transcriptional profiling of Acomys macrophages and subsequent in vitro tests identified VEGFC, PDGFA, and Lactotransferrin (LTF) as potential pro-regenerative modulators. Examining macrophages in vivo, we found that Acomys-resident macrophages secreted VEGFC and LTF, whereas Mus macrophages do not. Lastly, we demonstrate the requirement for VEGFC during regeneration and find that interrupting lymphangiogenesis delays blastema and new tissue formation. Together, our results demonstrate that cell-autonomous mechanisms govern how macrophages react to the same stimuli to differentially produce factors that facilitate regeneration.

Keywords: Csf1r; Lactotransferrin; Vegfc; lymphangiogenesis; macrophage; regeneration; resident macrophage; spiny mouse; wound healing.


Conflict of interest statement

Declaration of interests At the time of publication, D.T. is employed by Glakosmithkline (GSK).

Figures
Figure 1.
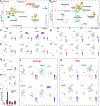
Figure 1.. Conditioned media from Acomys bone marrow derived macrophages (BMDM) stimulated with IFNγ+LPS reduces collagen production and increases Mmp9 expression in fibroblasts from both species.
A) Schematic of experimental design. Monocytes were isolated from Acomys or Mus bone marrow, activated with mCSF, then classically (IFNγ+LPS) or alternatively activated (IL4). These macrophages were cultured for 48hrs after which the media (macrophage conditioned media - MCM) was removed and used to stimulate Mus or Acomys primary ear fibroblasts. B) Flow analysis of BMDM using CD11b, CD14, CD68 and IBA1 after activation with mCSF and prior to stimulation with IFNγ+LPS or IL4. C) qPCR analysis for Socs3, Cd86, Cd206 and Tgfβ1 after stimulation with IFNγ+LPS (MIFNγ+LPS) or IL4 (MIL4). Gene expression presented as fold change over unstimulated cells (M0). †p<0.05 for MIFNγ+LPS compared to MIL4 stimulation. D) qPCR analysis of Acomys or Mus ear fibroblasts before stimulation: Collagen 1a1 (Col1a1), Fibronectin (Fn), Tenascin C (TenC), and matrix remodeling enzyme Matrix Metalloprotease 9 (Mmp9). Fold change reported as target gene expression compared to housekeeping gene expression (B2m and Tbp). Mean ± SEM, n=3 (C-D). E) qPCR for Col1a1 or Mmp9 expression by Mus or Acomys ear fibroblasts after exposure to MCMs. Fold change reported as expression compared to untreated fibroblasts. Colored bars = gene expression in fibroblasts exposed to MCM from MIFNy+LPS (red), MIL4 (grey) or M0 (black) macrophages. *p<0.05 for ANOVA comparing treatment within species. #p<0.05 for Tukey’s multiple comparison test comparing responses to Acomys MIFNy+LPS versus Mus MIFNy+LPS (Table S3–4) Mean ± SEM, n=3. Bottom panel, heat map visualization of Col1a1 and Mmp9 expression.
Figure 2.
Figure 2.. Acomys MIFNy+LPS macrophages adopt a muted inflammatory profile compared to Mus macrophages and specifically express Ltf, Vegfc and Pdgfa.
A-C) Cytokine analysis of conditioned media (MCM) from Acomys and Mus bone marrow derived macrophages (M0) and from IFNγ+LPS and IL4 stimulation profiles. *p<0.05 concentration (pg/ml) increase compared to M0. D) Venn diagram of upregulated genes in MIFNy+LPS macrophages compared to M0 after RNA-seq analysis. Shared and unique macrophage markers depicted in boxes. E) Top 11 differentially expressed genes encoding secreted proteins that were (i) not expressed in M0 from either species, (ii) were significantly upregulated in Acomys MIFNγ+LPS macrophages and (iii) were not expressed in MusIFNγ+LPS macrophages. FKPM = Fragments Per Kilobase of transcript per Million mapped reads. Increase in Acomys MIFNγ+LPS macrophages compared to M0 expression *p<0.05. F-G) qPCR analysis for Mmp9 (F) or Col1a1 (G) expression by Mus ear fibroblasts stimulated with exogenous IL1A, LTF, PDGF-AA, VEGFC or Acomys macrophage conditioned media (MCM). Fold change represented as expression increase compared to unstimulated Mus ear fibroblasts. Mean ± SEM. *p<0.05 compared to unstimulated fibroblasts.
Figure 3.
Figure 3.. Single cell RNA-seq analysis of tissue undergoing regeneration or fibrotic repair five days post injury.
A-B) UMAP analysis of recovered cell types from healing ear pinna tissue at D5 (post injury) in Acomys (A) and Mus (B). C-F) Feature plots for genes enriched (purple) in Acomys (C) and Mus (D) infiltrating monocyte/macrophage (Cd14, IL1b, S100a8) genes and in Acomys (E) and Mus (F) tissue resident macrophage genes (Csf1r, Cd68, Cd206). G-H) Feature plot showing no Arginase 1 (Arg1) expression in Acomys cells (G) and Arg1 expression in Mus resident macrophages (H). I) Arginase 1 activity assay on tissue isolated at D0, 5, 10, 15, and 20 post injury from Mus (blue bars) or Acomys (red bars) ear pinna. Two-way ANOVA, Sidak’s multiple comparison test,*p<0.05 increase in activity compared to other species at same time point. Mean ± SEM. J-K) Il1a, Pdgfa, Vegfc, and Ltf expression in Acomys (J) and Mus (J). Dotted red circles highlight infiltrating (C-D) or tissue resident (E-F) macrophage populations.
Figure 4.
Figure 4.. Resident and infiltrating macrophages maintain distinct identities throughout regeneration and fibrotic repair.
A) scRNA-seq analysis and UMAP projection of all cells from Acomys and Mus collected from tissue at D0, 3, 5, 10, and 15. Cells were batch-corrected to account for species-differences and segregated based on cell type. Feature plot analysis for Tyrobp and Fcer1g which mark all macrophages in both species. B) UMAP for all macrophages at all timepoints separated by species and type. C) Day post injury mapped onto (B) with timepoints represented in legend. D) Top differentially expressed genes between infiltrating and resident macrophage clusters independent of species. E) Top differentially expressed genes separated by species and macrophage type (infiltrating vs. resident) across time. Point size represents percent cells expressing a specific gene. Color intensity represents average expression level for those cells expressing the gene of interest (D-E). F) Feature plots for Ltf, Pdgfa, Il1a, and Vegfc identified from our in vitro experiment (Fig. 3). Red (Acomys) and green (Mus) arrows highlighting resident macrophage population for all time points. Black arrow highlighting Acomys infiltrating population for all time points. G) Line graph of gene expression over time after injury for Ltf, Pdgfa, and Vegfc showing expression change over time.
Figure 5.
Figure 5.. Acomys resident macrophages express high levels of Vegfc and Ltf transcripts five days post injury.
A) FACS analysis of macrophage population from ear pinna tissue at D5 using CD11b and CSF1r. B) Expression of Ltf, Pdgfa, Il1a, Vegfc, and Arg1 in CD11b+;CSF1R+ cells isolated by FACS in (A). Fold change (2−ΔCt) calculated as expression compared to housekeeping genes (Tbp, B2m). Two-tailed t-test *p<0.05, ** p<0.01, ***p<0.001. C-H) RNAscope analysis for Cd14 and Csf1r, and either Ltf, Vegfc or Pdgfa expression at D5 post injury in Mus and Acomys ear pinna (C,E,G). Green arrow = Cd14+;Csf1r;(GOI+) cells where GOI = gene of interest. White arrow = Cd14+;Csf1r+;(GOI+) cells. Purple arrow = Csf1r+;Cd14;(GOI+) cells. Green arrow = Csf1r;Cd14+;(GOI+) cells. Yellow arrow = neutrophil. D) Quantification (fluorescent dots/cell) indicating number of transcripts per cell (D,F,H). Blue-red intensity legend represents number of Csf1r gene transcripts within the same cell. Scale bar = 10μm. Representative images from n=3 (D,F,H). Two-Way ANOVA and Post Hoc analysis by Tukey HSD. Mean ± SEM. *p<0.05, ** p<0.01, ***p<0.001, ns = not significantly different.
Figure 6.
Figure 6.. Acomys fibroblast and endothelial cells express receptors for Vegfc and Ltf ligands.
A-D) Receptor-ligand analysis at D5 showing ligands expressed from infiltrating and resident macrophages from each species with cognate receptor expression for fibroblasts (A-B) and endothelial cells (C-D). Red asterisks mark Vegfc-Itgb1 (Acomys), Vegfc-Nrp2 (Acomys), Ltf-Lrp1 (Acomys), Pdgfa-Pdgfrb (Acomys), and Vegfa-Kdr (Mus), Vegfa-Nrp1 (Mus), Vegfa-Nrp2 (Mus) and Vegfa-Itgb1 (Mus). E) Western blot analysis of LTF, VEFC and PDGFA proteins from ear pinna tissue isolated at D0, 5, 10, 15, and 20 post injury Representative blots for n=3 animals. F-G’) RNAscope analysis of Csf1r and Vegfc expression at D5 post injury in PBS-Liposome (PBS-Lipo) and Clodronate Liposome (Clo-Lipo) injected Acomys ear pinna (see Methods). In response to Clo-Lipo, Csf1r+ and Vegfc+ cells were strongly reduced (G-G’) compared to control ears (F-F’). Scale bar = 200μm (F, G), 50μm (F,G’). Representative images from n=3. H) Western blot analysis from ear pinna tissue isolated at D0, 5, 10, 15, and 20 post injury from Mus and Acomys for VEGFR2 and 3 and their phosphorylated forms at tyrosine 1175 and 1230 respectively. Representative blots for n=3 animals. GAPDH = loading control (E,H).
Figure 7.
Figure 7.. Inhibiting VEGFC-receptor interaction negatively impacts ear pinna regeneration.
VEGFC blocking antibody (Vegfc-BAb) or Rabbit IgG (IgG) were injected subcutaneously daily into the base of the Acomys ear pinna for 10 days after injury. A) Western blot analysis of pVEGFR3, total VEGFR3, pVEGFR2, and total VEGFR2 at D10 and D20. GAPDH for loading control. Western analysis of pVEGFR3 and pVEGFR2 in Vegfc-BAb ears at D10 and D20 compared to control. B) Masson’s trichrome stained sections of IgG and Vegfc-BAb at D20 with no newly forming hair follicles (black arrows). Injury site represented by black dotted line. C) Significantly fewer hair follicles in Vegfc-BAb ears (n=4/group). D) Vegfc-Bab ears delayed new tissue formation, but ultimately open holes closed by D60 (n=5/group). Two-Way ANOVA and Post Hoc analysis by Student’s t-test pairwise comparison. E) Immunofluorescence for PROX1 at D10. Magnified regions in E to the right panel show significantly fewer PROX1+ cells in treatment ears. F) PROX1+ cells (from E) significantly declined in Vegfc-BAb treated ears. G-K) Immunofluorescence for PROX1 and EdU at D20 in IgG or Vegfc-BAb treated ears Boxed regions are magnified from treatment and controls and shown in separate channels for IgG (H-I) and Vegfc-Bab (J-K) (n=5/group). L) Immunostaining for CD31 and EdU at D20 in Vegfc-Bab and control ears. Boxed regions highlight decline in CD31+ cells. M-O) Quantification of percent EdU+ (M), CD31+ (N) and EdU+;CD31+ (O) cells normalized to total Hoechst positive cells at D20 (n=5/group). P) IBA1+ macrophages with and without CD31 in IgG or Vegfc-BAb treated at D10 (n=4/group). Scale bars = 200μm (C,E,G,L) and 50μm (E,H-K,L insets). Mean ± SEM. Two tailed Student’s t-test in C, F, M-P. *p<0.05, ** p<0.01, ***p<0.001.

References

    1. Godwin JW, Pinto AR, and Rosenthal NA (2013). Macrophages are required for adult salamander limb regeneration. Proc Natl Acad Sci U S A 110, 9415–9420. 10.1073/pnas.1300290110. - DOI - PMC - PubMed
    1. Li L, Yan B, Shi YQ, Zhang WQ, and Wen ZL (2012). Live imaging reveals differing roles of macrophages and neutrophils during zebrafish tail fin regeneration. J Biol Chem 287, 25353–25360. 10.1074/jbc.M112.349126. - DOI - PMC - PubMed
    1. Petrie TA, Strand NS, Yang CT, Rabinowitz JS, and Moon RT (2014). Macrophages modulate adult zebrafish tail fin regeneration. Development 141, 2581–2591. 10.1242/dev.098459. - DOI - PMC - PubMed
    1. Alexander KA, Chang MK, Maylin ER, Kohler T, Muller R, Wu AC, Van Rooijen N, Sweet MJ, Hume DA, Raggatt LJ, and Pettit AR (2011). Osteal macrophages promote in vivo intramembranous bone healing in a mouse tibial injury model. Journal of bone and mineral research : the official journal of the American Society for Bone and Mineral Research 26, 1517–1532. 10.1002/jbmr.354. - DOI - PubMed
    1. Aurora AB, Porrello ER, Tan W, Mahmoud AI, Hill JA, Bassel-Duby R, Sadek HA, and Olson EN (2014). Macrophages are required for neonatal heart regeneration. J Clin Invest 124, 1382–1392. 10.1172/JCI72181. - DOI - PMC - PubMed

Publication types