. 2024 Feb 5;34(3):531-540.e5.
doi: 10.1016/j.cub.2023.12.047. Epub 2024 Jan 15.

Descending control and regulation of spontaneous flight turns in Drosophila

Affiliations

Descending control and regulation of spontaneous flight turns in Drosophila

Ivo G Ros et al. Curr Biol. .

Abstract

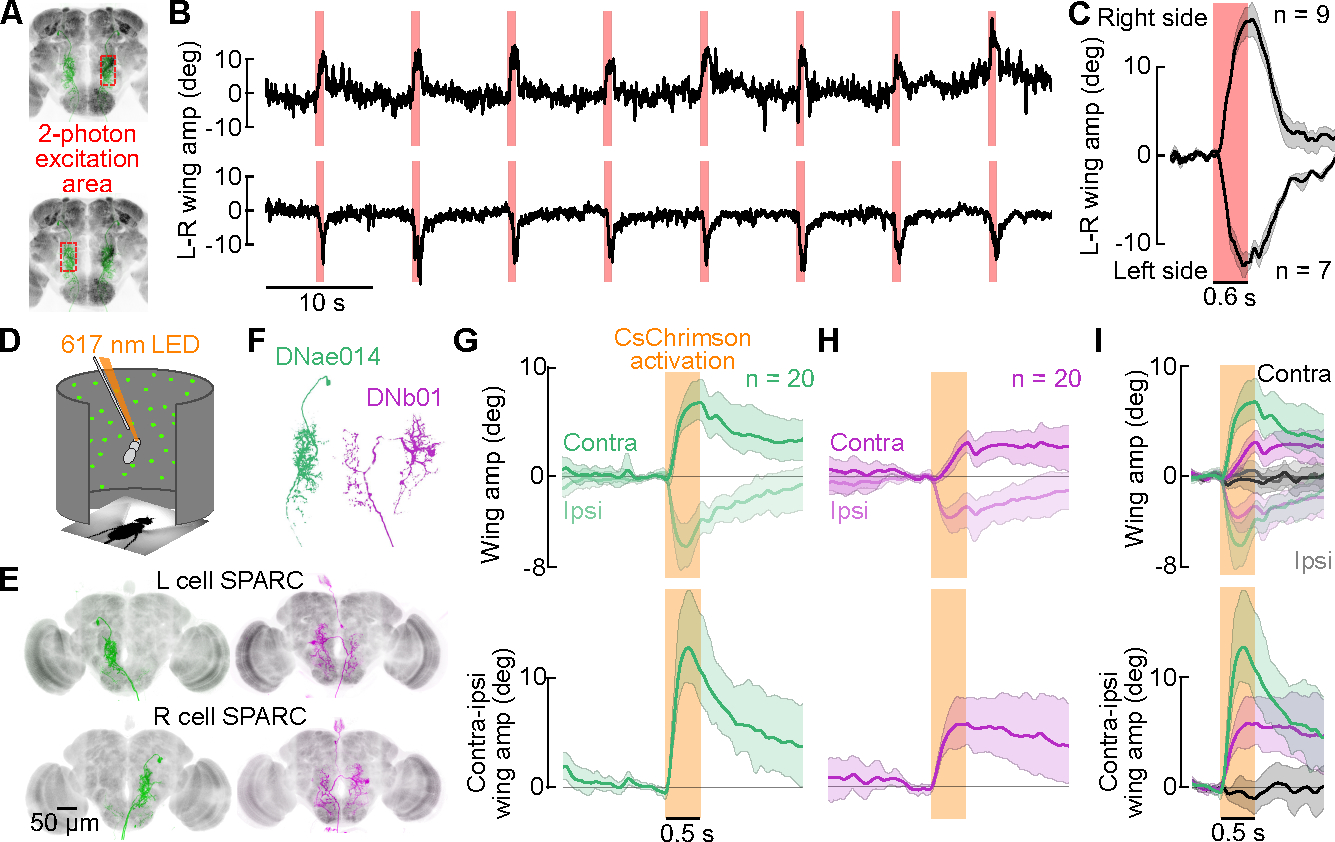
The clumped distribution of resources in the world has influenced the pattern of foraging behavior since the origins of locomotion, selecting for a common search motif in which straight movements through resource-poor regions alternate with zig-zag exploration in resource-rich domains. For example, during local search, flying flies spontaneously execute rapid flight turns, called body saccades, but suppress these maneuvers during long-distance dispersal or when surging upstream toward an attractive odor. Here, we describe the key cellular components of a neural network in flies that generate spontaneous turns as well as a specialized pair of neurons that inhibits the network and suppresses turning. Using 2-photon imaging, optogenetic activation, and genetic ablation, we show that only four descending neurons appear sufficient to generate the descending commands to execute flight saccades. The network is organized into two functional units-one for right turns and one for left-with each unit consisting of an excitatory (DNae014) and an inhibitory (DNb01) neuron that project to the flight motor neuropil within the ventral nerve cord. Using resources from recently published connectomes of the fly, we identified a pair of large, distinct interneurons (VES041) that form inhibitory connections to all four saccade command neurons and created specific genetic driver lines for this cell. As predicted by its connectivity, activation of VES041 strongly suppresses saccades, suggesting that it promotes straight flight to regulate the transition between local search and long-distance dispersal. These results thus identify the key elements of a network that may play a crucial role in foraging ecology.

Keywords: command neurons; flight saccades; local search; locomotion; long-distance dispersal; spontaneous activity.


Conflict of interest statement

Declaration of interests The authors declare no competing interests.

Figures

Figure 1.
Figure 1.. Activities of DNae014 and DNb01 correlate strongly with spontaneous saccades.
(A) Flight trajectory and photomontage illustrating a single saccade, adapted from,. (B) Schematic of set-up for monitoring neural activity with GCaMP7f and simultaneously tracking wingstroke amplitudes during flight. (C) Fly with central nervous system. (D) Anatomy of right DNae014 (green) and DNb01 (magenta) cells in the brain and VNC. (E) Bilateral expression patterns of DNae014 and DNb01 cells in the brain from split-GAL4 lines, showing the fields of view scanned in 2-photon experiments (dashed boxes). Black arrows indicate somata. (F) Top: left (dark gray) and right (light gray) wingstroke amplitudes. Bottom: normalized GCaMP7f fluorescence (ΔF/F) in left and right DNae014 cells during a 90 s flight epoch. (G) Similar to (F) but for DNb01. (H) Right-left difference in DNae014 signals (green) superimposed with left-right difference in wingstroke amplitudes (black). Both traces are normalized by z-score from the traces above in F. Automatically detected right and left saccades depicted as green dots above and below, respectively. (I) Similar to H, but for DNb01. (J) Pooled regressions for DNae014 (green) and DNb01 (magenta) of left vs. right cell activity (ΔF/F), normalized by z-score (n = 19 flies) and plotted as a kernel density estimate. (K) Regressions of L-R wingstroke amplitude vs. R-L ΔF/F, across 19 flies for DNae014 (green; r2 = 0.89±0.04, mean±sd) and DNb01 (magenta, r2 = 0.90±0.03, mean±sd). (L) Changes in DNae014 (left column) and DNb01 (right column) cell activity aligned to the onset of spontaneous flight saccades (vertical line). Presented as right saccades. Top traces: baseline-subtracted wingstroke amplitudes of left (dark gray), right (light gray) wings, along with left-right difference (black). Bottom traces: ΔF/F signals for right cell (light color), left cell (dark color), and right-left difference (black). Solid lines indicate mean of means for all individuals (n = 19 flies for each dataset); shaded areas indicate boot-strapped 95% CIs. See also Figure S1, Videos S1 and S2.
Figure 2.
Figure 2.. DNae014 and DNb01 are active during saccades elicited by visual loom.
(A) Visual azimuth directions of looming stimuli from −72°, −36°, 0°, 36°, and 72° (left to right). Traces below indicate the time course of stimulus size. (B) Normalized GCaMP7f fluorescence for DNae014 (left panels, green, n = 9), and DNb01 (right panels, magenta, n = 12) in response to each stimulus direction for left cell (L), right cell (R), and bilateral differential (black, R-L). Solid lines represent the grand mean of the mean traces for individual flies, the shaded areas indicated the boot-strapped 95% confidence intervals (CIs). (C) Wingstroke amplitude responses to every stimulus direction of left (L), right (R), and differential (L-R) wingstroke amplitudes. (D) Bilateral difference (R-L) ΔF/F for peak stimulus responses to each loom direction, plotted as mean of means with boot-strapped 95% CIs. DNae014 (green) responded more strongly but with a similar sign relative to stimulus direction, compared to DNb01 (magenta). Peak responses for DNae014 ΔF/F were larger than those for DNb01 (p < 0.001; two-way ANOVA with cell type and loom direction as the main effects and individual as a random effect). See also Video S1 and S2.
Figure 3.
Figure 3.. Unilateral activation of either DNae014 and DNb01 elicits directional saccades.
(A-C) Unilateral 2-photon excitation of either left or right DNae014 neurons. (A) Approximate 2-photon excitation areas of the right and left dendritic arbors of DNae014. (B) Example traces of L-R wingstroke amplitude during unilateral CsChrimson excitation on the left (top) or right (bottom) side of brain. (C) L-R wing amplitudes aligned to the excitation light pulse. As in all panels, solid lines indicate the mean of all individual means, the shaded patch indicates the boot-strapped 95% CI; n = 9 flies for right stimulations, n = 7 flies for left stimulations. (D-I) Unilateral activation of DNae014 or DNb01 neurons in rigidly tethered flies using split-GAL4 and SPARC expression of CsChrimson. (D) Flight arena with 617 nm excitation light. (E) Maximum intensity projection of TdTomato signal in examples of unilateral cell expression using SPARC with split-GAL4 drivers for DNae014 (green) and DNb01 (magenta). Nc82 staining shown in grey. (F) Representative morphology of right DNae014 and DNb01 cells. (G) Contralateral and ipsilateral wingstroke amplitudes (top) and contralateral-ipsilateral difference (bottom), aligned to activation pulse; n= 20 flies. (H) Similar to G, but for DNb01; n = 20 flies. (I) Combined data from G and H, including control flies (black traces, gray envelopes) in which neither cell expressed CsChrimson; n = 20, 20, and 19 for DNae014, DNb01, and controls, respectively. See also Video S1 and S2.
Figure 4.
Figure 4.. Ablation of either DNae014 or DNb01 alters saccade dynamics.
(A) Riged-tether flight arena with IR backlighting to track wingstroke amplitudes. (B) Transient changes in L-R wingstroke amplitude indicate fictive saccades. Example control fly (top, grey), DNae014-ablated fly (middle, green), and DNb01-ablated fly (bottom, magenta) (C) Individual saccade rates in the rigid tethered arena (n = 26, 25, 36, respectively). (D) Magnotether flight arena with IR backlighting to track body angle and a static visual pattern. (E) Example traces with saccades apparent as rapid changes in body angle and angular velocity transients (black traces). (F-J) Color codes as in B. n = 22, 23, 22 flies, respectively. (F) Saccade rates in the magnotether arena, plotted as mean of individual fly means and boot-strapped 95% CI. (G) Cumulative histogram of inter-saccade intervals. (H) Maximum inter-saccade interval (ISImax) for each 2-minute trial. (I) Fraction of saccades syndirectional with the previous saccade. (J) Relationship between peak saccade speed and saccade magnitude. Dashed line: Orthogonal-distance regression fit of a 2nd order polynomial to pooled data of control flies. (K) Peak saccade speed normalized to fit in I, plotted as mean of individual fly means and boot-strapped 95% CI. Statistical differences were assessed using Kruskal-Wallis tests with Tukey’s HSD method for post-hoc comparisons (C, F, H, I, K; *** = p<0.001; n.s. = not significant). See also Figure S2, Video S1 and S2.
Figure 5.
Figure 5.. VES041 neurons innervate all DNae014 and DNb01 cells, along with several of their upstream targets.
(A) Left saccade-generating unit (SGU) consisting of DNae014 (green) and DNb01 (magenta) cells (from FlyWire). (B) Schematized model for network generating left and right saccades. Bright colors or black indicate active neurons; pale colors or gray indicate inactive neurons. (C) Connectivity of putative members of the network that regulates directed saccades (rows) to SGU neurons DNae014 and DNb01 (columns; arrow indicates direction of information flow). Our analysis identified neurons that form input synapses to both SGU cells (SGUIs), neurons that form connections between ipsilateral and contralateral SGUIs (I to C SGUIs), and a neuron that connects to all four SGU cells (VES041). Connectivity data are averaged assuming symmetrical arrangement of left and right network members. (D) Morphology of the left VES041 cell in FlyWire. (E) Connections of VES041 cells (blue for left; grey for right) to both SGUs and bilateral pairs of SGUIs and intermediary neuron types. Colors match representations in Figure S4C–J. Line thickness is proportional to log of synapse count. See also Figures S3, S4, S5, Tables S1, S2, and S3.
Figure 6.
Figure 6.. Activation of GABAergic VES041 neurons suppresses spontaneous saccades.
(A) Split-GAL4 lines constructed to target VES041 (green, GFP). (B) Optogenetic activation of VES041 in a magnotether arena using a 623 nm LED ring light (orange annulus in B, orange patches in C). (C) Top: empty vector control fly, with right and left saccades (dots above and below the panel) identified using angular velocity of body orientation (grey trace). Middle and bottom: activation of VES041 drivers 1 and 2 (angular velocity in blue). (D) Raster plots represent spontaneous saccades (black dots), during exposure to 623 nm light (orange patch). Each set of three rows are the presentations for an individual fly. Left: empty vector split-GAL4 line driving CsChrimson; middle and right: VES041 split-GAL4 lines 1 and 2 driving CsChrimson. Gray histograms indicate mean saccade rate across populations. (E) Individual saccade rates during light-off and light-on epochs for control and the two VES041 drivers; Each line represents an individual fly (n = 20, 24, and 23 flies). (F) Individual differences in saccade rate from the light-off to light-on condition for the same groups as in E. (** = p<0.01; *** = p<0.001; n.s. = not significant, Kruskal-Wallis test followed by post-hoc comparisons with Tukey’s HSD method). See also Figure S6, Table S1, and Video S3.

Update of

Comment in

Similar articles

Cited by

References

    1. Berg HC (2000). Motile behavior of bacteria. Physics Today 53, 24–29. 10.1063/1.882934. - DOI
    1. Collett TS, and Land MF (1975). Visual control of flight behaviour in the hoverfly, Syritta pipiens L. J. Comp. Physiol. 99, 1–66. 10.1007/BF01464710. - DOI
    1. Cellini B, Salem W, and Mongeau J-M (2021). Mechanisms of punctuated vision in fly flight. Curr. Biol. 31, 4009–4024.e3. 10.1016/j.cub.2021.06.080. - DOI - PubMed
    1. Land MF (1999). Motion and vision: why animals move their eyes. J. Comp. Physiol. A 185, 341–352. 10.1007/s003590050393. - DOI - PubMed
    1. Schilstra C, and van Hateren JH (1998). Stabilizing gaze in flying blowflies. Nature 395, 654–654. 10.1038/27114. - DOI - PubMed

LinkOut - more resources