. 2024 Feb 13;57(2):245-255.e5.
doi: 10.1016/j.immuni.2023.12.010. Epub 2024 Jan 15.

Lack of affinity signature for germinal center cells that have initiated plasma cell differentiation

Affiliations

Lack of affinity signature for germinal center cells that have initiated plasma cell differentiation

Henry J Sutton et al. Immunity. .

Abstract

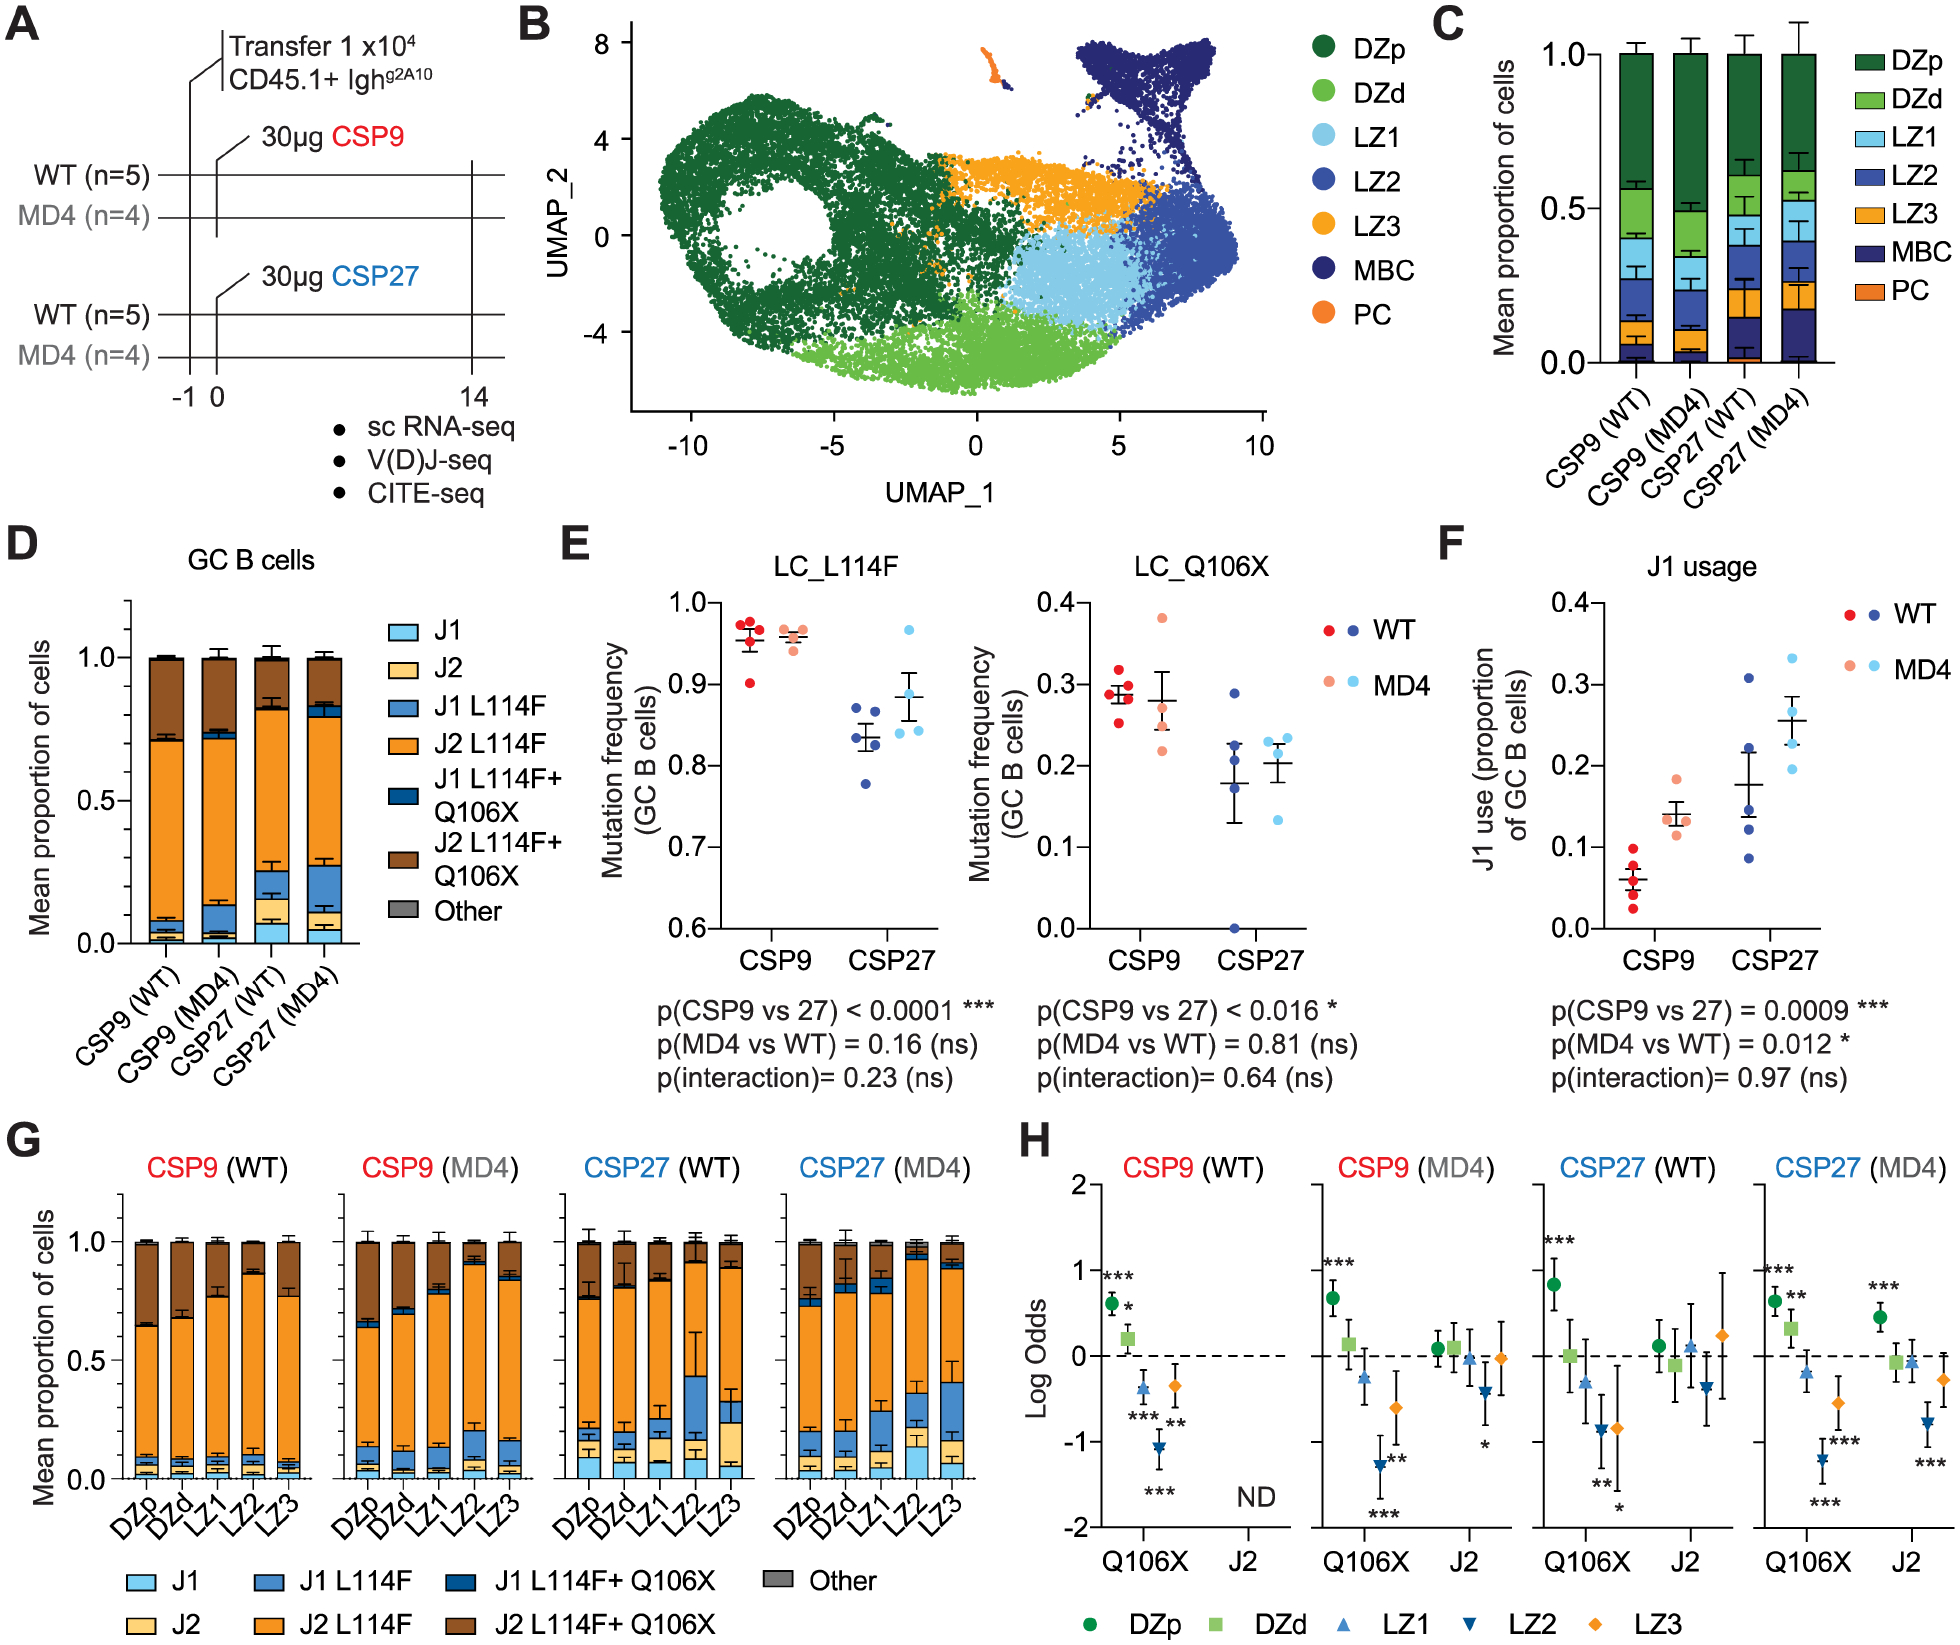
Long-lived plasma cells (PCs) secrete antibodies that can provide sustained immunity against infection. High-affinity cells are proposed to preferentially select into this compartment, potentiating the immune response. We used single-cell RNA-seq to track the germinal center (GC) development of Ighg2A10 B cells, specific for the Plasmodium falciparum circumsporozoite protein (PfCSP). Following immunization with Plasmodium sporozoites, we identified 3 populations of cells in the GC light zone (LZ). One LZ population expressed a gene signature associated with the initiation of PC differentiation and readily formed PCs in vitro. The estimated affinity of these pre-PC B cells was indistinguishable from that of LZ cells that remained in the GC. This remained true when high- or low-avidity recombinant PfCSP proteins were used as immunogens. These findings suggest that the initiation of PC development occurs via an affinity-independent process.

Keywords: B cells; Plasmodium; affinity maturation; germinal center; plasma cells; single-cell RNA-seq.


Conflict of interest statement

Declaration of interests The authors declare no competing interests.

Figures

Figure 1
Figure 1. Affinity determinants and their influence on early cell fate choice in Ighg2A10 cells
A. Flow cytometry plots demonstrating 3 distinct populations of Ighg2A10 B cells separated by their binding to PfCSP repeat ((NANP)9-PE and (NANP)9-APC probes B. The LC-CDR3 amino acid sequence and Igkj gene used by each probe binding population compared to the predicated germline 2A10 LC-CDR3. C. ELISA showing the PfCSP binding ability of recombinant antibodies generated using sequences from (C) compared to 2A10 D. Representative flow plots demonstrating the gating strategy used to sort PfCSP-specific Ighg2A10 PB, GC and EM B cells 4 days post PbPf-SPZ immunizations. E. Igkj gene usage in either naïve Ighg2A10 B cells or PB, GC and EM B cells 4 days post immunization with Pb-PfSPZ. F. Proportions of Ighg2A10 PB, GC or EM B cells utilizing either the J1, J2 or J4 Igkj gene G. Experimental schematic of time course analysis of Ighg2A10 GC evolution. H. Representative flow cytometry plot plots demonstrating the gating strategy used to identify PfCSP-specific Ighg2A10 PCs in the BM. I. Frequency of J gene usage and occurrence of LC_L114X and/or LC_Q106X mutations in GC B cells over time. J. The number of PfCSP-specific Ighg2A10 PC per femur pair over time K. Frequency of J gene usage and occurrence of LC_L114X and/or LC_Q106X mutations in BM PCs over time. L. Competition ELISA showing the binding of the indicated to rAbs to plate bound (NANP)9 peptide in the presence of the indicated concentrations of soluble (NANP)9 peptide; Mean ± SEM shown from 3 independent experiments. M. Affinities (KD) of mAbs carrying the indicated variants; all values represent the geometric mean of binding signals collected in duplicate from n = 2 independent experiments. ND, could not be determined.
Figure 2:
Figure 2:. Single cell RNA-seq identifies populations of PreMems and PrePCs within the GC
A. Experimental Schematic. B. Unsupervised clustering of PfCSP -specific Ighg2A10 B cells pooled from all mice visualized using UMAP. Each cell is represented by a point and coloured by cluster C. Heatmap of key genes differentially expressed between clusters. D. Overall frequencies of each population at different days, bars are mean ± SEM by mouse. E. Frequencies of LZ3 and DZ cells in the GC in each mouse; analysis by by 2-tailed t-test. F. Gating strategy for the sorting of Mem, DZ, LZ1+LZ2 and LZ3 populations. G. Representative FACS plots showing live B cells after culture of the indicated cells in the indicated conditions. H. Number of PCs recovered after αCD40-IL21 or I. αCD40-IL21-Antigen stimulation; circles are technical replicates from 3 independent experiments indicated by different shading; analysis by one-way ANOVA including experiment as a blocking factor in the model
Figure 3:
Figure 3:. Mutational dynamics the germinal center.
Mice were immunized and analyzed as in Figure 2A. A. Frequency of J gene usage and occurrence of LC_L114F and LC_Q106X mutations 7 days post immunization in non-GC and GC populations; data are expressed as mean ± SD of the 5 mice. B. Likelihood of the LC_L114F mutation being present in different GC populations 7 days post immunization; data are expressed as Log Odds ±95% CI from logistic regression analysis controlling for mouse as random effect. C. Mean AA substitutions in each mouse 7 days post immunization in non-GC and GC populations; data are expressed as mean ± SD. D. Frequency of J gene usage and occurrence of L114X and/or Q106X mutations 21 days post immunization in non-GC and GC populations; data are expressed as mean ± SD of the 5 mice. E. Likelihood of the LC_Q106X mutation being present in different GC populations 21 days post immunization; data are expressed as Log Odds ±95% CI from logistic regression analysis controlling for mouse as random effect. F. Mean AA substitutions in each mouse 21 days post immunization in non-GC and GC populations; data are expressed as mean ± SD. G. Frequency (mean ± SEM) of mutation at each HC and LC AA position in each mouse ranked from highest to lowest, inset shows the frequency of the top 10 mutations at day 21. H. Proportion of mutations accounted for by mutations at each position, ranked from most to least common. I. Likelihood of each of the top 10 most common mutations being found in cells in different GC populations; data are expressed as Log Odds ±95% CI from main effect logistic regression analysis controlling for mouse as random effect.
Figure 4:
Figure 4:. Affinity relationships in the GC after protein immunization
A. Experimental Schematic. B. Unsupervised clustering of Ighg2A10 B cells pooled from all mice visualized using UMAP. Each cell is represented by a point and coloured by cluster. C. Overall frequencies of each population under different immunization conditions, bars are mean ± SEM by mouse. D. Frequency of J gene usage and occurrence of LC_L114F and LC_Q106X mutations among GC B cells data are expressed as mean ± SD of the individual mice. E. Frequency of the LC_L144F and LC_Q106X mutations in different immunization conditions; mean ± SEM shown, analysis by two-way ANOVA. F. Frequency of J1 usage in different immunization conditions; mean ± SEM shown, analysis by two-way ANOVA. G. Frequency of J gene usage and occurrence of LC_L114F and LC_Q106X mutations 7 days post immunization in non-GC and GC populations; data are expressed as mean ± SD of the 5 mice. H. Likelihood of the LC_L114F mutation being present in different GC populations 7 days post immunization; data are expressed as Log Odds ±95% CI from logistic regression analysis controlling for mouse as random effect.

References

    1. Plotkin SA (2020). Updates on immunologic correlates of vaccine-induced protection. Vaccine 38, 2250–2257. 10.1016/j.vaccine.2019.10.046. - DOI - PubMed
    1. Amanna IJ, Carlson NE, and Slifka MK (2007). Duration of humoral immunity to common viral and vaccine antigens. N Engl J Med 357, 1903–1915. 10.1056/NEJMoa066092. - DOI - PubMed
    1. Slifka MK, Matloubian M, and Ahmed R (1995). Bone marrow is a major site of long-term antibody production after acute viral infection. J Virol 69, 1895–1902. 10.1128/JVI.69.3.1895-1902.1995. - DOI - PMC - PubMed
    1. Slifka MK, and Ahmed R (1996). Long-term antibody production is sustained by antibody-secreting cells in the bone marrow following acute viral infection. Ann N Y Acad Sci 797, 166–176. 10.1111/j.1749-6632.1996.tb52958.x. - DOI - PubMed
    1. Jerne NK (1951). A study of avidity based on rabbit skin responses to diphtheria toxin-antitoxin mixtures. Acta Pathol Microbiol Scand Suppl (1926) 87, 1–183. - PubMed

Publication types