. 2024 Jan 16;7(3):e202302471.
doi: 10.26508/lsa.202302471. Print 2024 Mar.

The origin, evolution, and molecular diversity of the chemokine system

Affiliations

The origin, evolution, and molecular diversity of the chemokine system

Alessandra Aleotti et al. Life Sci Alliance. .

Abstract

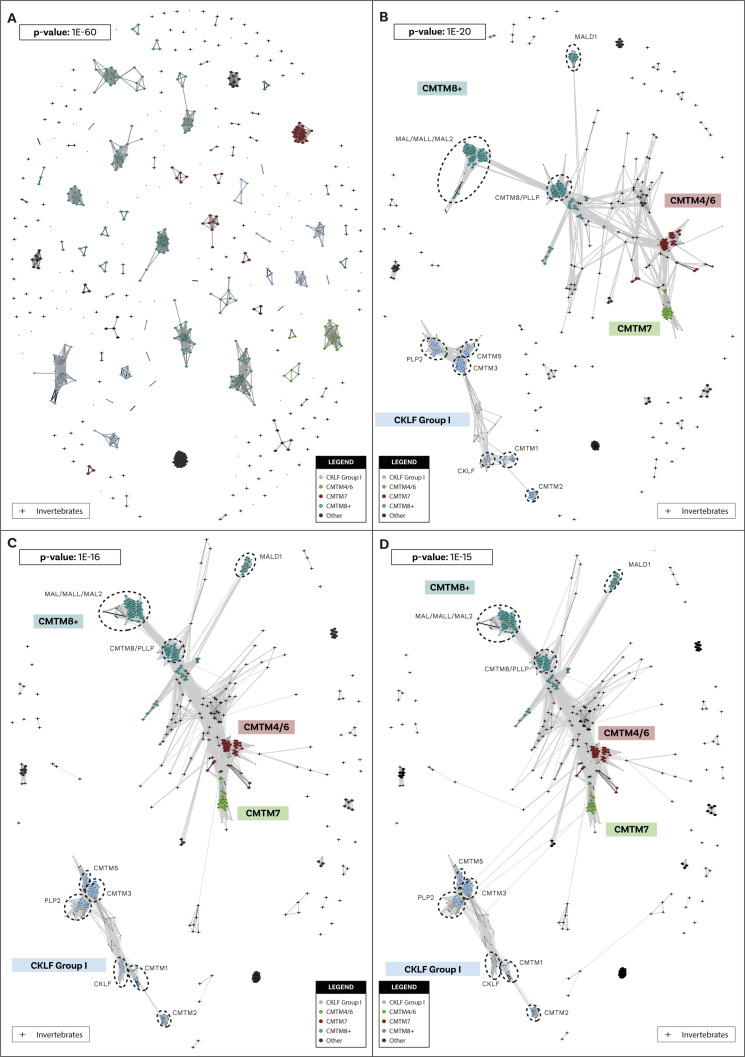
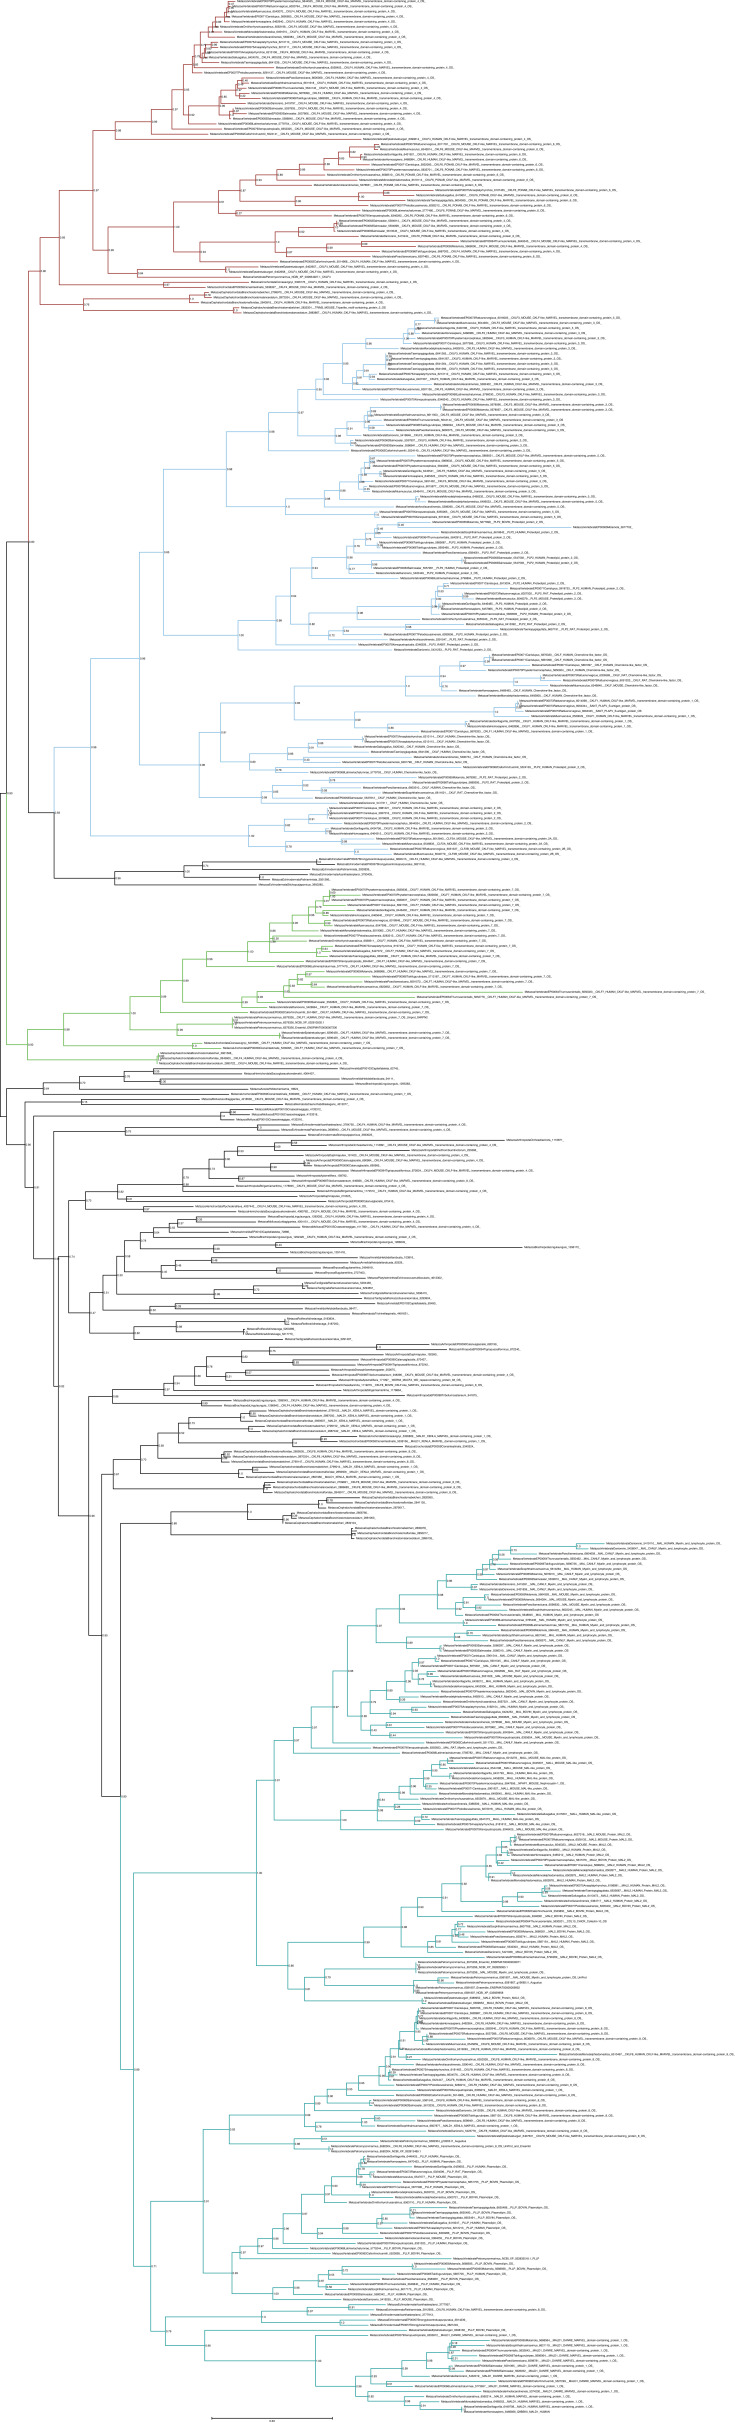
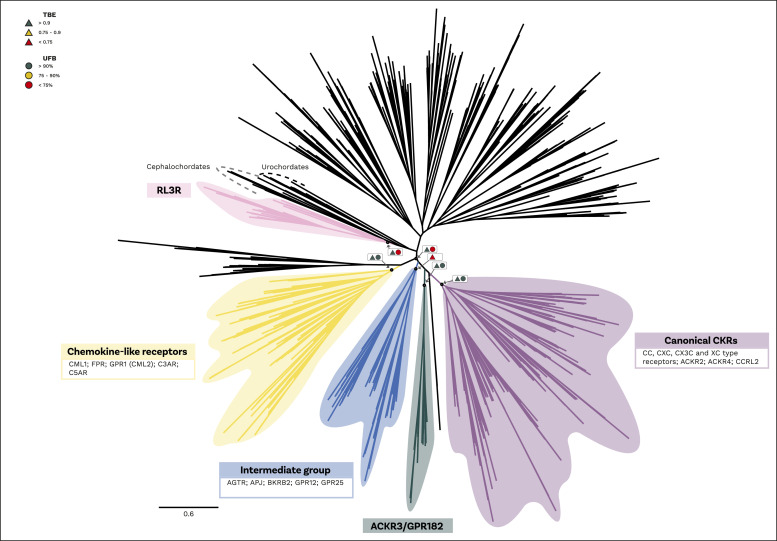
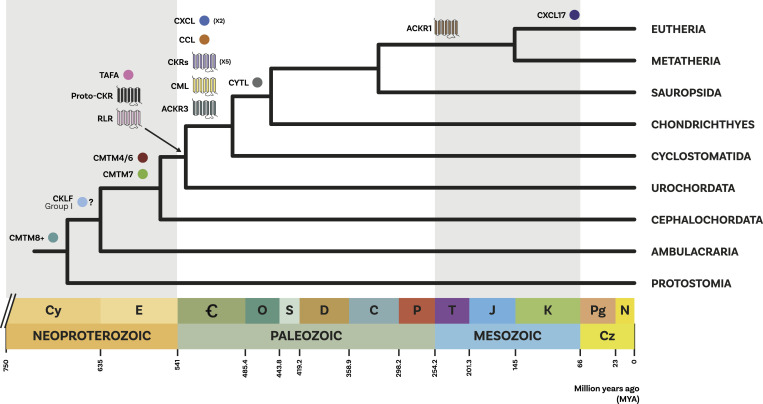
Chemokine signalling performs key functions in cell migration via chemoattraction, such as attracting leukocytes to the site of infection during host defence. The system consists of a ligand, the chemokine, usually secreted outside the cell, and a chemokine receptor on the surface of a target cell that recognises the ligand. Several noncanonical components interact with the system. These include a variety of molecules that usually share some degree of sequence similarity with canonical components and, in some cases, are known to bind to canonical components and/or to modulate cell migration. Whereas canonical components have been described in vertebrate lineages, the distribution of the noncanonical components is less clear. Uncertainty over the relationships between canonical and noncanonical components hampers our understanding of the evolution of the system. We used phylogenetic methods, including gene-tree to species-tree reconciliation, to untangle the relationships between canonical and noncanonical components, identify gene duplication events, and clarify the origin of the system. We found that unrelated ligand groups independently evolved chemokine-like functions. We found noncanonical ligands outside vertebrates, such as TAFA "chemokines" found in urochordates. In contrast, all receptor groups are vertebrate-specific and all-except ACKR1-originated from a common ancestor in early vertebrates. Both ligand and receptor copy numbers expanded through gene duplication events at the base of jawed vertebrates, with subsequent waves of innovation occurring in bony fish and mammals.


Conflict of interest statement

The authors declare that they have no conflict of interest.

Figures

Figure 1.
Figure 1.. Cluster Analysis and phylogeny of ligand groups.
(A) Similarity-based clustering, using Cluster Analysis of Sequences, of canonical chemokines and related molecules with sequence similarity. Canonical chemokines are an independent group from other related molecules (TAFA, CYTL, and CXCL17). Canonical chemokines are composed of two large groups (CC type and CXC type) within which some divergent subgroups are highlighted. The clustering and connections shown are at the P-value threshold of 1 × 10⁻⁶. Other P-values tested are shown in Fig S1. Candidate invertebrate sequences are shown as crosses and further information regarding them can be found in the Supplementary results section. (B) Similarity-based clustering, using Cluster Analysis of Sequences, of the chemokine-like factor (CKLF) super family (CKLFSF). Two major clusters are formed: the smaller “CKLF Group I” and the heterogenous “CKLF group II” that also includes some invertebrate sequences (shown as crosses). Subclades, including the known members of the CKLF super family, are highlighted. The clustering and connections shown are at the P-value threshold of 1 × 10⁻¹⁵, as this is the threshold at which the two major clusters connect. Other P-values tested are shown in Fig S2. (C) Maximum-Likelihood un-rooted phylogenetic tree of canonical chemokines. CC type and CXC type are split into two separate clades. Supports for key nodes are indicated in boxes with Transfer Bootstrap Expectation represented by triangles and the Ultrafast Bootstraps as circles. A traffic light colour code is used to indicate the level of support: high (green); intermediate (yellow), and low (red). (D) Maximum-Likelihood un-rooted phylogenetic tree of the CKLF super family (CKLFSF). The CKLF group I is monophyletic, whereas the CKLF group II is not. Supports for key nodes are indicated in boxes with Transfer Bootstrap Expectation represented by triangles and the Ultrafast Bootstraps as circles. A traffic light colour code is used to indicate the level of support: high (green), intermediate (yellow), and low (red).
Figure S1.
Figure S1.. Cluster Analysis of Sequences clustering of chemokines and related molecules sequences.
Initial identification and annotation of clusters was performed at the strict P-value of 1 × 10⁻³⁵. (A, B) Subsequent loosening of the P-value clarified the relationships across clusters and defined bigger groups. At P-value 1 × 10⁻¹⁵ (B), two major canonical chemokine groups are well defined: the CCL group, which includes also XCL and X3CL; and the CXCL group. At this level of stringency, only few canonical chemokines remain isolated: CCL27/28, CXCL12, CXCL14, CXCL16, and CXCL17. TAFA and CYTL are also isolated. (C) At P-value 1 × 10⁻¹⁰ (C) the two major chemokine groups connect to each other. CCL27/28 is connected to the CCL group and CXCL12 and CXCL14 are connected to the CXCL group, whereas CXCL16 and CXCL17 are still isolated. (D) At P-value 1 × 10⁻⁶ (D), all chemokine groups are connected in one big cluster, except for CXCL17. TAFA and CYTL are also still isolated. Crosses indicate the few invertebrate sequences that were collected from the BLAST search, more information in the Supplementary results section.
Figure S2.
Figure S2.. Cluster Analysis of Sequences clustering of chemokine-like factor (CKLF) Super Family sequences.
Initial identification and annotation of clusters was performed at the strict P-value of 1 × 10−60. (A, B) Subsequent loosening of the P-value clarified the relationships across clusters and defined bigger groups. At 1 × 10⁻²⁰ (B), two major clusters have formed. One, that we called chemokine-like factor (CKLF) group I, includes CKLF, CMTM1, 2, 3, 5, and PLP2. The other, that we called CKLF group II, includes CMTM4/6, 7, 8, and other groups. (C) At 1 × 10⁻¹⁶ (C), more sequences have joined the two major groups that are still separate. (D) At 1 × 10⁻¹⁵ (D), the two major groups connect and few extra sequences; see the Supplementary results section for extra details. Crosses indicate invertebrate sequences.
Figure S3.
Figure S3.. Unrooted phylogenetic tree of canonical chemokines with transfer bootstrap expectation supports.
Phylogenetic tree under the model GTR20+F+R4. Nodal support is calculated from 100 nonparametric bootstrap repeats with transfer bootstrap expectation. CCL clade is in orange, CXCL clade in blue.
Figure S4.
Figure S4.. Unrooted phylogenetic tree of canonical chemokines with UFB supports.
Phylogenetic tree under the model GTR20+F+R4. Nodal support is calculated from 1,000 ultrafast bootstrap repeats. CCL clade is in orange, CXCL clade in blue.
Figure S5.
Figure S5.. Unrooted phylogenetic tree of TAFA with transfer bootstrap expectation supports.
Phylogenetic tree under the model JTT+R5. Nodal support is calculated from 100 nonparametric bootstrap repeats with transfer bootstrap expectation.
Figure S6.
Figure S6.. Unrooted phylogenetic tree of TAFA with UFB supports.
Phylogenetic tree under the model JTT+R5. Nodal support is calculated from 1,000 ultrafast bootstrap repeats.
Figure S7.
Figure S7.. Unrooted phylogenetic tree of CYTL with transfer bootstrap expectation supports.
Phylogenetic tree under the model JTT+I+G4. Nodal support is calculated from 100 nonparametric bootstrap repeats with transfer bootstrap expectation.
Figure S8.
Figure S8.. Unrooted phylogenetic tree of CYTL with UFB supports.
Phylogenetic tree under the model JTT+I+G4. Nodal support is calculated from 1,000 ultrafast bootstrap repeats.
Figure S9.
Figure S9.. Unrooted phylogenetic tree of CXCL17 with transfer bootstrap expectation supports.
Phylogenetic tree under the model JTT. Nodal support is calculated from 100 nonparametric bootstrap repeats with transfer bootstrap expectation.
Figure S10.
Figure S10.. Unrooted phylogenetic tree of CXCL17 with UFB supports.
Phylogenetic tree under the model JTT. Nodal support is calculated from 1,000 ultrafast bootstrap repeats.
Figure S11.
Figure S11.. Unrooted phylogenetic tree of CKLFSF with transfer bootstrap expectation supports.
Phylogenetic tree under the model GTR20+F+R7. Nodal support is calculated from 100 nonparametric bootstrap repeats with transfer bootstrap expectation. Red clade = CMTM4/6; blue clade = CKLF I group; green clade = CMTM7; turquois clade = MAL/MALL/MAL2.
Figure S12.
Figure S12.. Unrooted phylogenetic tree of CKLFSF with UFB supports.
Phylogenetic tree under the model GTR20+F+R7. Nodal support is calculated from 1,000 ultrafast bootstrap repeats. Red clade = CMTM4/6; blue clade = CKLF I group; green clade = CMTM7; turquois clade = MAL/MALL/MAL2.
Figure S13.
Figure S13.. Alignment of candidate brachiopod CCL24 sequence with mammalian CCL24s.
Our BLAST searches picked up a sequence from the brachiopod Lingula unguis that when re-blasted versus SwissProt returned a CCL24 as hit. Alignment of the brachiopod sequence with mammalian CCL24 sequences reveals a poor overall conservation, with the brachiopod sequence also being significantly longer than any of the other sequences. Further details about this sequence can be found in Supplementary File 3 and in the Supplementary results section.
Figure S14.
Figure S14.. Alignment of candidate cnidarian CCL3 sequence with mammalian CCL3s.
Our BLAST searches picked up a sequence from the cnidarian Clytia hemisphaerica that when re-blasted versus SwissProt returned a CCL3 as hit. Alignment of the cnidarian sequence with mammalian CCL3 sequences reveals a poor overall conservation, with the cnidarian sequence being extremely longer than any of the other sequences. Further details about this sequence can be found in Supplementary File 3 and in the Supplementary results section.
Figure S15.
Figure S15.. Alignment of candidate echinoderm CXCL10 sequence with mammalian CXCL10s.
Our BLAST searches picked up a sequence from the echinoderm Acanthaster planci that when re-blasted versus SwissProt returned a CXCL10 as hit. Alignment of the echinoderm sequence with mammalian CXCL10 sequences reveals a poor overall conservation, with the brachiopod sequence also being significantly longer than any of the other sequences. Further details about this sequence can be found in Supplementary File 3 and in the Supplementary results section.
Figure 2.
Figure 2.. Distribution and duplication patterns of ligand groups.
(A) Presence of all ligand groups are mapped onto a species tree. Gene trees and duplication events are based on the gene tree to species tree reconciliation analyses. The nomenclature for canonical chemokines is primarily based on known chemokines of human (or mouse). Where human and mouse chemokines do not correspond, the default name refers to the human gene and the mouse (Mus musculus) one is indicated with “Mm.” Chemokines that have been classically described as having either homeostatic or inflammatory function are indicated with a circle or a star, respectively. The classification used here was based on reference with the inflammatory type also including chemokines they described as plasma/platelet types. Overall, canonical chemokines originated in vertebrates and expanded a first time in jawed vertebrates and a second time in mammals. Homeostatic chemokines (e.g., CXCL12) are generally more ancient than inflammatory ones. CXCL17 and CYTL are mammal- and jawed vertebrate-specific, respectively. TAFA originated in the common ancestor of vertebrates and urochordates, whereas the chemokine-like factor super family is present in invertebrates although key duplications occurred at the base of vertebrates. (B) Number of complements for each ligand group at key species nodes is mapped onto the species tree. The number of complements in each group reflects the pattern of duplications. The major increase occurred at the level of jawed vertebrates with canonical chemokines undergoing a second significant increase within placentals. Silhouette images are by Andreas Hejnol (Xenopus laevis); Andy Wilson (Anas platyrhynchos, Taeniopygia guttata); Carlos Cano-Barbacil (Salmo trutta); Christoph Schomburg (Anolis carolinensis, Ciona intestinalis, Eptatretus burgeri, Petromyzon marinus); Christopher Kenaley (Mola mola); Chuanixn Yu (Latimeria chalumnae); Daniel Jaron (Mus musculus); Daniel Stadtmauer (Monodelphis domestica); Fernando Carezzano (Asteroidea); Ingo Braasch (Callorhinchus milii); Jake Warner (Danio rerio); Kamil S. Jaron (Poecilia formosa); Mali’o Kodis, photograph by Hans Hillewaert (Branchiostoma lanceolatum, https://www.phylopic.org/images/719d7b41-cedc-4c97-9ffe-dd8809f85553/branchiostoma-lanceolatum); Margot Michaud (Canis lupus, Physeter macrocephalus); NASA (Homo sapiens sapiens); Nathan Hermann (Scophthalmus aquosus); Ryan Cupo (Rattus norvegicus); seung9park (Takifugu rubripes rubripes); Soledad Miranda-Rottmann (Pelodiscus sinensis, https://www.phylopic.org/images/929fd134-bbd7-4744-987f-1975107029f5/pelodiscus-sinensis); Steven Traver (Gallus gallus domesticus, Ornithorhynchus anatinus); Stuart Humphries (Thunnus thynnus); T. Michael Keesey (after Colin M. L. Burnett) (Gorilla gorilla gorilla); Thomas Hegna (based on picture by Nicolas Gompel) (Drosophila (Drosophila) mojavensis); and Yan Wong (Balanoglossus).
Figure S16.
Figure S16.. Rooted species tree reconciled gene tree for canonical chemokines.
The canonical chemokines gene tree was reconciled with the species tree using GeneRax. “S” or “D” at the node indicates a speciation or duplication event, respectively. CCL clade is in orange, and CXCL clade is in blue.
Figure S17.
Figure S17.. Alignment of four candidate urochordate TAFA sequences with vertebrate TAFAs.
Our BLAST searches picked up four sequences from the urochordate Ciona intestinalis that connected with the TAFA cluster in the Cluster Analysis of Sequences analysis. One of these sequences when blasted versus SwissProt returned a TAFA as hit. This sequence was also annotated as TAFA by InterProScan. Alignment of the urochordate sequences with vertebrate TAFA sequences reveals that only the one annotated as TAFA aligns well, whereas the other three align poorly and are also significantly longer than any of the other sequences. Further details about these sequences can be found in Supplementary File 3 and in the Supplementary results section.
Figure S18.
Figure S18.. Alignment of best candidate urochordate TAFA sequence with vertebrate TAFAs.
Of the four urochordate candidate TAFA sequences, only one was annotated as TAFA with both SwissProt and InterProScan annotation and appeared to align well with other TAFAs with a preliminary alignment with all urochordate sequences (Fig S6). Here, we removed the other three urochordate sequences and aligned only the best candidate with the vertebrate TAFAs. The sequence conservation is even more apparent with this alignment. Importantly, 8 of the 10 typical cysteine residues of TAFA1–4 are conserved, and the two missing cysteines are the same ones missing in TAFA5. Further discussion can be found in the Supplementary results section.
Figure S19.
Figure S19.. Rooted species tree reconciled gene tree for TAFA.
The TAFA gene tree was reconciled with the species tree using GeneRax. “S” or “D” at the node indicates a speciation or duplication event, respectively.
Figure S20.
Figure S20.. Rooted species tree reconciled gene tree for CYTL.
The CYTL gene tree was reconciled with the species tree using GeneRax. “S” or “D” at the node indicates a speciation or duplication event, respectively.
Figure S21.
Figure S21.. Rooted species tree reconciled gene tree for CXCL17.
The CXCL17 gene tree was reconciled with the species tree using GeneRax. “S” or “D” at the node indicates a speciation or duplication event, respectively.
Figure S22.
Figure S22.. Rooted species tree reconciled gene tree for CKLFSF.
The CKLFSF gene tree was reconciled with the species tree using GeneRax. “S” or “D” at the node indicates a speciation or duplication event, respectively. Red clade = CMTM4/6; blue clade = CKLF I group; green clade = CMTM7; turquois clade = MAL/MALL/MAL2.
Figure S23.
Figure S23.. Cluster Analysis of Sequences clustering of receptors and related molecules sequences.
A Cluster Analysis of Sequences clustering layout where shapes indicate sequences and lines are connections indicating similarity between sequences at or surpassing the P-value similarity threshold. Sequences are positioned in clusters based on similarity. Initial identification and annotation of clusters was performed using the inbuilt convex clustering at the P-value of 1 × 10−100. (A) Clustering was loosened till the canonical receptor annotated groups formed a cluster at 1 × 10−65. (B) Loosening of the P-value to 1 × 10−60 identified relationships between clusters of interest and identified the intermediate group as connecting to both canonical and chemokine-like plus groups. All sequences connected to groups of interest are vertebrate sequences. (C) Further loosening to P-value 1 × 10−50 connects the vertebrate sequences of interest to a large cluster of sequences which contains vertebrate and invertebrate sequences which are annotated as opioid and somatostatin receptors and other GPCRs. Crosses indicate invertebrate sequences and Y-shape indicates the reference viral sequences included. Shapes are colour-coded by the group of interest: purple = canonical chemokine receptors; yellow = chemokine-like plus; green = atypical receptor 3/GPR182; blue = intermediate group; pink = relaxin receptors.
Figure 3.
Figure 3.. Phylogeny of receptor groups.
An unrooted maximum likelihood phylogeny of chemokine receptors. The tree shown is the Transfer Bootstrap Expectation tree including just the chordate specific clade from the Ultrafast Bootstrap tree. Node supports from both Transfer Bootstrap Expectation (triangle) and UFB (circle) shown for equivalent key nodes in boxes with arrows to indicate node. A traffic light colour code is used to indicate the level of support: high (green); intermediate (yellow); and low (red). Key clades highlighted: yellow = chemokine like plus group (CMLplus); blue = intermediate group; green = atypical 3 and GPR182 (ACKR3/GPR182); purple = canonical chemokines (Canonical CKR); and pink = relaxin receptors (RL3R). Branches scaled by amino acid substitutions per site.
Figure S24.
Figure S24.. Unrooted phylogenetic tree of receptors with transfer bootstrap expectation supports.
Phylogenetic tree of receptor sequences of interest and putative outgroups under the model GTR20+F+G4. Sequences used are a subset of sequences extracted from Cluster Analysis of Sequences; specifically, they are those in the chordate specific clade in the ultrafast bootstrap tree. Nodal support is calculated from 100 nonparametric bootstrap repeats with transfer bootstrap expectation. Branches colour coded by group of interest: purple = canonical chemokine receptors; yellow = chemokine-like plus; green = atypical receptor 3/GPR182; blue = intermediate group; pink = relaxin receptors.
Figure S25.
Figure S25.. Unrooted phylogenetic tree of receptors with UFB supports.
Phylogenetic tree of all receptor sequences of interest and putative outgroups extracted from clans under the model GTR20+F+G4. Nodal support is calculated from 1,000 ultrafast bootstrap repeats. Branches colour coded by the group of interest: purple = canonical chemokine receptors; yellow = chemokine-like plus; green = atypical receptor 3/GPR182; blue = intermediate group; pink = relaxin receptors.
Figure 4.
Figure 4.. Distribution and duplication patterns of receptor groups.
(A) Presence of all receptor groups are mapped onto a species tree. Gene trees and duplication events are based on the gene tree to species tree reconciliation analyses. The nomenclature for genes is primarily based on human chemokines. The canonical chemokines had five paralogs present in the vertebrate common ancestor. These undergo a heterogeneous pattern of duplication throughout vertebrates with different paralogs duplicating different number of times and in different groups of species. Chemokines that have been classically described as having either homeostatic or inflammatory function are indicated with a circle or a star respectively. The classification used here was based on reference . (B) Number of complements for each receptor group at key species nodes is mapped onto the species tree. The number of complements in each group reflects the pattern of duplications. The chemokine groups diverged in the vertebrate stem group. The major expansion occurred at the level of jawed vertebrates with canonical chemokine receptors, the chemokine-like receptor plus group and intermediate groups increasing in copy number. Canonical chemokine underwent another small subsequent increase within placentals. Silhouette images are by Andreas Hejnol (Xenopus laevis); Andy Wilson (Anas platyrhynchos, Taeniopygia guttata); Carlos Cano-Barbacil (Salmo trutta); Christoph Schomburg (Anolis carolinensis, Ciona intestinalis, Eptatretus burgeri, Petromyzon marinus); Christopher Kenaley (Mola mola); Chuanixn Yu (Latimeria chalumnae); Daniel Jaron (Mus musculus); Daniel Stadtmauer (Monodelphis domestica); Fernando Carezzano (Asteroidea); Ingo Braasch (Callorhinchus milii); Jake Warner (Danio rerio); Kamil S. Jaron (Poecilia formosa); Mali’o Kodis, photograph by Hans Hillewaert (Branchiostoma lanceolatum, https://www.phylopic.org/images/719d7b41-cedc-4c97-9ffe-dd8809f85553/branchiostoma-lanceolatum); Margot Michaud (Canis lupus, Physeter macrocephalus); NASA (Homo sapiens sapiens); Nathan Hermann (Scophthalmus aquosus); Ryan Cupo (Rattus norvegicus); seung9park (Takifugu rubripes rubripes); Soledad Miranda-Rottmann (Pelodiscus sinensis, https://www.phylopic.org/images/929fd134-bbd7-4744-987f-1975107029f5/pelodiscus-sinensis); Steven Traver (Gallus gallus domesticus, Ornithorhynchus anatinus); Stuart Humphries (Thunnus thynnus); T. Michael Keesey (after Colin M. L. Burnett) (Gorilla gorilla gorilla); Thomas Hegna (based on picture by Nicolas Gompel) (Drosophila (Drosophila) mojavensis); and Yan Wong (Balanoglossus).
Figure S26.
Figure S26.. Rooted species tree reconciled gene tree for receptors.
The ultrafast bootstrap receptor tree was modified to extract the subtree of the chordate specific clade. This gene tree was reconciled with the species tree using GeneRax. “S” or “D” at the node indicates a speciation or duplication event, respectively. Branches colour coded by group of interest: purple = canonical chemokine receptors; yellow = chemokine-like plus; green = atypical receptor 3/GPR182; blue = intermediate group; pink = relaxin receptors.
Figure 5.
Figure 5.. Summary of the evolution of ligands and receptors.
A summary diagram of the evolution of the different chemokine system components. A simplified phylogenetic tree of species is shown, calibrated to time according to reference for Deuterostomia and Bilateria nodes and reference for all other nodes. Circles represent ligand groups, and seven transmembrane domain structure icons represent GPCR groups. Icons are colour-coded by group, and placed adjacent to the branch in the species tree where they first appear. X2 and X5 indicate the number of paralogs present for CXCL ligand group and the canonical CKR groups, respectively, on the branch where they first appear. Question mark refers to the uncertainty regarding the origin of the chemokine-like factor group I in jawed vertebrates or deuterostome stem group (see Fig 2). Geological column is shown along the bottom, in accordance with the ICS International Chronostratigraphic Chart (75).

Similar articles

Cited by

References

    1. Zhang K, Shi S, Han W (2018) Research progress in cytokines with chemokine-like function. Cell Mol Immunol 15: 660–662. 10.1038/cmi.2017.121 - DOI - PMC - PubMed
    1. Chen K, Bao Z, Tang P, Gong W, Yoshimura T, Wang JM (2018) Chemokines in homeostasis and diseases. Cell Mol Immunol 15: 324–334. 10.1038/cmi.2017.134 - DOI - PMC - PubMed
    1. Blanchet X, Langer M, Weber C, Koenen R, von Hundelshausen P (2012) Touch of chemokines. Front Immunol 3: 175. 10.3389/fimmu.2012.00175 - DOI - PMC - PubMed
    1. López-Cotarelo P, Gómez-Moreira C, Criado-García O, Sánchez L, Rodríguez-Fernández JL (2017) Beyond chemoattraction: Multifunctionality of chemokine receptors in leukocytes. Trends Immunol 38: 927–941. 10.1016/j.it.2017.08.004 - DOI - PubMed
    1. Tran PB, Miller RJ (2003) Chemokine receptors: Signposts to brain development and disease. Nat Rev Neurosci 4: 444–455. 10.1038/nrn1116 - DOI - PubMed

Publication types

LinkOut - more resources