. 2024 Jan 16;15(1):544.
doi: 10.1038/s41467-023-44622-z.

Towards estimating the number of strains that make up a natural bacterial population

Affiliations

Towards estimating the number of strains that make up a natural bacterial population

Tomeu Viver et al. Nat Commun. .

Abstract

What a strain is and how many strains make up a natural bacterial population remain elusive concepts despite their apparent importance for assessing the role of intra-population diversity in disease emergence or response to environmental perturbations. To advance these concepts, we sequenced 138 randomly selected Salinibacter ruber isolates from two solar salterns and assessed these genomes against companion short-read metagenomes from the same samples. The distribution of genome-aggregate average nucleotide identity (ANI) values among these isolates revealed a bimodal distribution, with four-fold lower occurrence of values between 99.2% and 99.8% relative to ANI >99.8% or <99.2%, revealing a natural "gap" in the sequence space within species. Accordingly, we used this ANI gap to define genomovars and a higher ANI value of >99.99% and shared gene-content >99.0% to define strains. Using these thresholds and extrapolating from how many metagenomic reads each genomovar uniquely recruited, we estimated that -although our 138 isolates represented about 80% of the Sal. ruber population- the total population in one saltern pond is composed of 5,500 to 11,000 genomovars, the great majority of which appear to be rare in-situ. These data also revealed that the most frequently recovered isolate in lab media was often not the most abundant genomovar in-situ, suggesting that cultivation biases are significant, even in cases that cultivation procedures are thought to be robust. The methodology and ANI thresholds outlined here should represent a useful guide for future microdiversity surveys of additional microbial species.


Conflict of interest statement

The authors declare no competing interests.

Figures
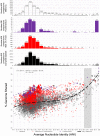
Fig. 1
Fig. 1. Genomic diversity of Salinibacter ruber genomes used in the study in terms of ANI relatedness and shared genome fraction.
Each datapoint represents a comparison between two genomes and shows their ANI value (x-axis) against the shared genome fraction (y-axis). The graph on the top shows the number of datapoints for x-axis (in 0.1% windows or bins). Data points represent the 138×138 comparisons of our Sal. ruber isolate draft genome collection from Mallorca (118 genomes) and Fuerteventura (20 genomes) saline ponds combined (see also Fig. key for distinguishing datapoints by the place of isolation of the genomes compared). Note that the diversity of Fuerteventura genomes (in terms of ANI and shared gene content) is similar to that of many Mallorca genomes, albeit the latter collection also includes several more divergent genomes, in addition. Note also the shortage of data points (i.e., a gap) in ANI values around 99.6-99.8% (gray shaded area). Source data are provided as Source Data 1.
Fig. 2
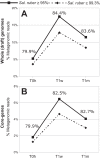
Fig. 2. Salinibacter ruber abundance dynamics in the control pond during the sampling period of one month.
Metagenomic reads were aligned against Sal. ruber genomes using (A) whole (draft) genomes and (B) core genes only (see text for details). Continuous lines show the abundance of the natural Sal. ruber population (represented by reads mapping with identity ≥95% to any genome) and discontinuous lines show the percentage of reads represented by the sequenced isolates (reads mapping with identity ≥99.3% to any genome). Numbers for each time point indicate the proportion of total population reads that were associated to sequenced strains.
Fig. 3
Fig. 3. Estimation of the number of genomovars making up the natural Salinibacter ruber population.
Metagenomic reads from each sample (Panels BD) or all samples combined (Panel A) of the control pond were mapped to the Sal. ruber genomes preserving all matches with identity ≥99.3%. The mapping file was manipulated to remove one target genome at a time (randomly sorted) while recording the number of unique reads mapping at each step, and this process was repeated 100 times to reduce the impact of randomization on the estimates obtained (below). The number of reads were then expressed as the fraction of the maximum number of reads from the Sal. ruber species by dividing the observed counts by the total number of reads mapping to any reference genome with identity ≥ 95%. The logarithm of the number of total (dereplicated) genomes used was then expressed as a function of the fraction of Sal. ruber reads captured by the genomes, and a linear regression was determined by unweighted least squares and evaluated using Pearson correlation for the region between 20 and 100 genomes. This trendline was extrapolated to 100% coverage of the genomovar diversity (i.e., all reads from the species) to provide an estimate of the number of genomovars represented (Y-axis) in the total sequenced fraction (X-axis). Filled dots represent the fraction of the total Sal. ruber reads captured by the genomovars used, and the shaded bands around the observed subsamples represent the central inter-quantile ranges at 100%, 80%, 60, 40%, and 20%. Source data are provided as Source Data 2.
Fig. 4
Fig. 4. Proposed thresholds to define species and intra-species units.
Note that thresholds are based on average amino-acid identity (AAI) for genus level and average nucleotide identity (ANI) for species,, and intra-species level.
Fig. 5
Fig. 5. Sal. ruber genomovar abundance dynamics over the one-month period of experimental manipulation of sunlight intensity and salinity.
Each line represents a (distinct) genomovar and shows its relative abundance as a fraction of the total Sal. ruber population, based on the number of metagenomic reads uniquely recruited by the representative genome of the genomovar (y-axes), against the three metagenomic sampling time points (x-axes) for each of the three separate experimental ponds used (panel title on top). Lines are colored in black or red if the corresponding genomovar increased or decreased in abundance in the control pond (Panel A), respectively, except for four genomovars (denoted on the panels) that showed significant difference in abundance in the dilution (Panel C) relative to the control pond (same color is used for the same genomovar across panels). Note that, for the dilution pond, the salt concentration was reduced from 33.6 to 12.0% by the addition of freshwater at time zero (0 h); the unshaded pond (Panel B) was kept uncovered -like a control pond- until 0 h and, after the first sample was collected, was covered with a shade mesh that reduced sunlight intensity by 37-fold for one month, as described in detail previously. Source data are provided as Source Data 3.

References

    1. Konstantinidis KT, Tiedje JM. Genomic insights that advance the species definition for prokaryotes. Proc. Natl Acad. Sci. USA. 2005;102:2567–2572. doi: 10.1073/pnas.0409727102. - DOI - PMC - PubMed
    1. Richter M, Rosselló-Móra R. Shifting the genomic gold standard for the prokaryotic species definition. Proc. Natl Acad. Sci. USA. 2009;106:19126–19131. doi: 10.1073/pnas.0906412106. - DOI - PMC - PubMed
    1. Caro‐Quintero A, Konstantinidis KT. Bacterial species may exist, metagenomics reveal. Environ. Microbiol. 2012;14:347–355. doi: 10.1111/j.1462-2920.2011.02668.x. - DOI - PubMed
    1. Rodriguez RL, Jain C, Conrad RE, Aluru S, Konstantinidis KT. Reply to: “Re-evaluating the evidence for a universal genetic boundary among microbial species”. Nat. Commun. 2021;12:4060. doi: 10.1038/s41467-021-24129-1. - DOI - PMC - PubMed
    1. Parker CT, Tindall BJ, Garrity GM. International code of nomenclature of prokaryotes: prokaryotic code (2008 revision) Int. J. Syst. Evol. Microbiol. 2019;69:S1–S111. doi: 10.1099/ijsem.0.000778. - DOI - PubMed