. 2024 Jan 16;15(1):482.
doi: 10.1038/s41467-024-44698-1.

Selective CK1α degraders exert antiproliferative activity against a broad range of human cancer cell lines

Affiliations

Selective CK1α degraders exert antiproliferative activity against a broad range of human cancer cell lines

Gisele Nishiguchi et al. Nat Commun. .

Abstract

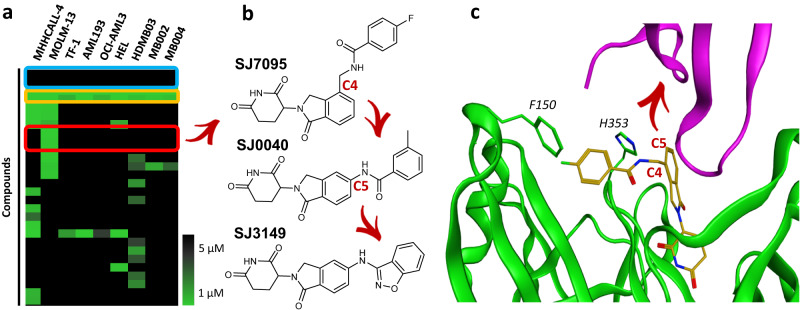
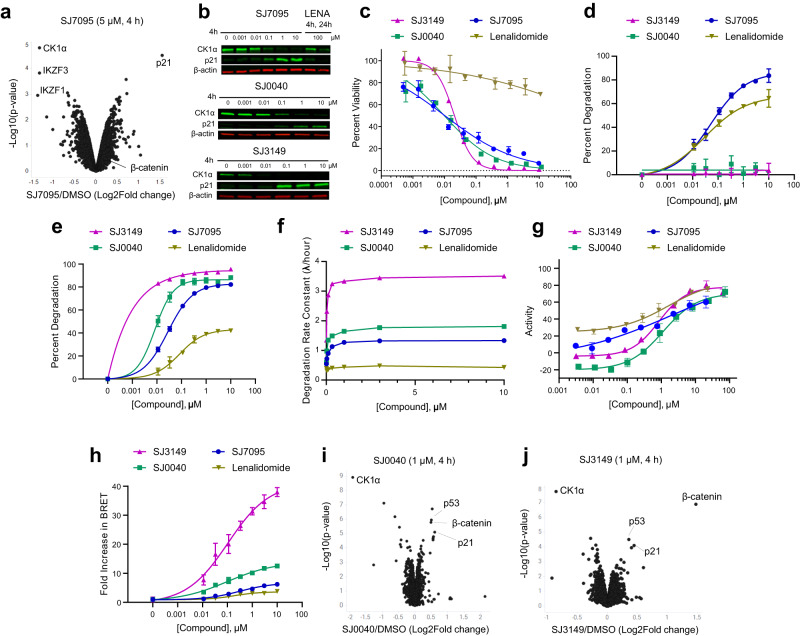
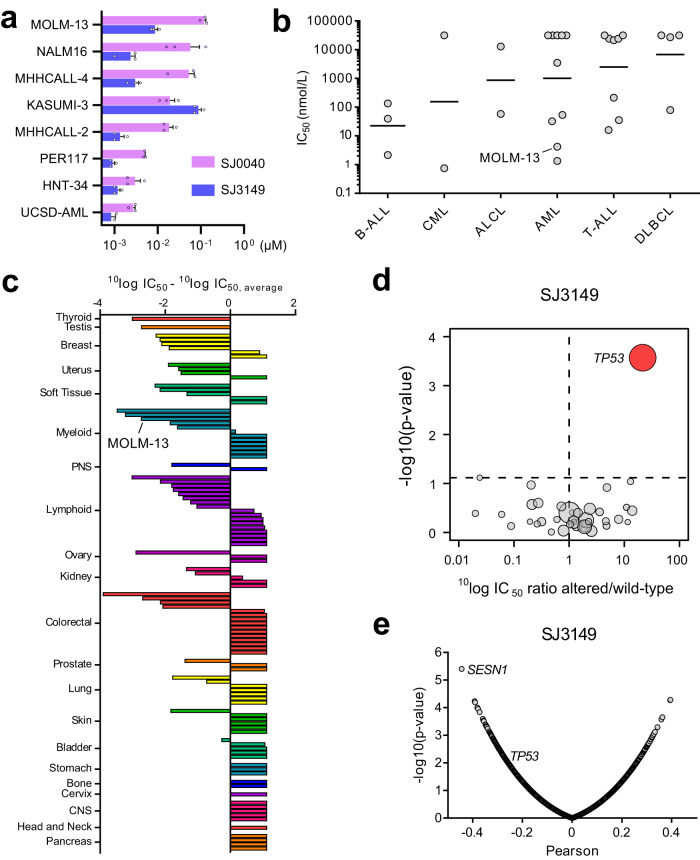
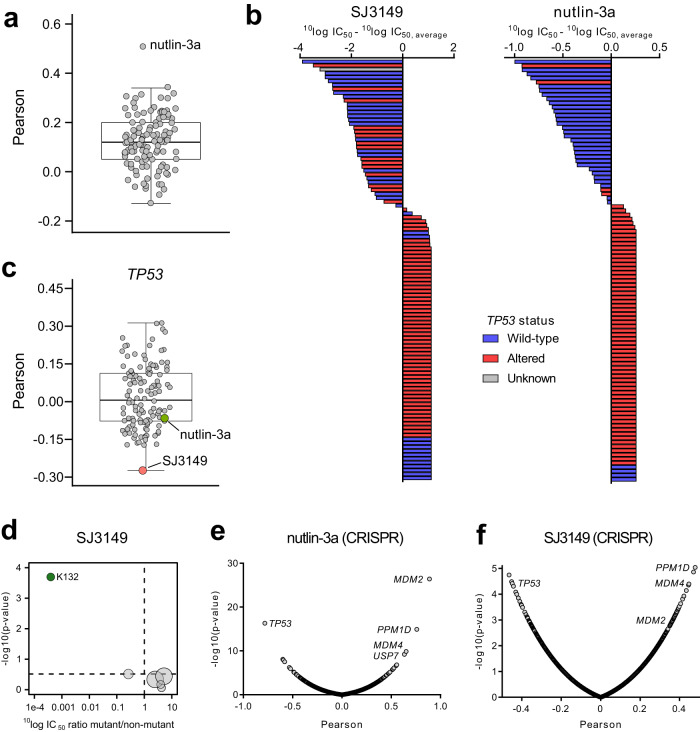
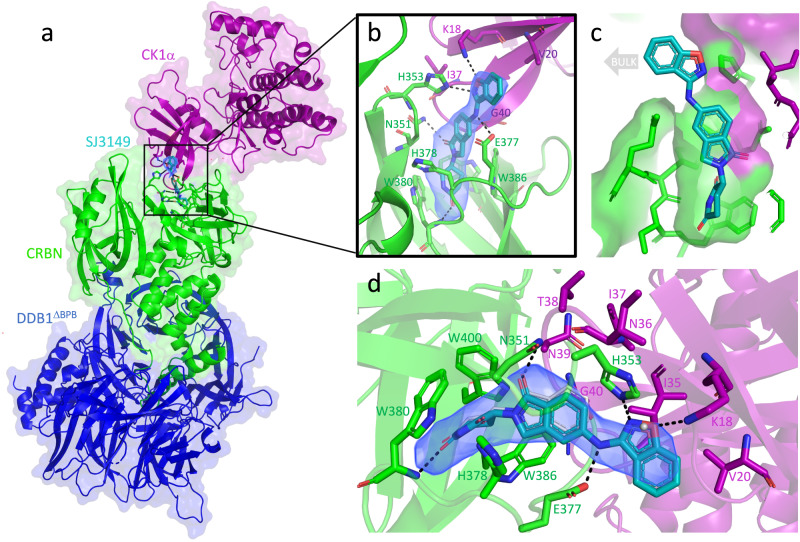
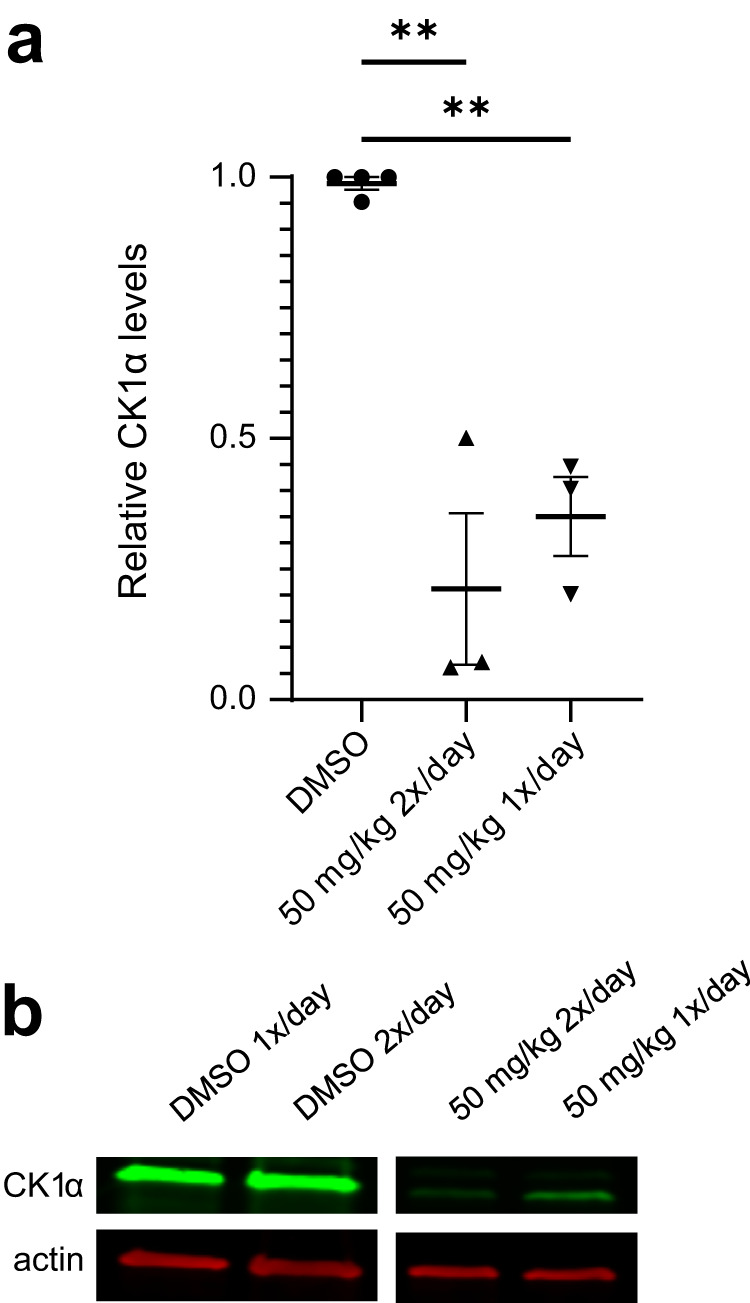
Molecular-glue degraders are small molecules that induce a specific interaction between an E3 ligase and a target protein, resulting in the target proteolysis. The discovery of molecular glue degraders currently relies mostly on screening approaches. Here, we describe screening of a library of cereblon (CRBN) ligands against a panel of patient-derived cancer cell lines, leading to the discovery of SJ7095, a potent degrader of CK1α, IKZF1 and IKZF3 proteins. Through a structure-informed exploration of structure activity relationship (SAR) around this small molecule we develop SJ3149, a selective and potent degrader of CK1α protein in vitro and in vivo. The structure of SJ3149 co-crystalized in complex with CK1α + CRBN + DDB1 provides a rationale for the improved degradation properties of this compound. In a panel of 115 cancer cell lines SJ3149 displays a broad antiproliferative activity profile, which shows statistically significant correlation with MDM2 inhibitor Nutlin-3a. These findings suggest potential utility of selective CK1α degraders for treatment of hematological cancers and solid tumors.


Conflict of interest statement

The authors declare the following competing interests: St. Jude Children’s Research Hospital has applied for an international patent covering structures reported in this work (WO2023081224A1; and provisional application number: 63389477), G.N., K.M., J.M.K., and Z.R. The remaining authors declare no competing interests.

Figures

Fig. 1
Fig. 1. Hit identification and optimization strategy.
a Heatmap of selected screening hits across a panel of acute leukemia (AL) and medulloblastoma (MB) cell lines (cell viability IC50 values determined by CTG assays). The blue box highlights lenalidomide and pomalidomide, the yellow box highlights known GSPT degraders CC-885 and SJ6986, red box highlights MOLM-13 hits. b Optimization trajectory and chemical structures of the hit and leads. c SJ7095 (shown as amber sticks) modeled into the lenalidomide + CRBN (green) + CK1α (purple) complex (PDB: 5FQD). The red arrow points to the C5-substitution vector that underlines the optimization strategy.
Fig. 2
Fig. 2. Degradation profiles of hit and leads.
a TMT-Proteomics in MOLM-13 cells following 4 h treatment with SJ7095 at 5 µM concentration. b CK1α and p21 protein levels in MOLM-13 cells determined by immunoblotting following treatment with increasing concentrations of test compounds over 4 h, and lenalidomide at 100 μM over 4 and 24 h. The CK1α DC50 values were calculated using quantified band intensities from the immunoblotting analysis. Data represents the average from three independent experiments. c Viability of MOLM-13 cells measured in the CTG assay after 72 h incubation with rising concentrations of the tested compound. d IKZF1 degradation maximum (Dmax) as determined by IKZF1 HiBiT assay. e CK1α degradation maximum (Dmax) as determined by CK1α HiBiT assay. f CK1α degradation rate as determined by CK1α HiBiT assay. g CRBN-binding affinity determined in the fluorescence polarization (FP) displacement assay. h Ternary complex formation measured in CK1α-CRBN NanoBRET assay. TMT-Proteomics in MOLM-13 cells following 4 h treatment with 1 µM concentration of: i SJ0040 and j SJ3149. Data represents the average of at least three independent determinations. Error bars represent the standard error of the mean. Statistical analysis for a, i, j: two-tailed and unpaired t-test. Data in Fig. 2 are summarized in Supplementary Table 1.
Fig. 3
Fig. 3. Analysis of SJ3149 activity in a broad range of human cancer cell lines.
a IC50 values of SJ0040 and SJ3149 in a panel of AL cell lines. The data are plotted as the mean ± SEM from three independent experiments. b Scatterplot of the IC50 distribution of SJ3149 in 29 hematologic cell lines. Cell lines were grouped based on their disease subtype. Dots show the mean IC50 value (in nM) as derived from duplicate 9-point dilution series for each cell line. Horizontal solid lines indicate the geometric means, as derived from the independent samples of each group (B-ALL n = 3, CML n = 2, ALCL, n = 2, AML n = 10, T-ALL n = 8, DLBCL n = 4). c SJ3149 IC50 values for the 115 cancer cell lines relative to the panel average IC50. A negative value indicates a below-average IC50 value. Bars are based on the mean IC50 value as derived from duplicate 9-point dilution series for each cell line. Cell lines were grouped and colored based on their tissue of origin. d Volcano plot comparing compound SJ3149 IC50 differences between altered and wild-type cell lines for 38 established cancer genes. The red node indicates significantly higher IC50 in the TP53-altered cell lines. e Volcano plot of Pearson correlations between SJ3149 IC50 values and basal expression levels of 19,146 genes in 99 cell lines. Plots in d and e were generated using 10log IC50 values (in nM) derived from duplicate 9-point dilution series for each cell line. For results in d, the significance of IC50 shifts was determined by two-sided Type II ANOVA as implemented by the ‘Anova()’ function from the ‘car’ package in R. Benjamini–Hochberg multiple testing correction was performed using the ‘p.adjust()’ function from the ‘stats’ package in R. Adjusted p-values < 0.2 were considered significant. For results in e, correlations were determined using the cor.test() function from the ‘stats’ package in R, using the Pearson method, pairwise complete observations, and a two-sided alternative hypothesis.
Fig. 4
Fig. 4. Determinants of cell line response to SJ3149.
a Boxplot of Pearson correlations between SJ3149 IC50 values and IC50 values of 120 anti-cancer agents in 102 cell lines. b Waterfall plots of cellular response to SJ3149 (left) and Nutlin-3a (right). Cell lines were colored based on the genomic status of TP53. Bars are based on the mean IC50 value as derived from duplicate 9-point dilution series for the 115 (SJ3149) or 102 (Nutlin-3a) cell lines. c Boxplot of Pearson correlations between basal expression levels of TP53, and IC50 values of SJ3149 and the 120 anti-cancer agents. Correlations are based on 99 or 95 cell lines for SJ3149 and the 120 other agents, respectively. d Volcano plot comparing the compound SJ3149 IC50 differences between cell lines harboring TP53 missense mutations. The green node indicates significantly lower IC50 in cell lines harboring a missense mutation on residue K132. Volcano plot of the Pearson correlations between drug IC50 values and CRISPR dependency scores of 17,453 genes in 77 cell lines for e Nutlin-3a and f SJ3149. Correlations are based on 78-cell lines. Plots in a, cf were generated using 10log IC50 values (in nM) derived from duplicate 9-point dilution series for each cell line. For results in a, c, e, and f, correlations were determined using the cor.test() function from the ‘stats’ package in R, using the Pearson method, pairwise complete observations, and two-sided alternative hypothesis. For results in d, the significance of IC50 shifts was determined by two-sided Type II ANOVA as implemented by the Anova()’ function from the ‘car’ package in R. Benjamini–Hochberg multiple testing correction was performed using the ‘p.adjust() function from the ‘stats’ package in R. Adjusted p-values < 0.2 were considered significant. For the boxplots in a and c, bounds of boxes represent the first and third quartiles, the center indicates the median. Whiskers extend from the upper and lower bounds of the box to the largest or smallest value no further than 1.5 times the interquartile range. Outliers extending beyond these ranges are plotted individually.
Fig. 5
Fig. 5. Quaternary complex of CK1α + CRBN∆1-40 + DDB1∆BPB + SJ3149.
a Quaternary complex of CK1α (purple), CRBN (green), and DDB1 (blue) in the presence of molecular glue SJ3149 (shown as cyan sticks). b The magnified region of the binding interface of CK1α and CRBN that accommodates SJ3149 with hydrogen bonds is shown as dashed lines. c Surface representation of the SJ3149 binding pocket with the benzisoxazol exposed to bulk solvent and available for chemical modification. d The Fo–Fc electron density map (rendered at 2.5 sigma) of the ligand allows the unambiguous placement of SJ3149 in the binding site with the benzisoxazol moiety extending to directly H-bond with K18 of CK1α, and H353 and E377 of CRBN. Overlay of the lenalidomide quaternary complex (5FQD; lenalidomide shown as thin gray sticks) shows similar accommodation of the shared glutarimide moiety and the displacement of a water molecule (gray sphere) that was observed in the lenalidomide-bound complex upon SJ3149 binding.
Fig. 6
Fig. 6. Effect of SJ3149 on CK1α protein levels in vivo.
Data was obtained after indicated IP dosing regimens. a Relative CK1α expression calculated by quantified western blots of isolated human cells from the bone marrow of treated mice (n = 3 for treatment groups, n = 2 for vehicle groups; DMSO vehicle control samples were combined from both groups for graphing; bars represent mean and SEM. One-way ANOVA with multiple comparisons to DMSO: 50 mg/kg 2×/day p = 0.0023, 50 mg/kg 1×/day p = 0.0080). b Representative blot shows one sample from each treatment group (one lane was excluded from analysis and removed from the blot shown here).

References

    1. Ito T, et al. Identification of a primary target of thalidomide teratogenicity. Science. 2010;327:1345–1350. doi: 10.1126/science.1177319. - DOI - PubMed
    1. Krönke J, et al. Lenalidomide causes selective degradation of IKZF1 and IKZF3 in multiple myeloma cells. Science. 2014;343:301–305. doi: 10.1126/science.1244851. - DOI - PMC - PubMed
    1. Lu G, et al. The myeloma drug lenalidomide promotes the cereblon-dependent destruction of ikaros proteins. Science. 2014;343:305–309. doi: 10.1126/science.1244917. - DOI - PMC - PubMed
    1. Matyskiela ME, et al. SALL4 mediates teratogenicity as a thalidomide-dependent cereblon substrate. Nat. Chem. Biol. 2018;14:981–987. doi: 10.1038/s41589-018-0129-x. - DOI - PubMed
    1. Yamanaka S, et al. Thalidomide and its metabolite 5‐hydroxythalidomide induce teratogenicity via the cereblon neosubstrate PLZF. EMBO J. 2021;40:e105375. doi: 10.15252/embj.2020105375. - DOI - PMC - PubMed

Substances