

Ppe.RPT/SSC-1: from QTL mapping to a predictive KASP test for ripening time and soluble solids concentration in peach
- PMID: 38228692
- PMCID: PMC10791670
- DOI: 10.1038/s41598-024-51599-2
Ppe.RPT/SSC-1: from QTL mapping to a predictive KASP test for ripening time and soluble solids concentration in peach
Abstract
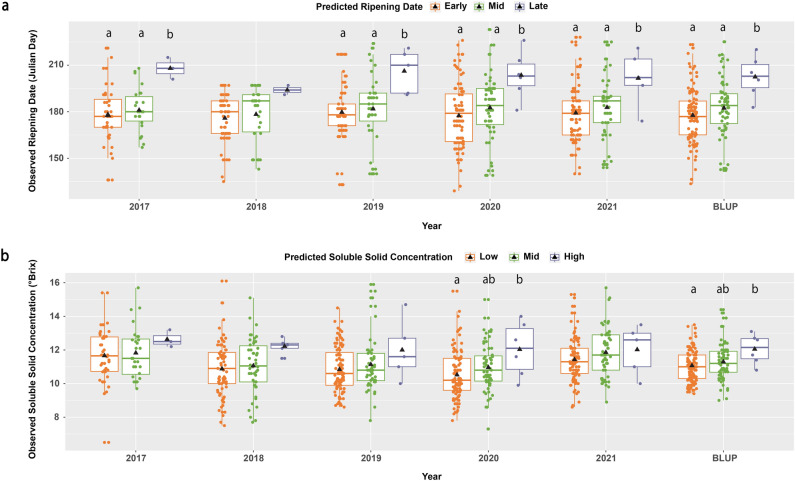
Genomic regions associated with ripening time (RPT) and soluble solids concentration (SSC) were mapped using a pedigreed population including multiple F1 and F2 families from the Clemson University peach breeding program (CUPBP). RPT and SSC QTLs were consistently identified in two seasons (2011 and 2012) and the average datasets (average of two seasons). A target region spanning 10,981,971-11,298,736 bp on chromosome 4 of peach reference genome used for haplotype analysis revealed four haplotypes with significant differences in trait values among different diplotype combinations. Favorable alleles at the target region for both RPT and SSC were determined and a DNA test for predicting RPT and SSC was developed. Two Kompetitive Allele Specific PCR (KASP) assays were validated on 84 peach cultivars and 163 seedlings from the CUPBP, with only one assay (Ppe.RPT/SSC-1) needed to predict between early and late-season ripening cultivars and low and high SSC. These results advance our understanding of the genetic basis of RPT and SSC and facilitate selection of new peach cultivars with the desired RPT and SSC.
© 2024. The Author(s).
Conflict of interest statement
The authors declare no competing interests.
Figures


Similar articles
-
Ppe.CR.1 DNA test for predicting chilling requirement in peach.Sci Rep. 2023 Jan 18;13(1):987. doi: 10.1038/s41598-023-27475-w. Sci Rep. 2023. PMID: 36653395 Free PMC article.
-
Identification and characterization of QTLs for fruit quality traits in peach through a multi-family approach.BMC Genomics. 2020 Jul 29;21(1):522. doi: 10.1186/s12864-020-06927-x. BMC Genomics. 2020. PMID: 32727362 Free PMC article.
-
Mapping and characterization QTLs for phenological traits in seven pedigree-connected peach families.BMC Genomics. 2021 Mar 16;22(1):187. doi: 10.1186/s12864-021-07483-8. BMC Genomics. 2021. PMID: 33726679 Free PMC article.
-
Ppe.XapF: High throughput KASP assays to identify fruit response to Xanthomonas arboricola pv. pruni (Xap) in peach.PLoS One. 2022 Feb 25;17(2):e0264543. doi: 10.1371/journal.pone.0264543. eCollection 2022. PLoS One. 2022. PMID: 35213640 Free PMC article.
-
Two loss-of-function alleles of the glutathione S-transferase (GST) gene cause anthocyanin deficiency in flower and fruit skin of peach (Prunus persica).Plant J. 2021 Sep;107(5):1320-1331. doi: 10.1111/tpj.15312. Epub 2021 Aug 13. Plant J. 2021. PMID: 33964100
Cited by
-
Genetic Variation Analysis and Development of KASP Marker for Leaf Area and Hight in Southern-Type Populus deltoides.Plants (Basel). 2025 Jan 23;14(3):330. doi: 10.3390/plants14030330. Plants (Basel). 2025. PMID: 39942892 Free PMC article.
-
A novel trait to reduce the mechanical damage of peach fruits at harvest: The first genetic dissection study for peduncle length.Mol Breed. 2025 Feb 24;45(3):29. doi: 10.1007/s11032-025-01547-3. eCollection 2025 Mar. Mol Breed. 2025. PMID: 40013267 Free PMC article.
-
A reproducible ddRAD-seq protocol reveals novel genomic association signatures for fruit-related traits in peach.Plant Methods. 2025 Jul 22;21(1):101. doi: 10.1186/s13007-025-01415-3. Plant Methods. 2025. PMID: 40696442 Free PMC article.
-
Genetic architecture of key traits for Prunus crop improvement: an overview of 25 years of curated genomic and breeding data.Hortic Res. 2025 May 30;12(8):uhaf142. doi: 10.1093/hr/uhaf142. eCollection 2025 Aug. Hortic Res. 2025. PMID: 40698195 Free PMC article.
-
Genetic dissection of stem and leaf rachis prickles in diploid rose using a pedigree-based QTL analysis.Front Plant Sci. 2024 Sep 18;15:1356750. doi: 10.3389/fpls.2024.1356750. eCollection 2024. Front Plant Sci. 2024. PMID: 39359628 Free PMC article.
References
-
- Bassi D, Mignani I, Spinardi A, Tura D. Chapter 23—PEACH (Prunus persica (L.) Batsch) In: Simmonds MSJ, Preedy VR, editors. Nutritional Composition of Fruit Cultivars. Academic Press; 2016. pp. 535–571.
-
- Food & Agriculture Organization of the United Nation. FAOSTAT Statistical Database (FAO, c1997-, 1997).
-
- Anthony BM, Minas IS. Optimizing peach tree canopy architecture for efficient light use, increased productivity and improved fruit quality. Agronomy. 2021;11:1961. doi: 10.3390/agronomy11101961. - DOI
-
- Iglesias I, Echeverría G. Differential effect of cultivar and harvest date on nectarine colour, quality and consumer acceptance. Sci. Hortic. 2009;120:41–50. doi: 10.1016/j.scienta.2008.09.011. - DOI
