. 2024 Feb;25(2):593-615.
doi: 10.1038/s44319-023-00031-3. Epub 2024 Jan 16.

Osteocalcin of maternal and embryonic origins synergize to establish homeostasis in offspring

Affiliations

Osteocalcin of maternal and embryonic origins synergize to establish homeostasis in offspring

Danilo Correa Pinto Junior et al. EMBO Rep. 2024 Feb.

Abstract

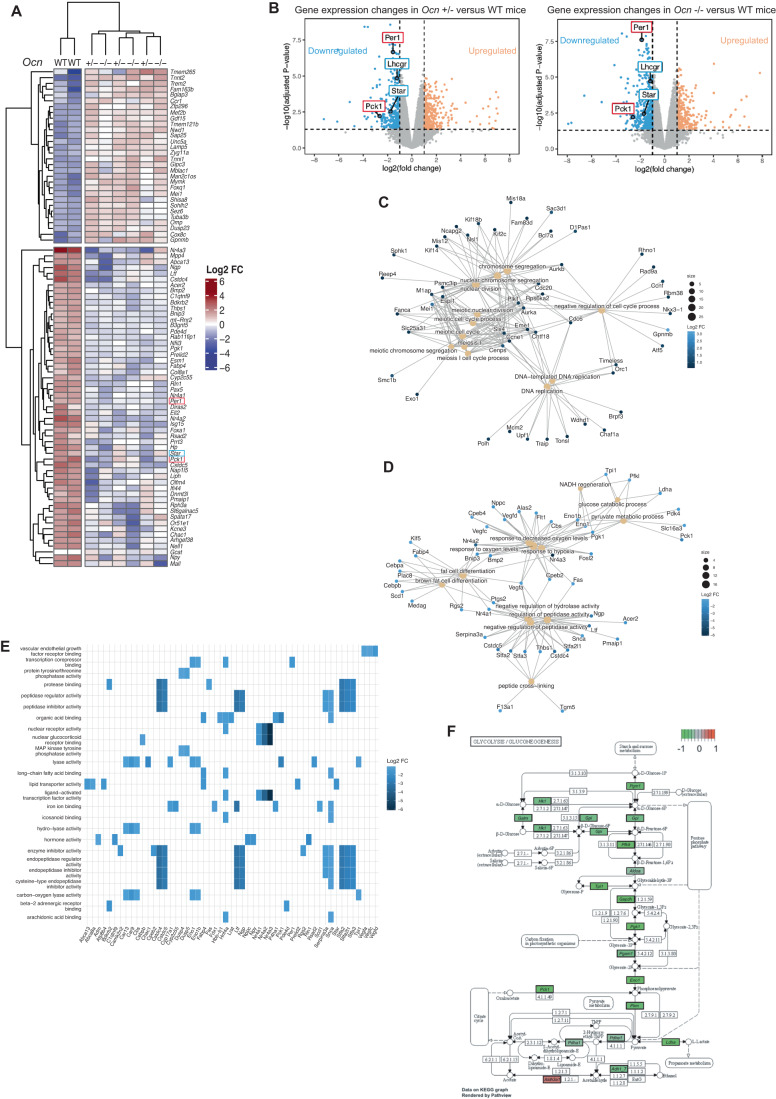
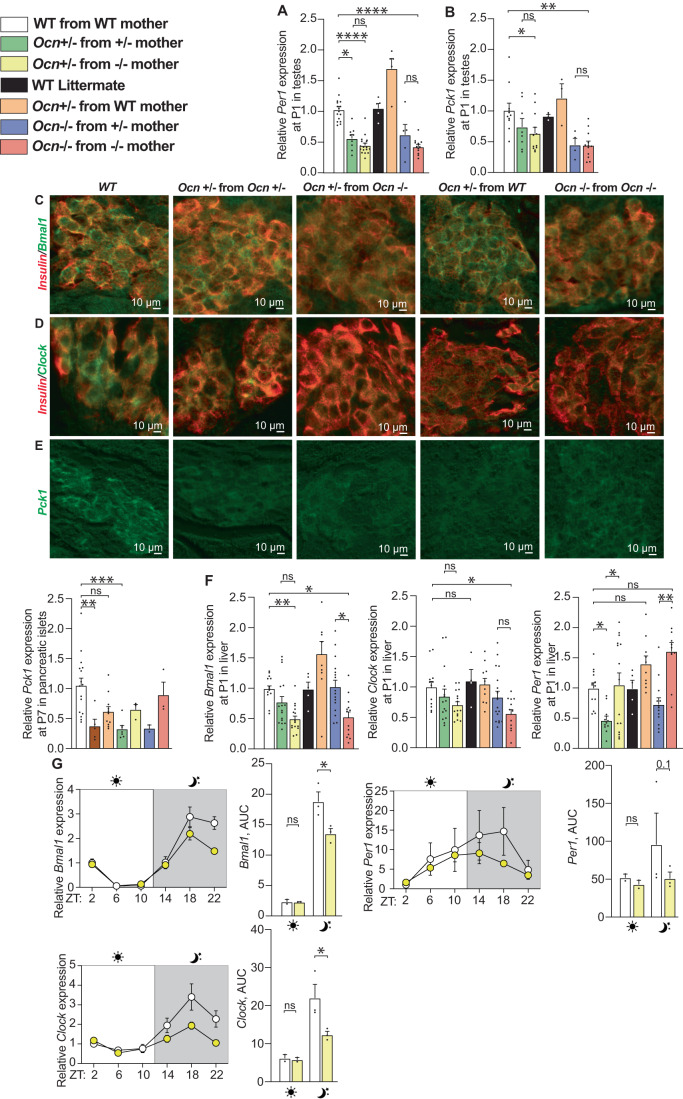
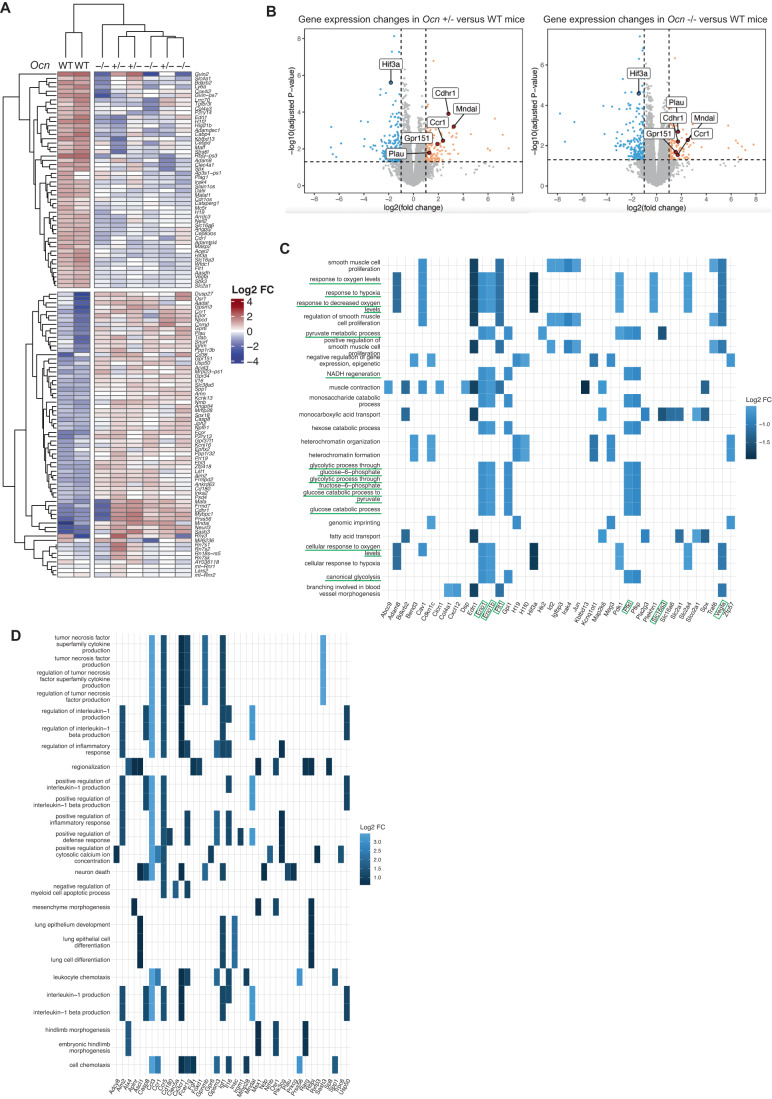
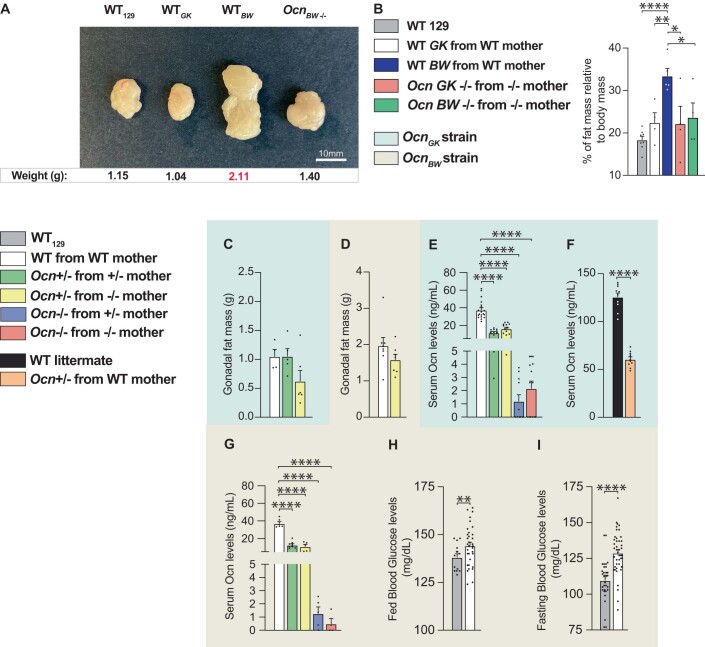
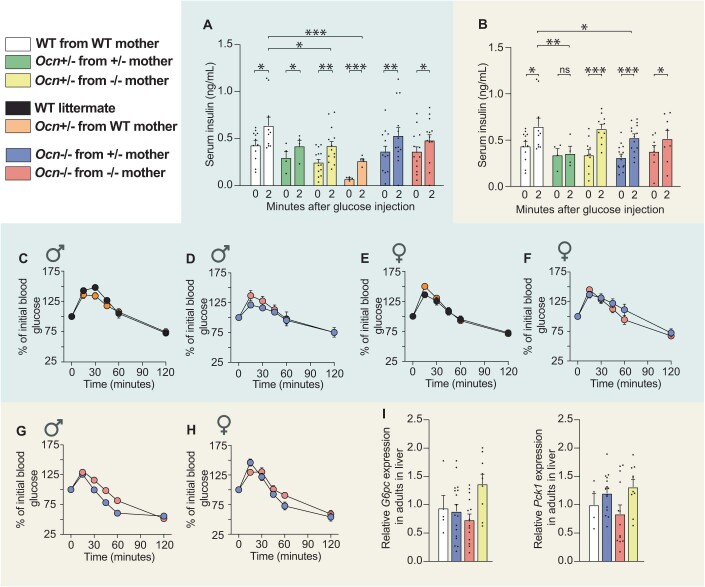
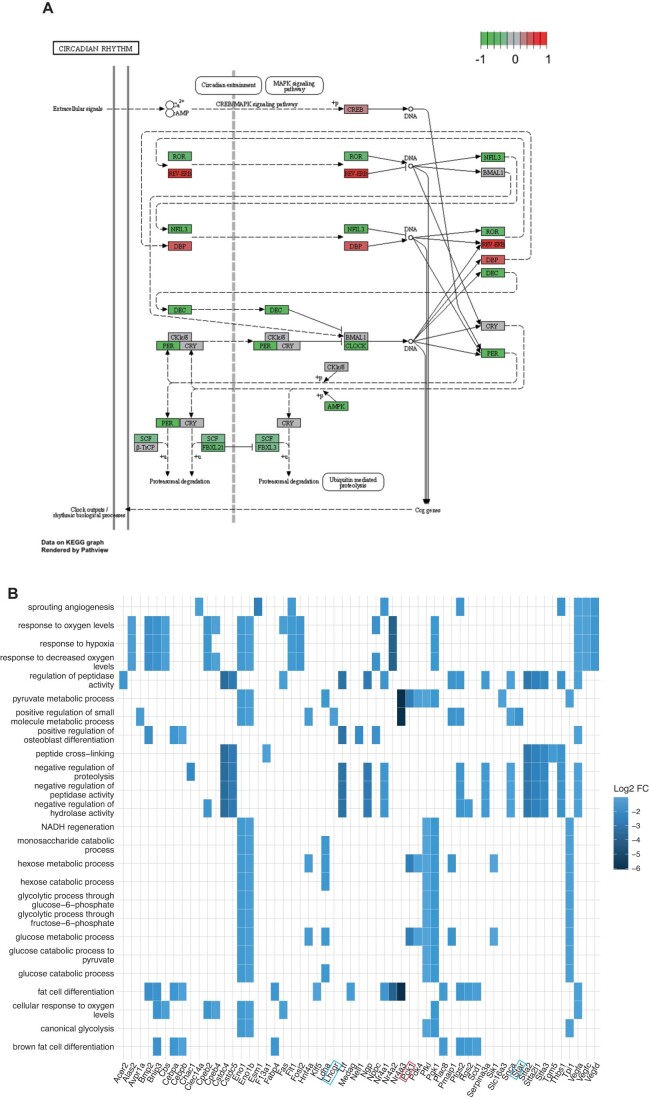
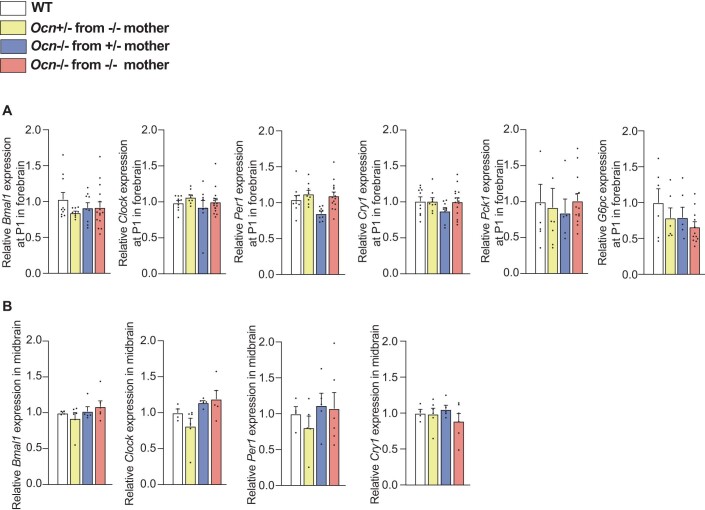
Many physiological osteocalcin-regulated functions are affected in adult offspring of mothers experiencing unhealthy pregnancy. Furthermore, osteocalcin signaling during gestation influences cognition and adrenal steroidogenesis in adult mice. Together these observations suggest that osteocalcin may broadly function during pregnancy to determine organismal homeostasis in adult mammals. To test this hypothesis, we analyzed in unchallenged wildtype and Osteocalcin-deficient, newborn and adult mice of various genotypes and origin maintained on different genetic backgrounds, the functions of osteocalcin in the pancreas, liver and testes and their molecular underpinnings. This analysis revealed that providing mothers are Osteocalcin-deficient, Osteocalcin haploinsufficiency in embryos hampers insulin secretion, liver gluconeogenesis, glucose homeostasis, testes steroidogenesis in adult offspring; inhibits cell proliferation in developing pancreatic islets and testes; and disrupts distinct programs of gene expression in these organs and in the brain. This study indicates that osteocalcin exerts dominant functions in most organs it influences. Furthermore, through their synergistic regulation of multiple physiological functions, osteocalcin of maternal and embryonic origins contributes to the establishment and maintenance of organismal homeostasis in newborn and adult offspring.

Keywords: Developmental Effect; Osteocalcin; Postnatal Physiology.


Conflict of interest statement

The authors declare no competing interests.

Figures

Figure 1
Figure 1. Strategy used to determine the role of gestational osteocalcin in regulating adult physiological functions.
(A) Schematic representation of the breeding strategy used for this study. Ocn+/+, Ocn+/− or Ocn−/− mothers were crossed with Ocn+/+, Ocn+/−, Ocn−/− or Ocn+/− fathers to generate progenies (Ocn+/+, Ocn+/−, or Ocn−/−) for analysis. (B) Ocn-deficient mouse strains (OcnGK, OcnBW and OcnXL) and corresponding genetic backgrounds. (C) Photomicrographs of Ocn-deficient mouse strains and corresponding genetic backgrounds illustrating an obese phenotype in WT mice of OcnBW strain. Body weight of corresponding genotypes is indicated below each photomicrograph. (D) Genome organization at the Ocn locus in WT mice of OcnBW strain. (E) Preference index [left panel] and discrimination index in a novel object recognition test [right panel] in female mice of various genotypes of the OcnBW strain. n = 4 or more mice per genotype analyzed. (F) Preference index [left panel] and discrimination index in a novel object recognition test [right panel] in female mice of various genotypes of the OcnXL strain. n = 3 or more mice per genotype analyzed. Data information: In bar plots, each dot represents an individual mouse. All data are shown as mean ± SEM. Statistical significance was determined by one-way Kruskal–Wallis test followed by post hoc multiple comparisons test. *p < 0.05, **p < 0.01, ****p < 0.0001. Source data are available online for this figure.
Figure 2
Figure 2. Osteocalcin of developmental origin regulates blood glucose levels in adult mice.
(A, C, E) fed and (B, D, F) fasting blood glucose levels in male and female mice from various genotypes of the OcnGK (A, B). n = 3 or more mice per genotype analyzed. OcnBW (C, D). n = 3 or more mice per genotype analyzed. OcnXL strains (E, F). n = 5 or more mice per genotype analyzed. Data information: In bar plots, each dot represents an individual mouse. All data are shown as mean ± SEM. Statistical significance was determined by one-way Kruskal–Wallis test followed by post hoc multiple comparisons test. *p < 0.05, **p < 0.01, ***p < 0.001. Source data are available online for this figure.
Figure 3
Figure 3. Osteocalcin of developmental origin influences insulin secretion, b-cell proliferation and liver gluconeogenesis in newborn and adult mice.
(A, B) Fasting serum insulin levels in mice of different genotypes of the OcnGK mouse strain (A). n = 4 or more mice per genotype analyzed. OcnBW mouse strain (B). n = 4 or more mice per genotype analyzed. (C, D) Relative increases in serum insulin levels between baseline and 2 minutes after glucose administration in a glucose stimulated insulin secretion test in male mice of various genotypes in OcnGK mouse strain (C). n = 4 or more mice per genotype analyzed. OcnBW mouse strain (D). n = 3 or more mice per genotype analyzed. Values were normalized to WT values for comparison. (E) Relative β-cell proliferation in pancreas at postnatal day 1 (P1) pups of different genotypes in OcnGK mouse measured after Insulin/BrdU immunostaining. Values were normalized to WT values for comparison. n = 4 or more mice per genotype analyzed. (FI) Percent of initial blood glucose levels and corresponding area under the curve (AUC) in male (F, H) and female (G, I) mice of different genotypes in the OcnGK mouse strain (F, G). n = 3 or more mice per genotype analyzed. OcnBW (H, I) mouse strain following a Pyruvate tolerance test. n = 4 or more mice per genotype analyzed. (J) Relative Pck1, G6pc, and Pygl expression in the liver from P1 pups of different genotypes in the OcnGK strain. n = 5 or more mice per genotype analyzed. (K) Pck1 and G6pc relative expression in the liver of P1 pups in the OcnBW strain. n = 4 or more mice per genotype analyzed. Data information: In bar plots, each dot represents an individual mouse. All data are shown as mean ± SEM. Statistical significance was determined by one-way Kruskal–Wallis test followed by post hoc multiple comparisons test. *p < 0.05; **p < 0.01; ***p < 0.001; ****p < 0.0001, ns: not significant. Source data are available online for this figure.
Figure 4
Figure 4. Osteocalcin of developmental origin influences testicular steroidogenesis in newborn and adult mice.
(A, B) Relative testosterone levels in adult mice of different genotypes in OcnGK mouse strain (A). n = 8 or more mice per genotype analyzed. OcnBW (B) mouse strain. n = 3 or more mice per genotype analyzed. Results were normalized to WT levels for comparison. (C) BrdU immunostaining and quantification of % BrdU positive cells in testes at P1 in pups of different genotypes in OcnGK [top panel] mouse strain. In situ hybridization analysis of Sf1 in testes at P1 pups of different genotypes in OcnGK [bottom panel] mouse strain. (D, E) Relative Lhcgr, Star and Cyp11a1 expression in testes at P1 of different genotypes in OcnGK (D) mouse strain. n = 4 or more mice per genotype analyzed. OcnBW (E) mouse strain. n = 4 or more mice per genotype analyzed. Data information: In bar plots, each dot represents an individual mouse. All data are shown as mean ± SEM. Statistical significance was determined by one-way Kruskal–Wallis test followed by post hoc multiple comparisons test. *p < 0.05; ns: not significant. Source data are available online for this figure.
Figure 5
Figure 5. Transcriptomic analysis of osteocalcin signaling in testes of newborn mice of different genotypes.
(A) Heatmap illustrating results of unsupervised hierarchical clustering of testes obtained from WT (n = 2), Ocn+/− (n = 3) and Ocn−/− (n = 3) mice. (B) Volcano plots of the genes differentially expressed in testes from Ocn+/− [left panel] and Ocn−/− [right panel] mutant compared to WT mice. Each dot represents one gene or pseudogene (n = 3). (C, D) Category netplots depicting the linkages between the top 12 biological processes (GO term) and genes that are significantly (C) upregulated or (D) downregulated in the testes of both Ocn+/− and Ocn−/− compared to WT mice. (E) Heatplot of the top 25 GO molecular functions (GO term) that are significantly downregulated in both Ocn+/− and Ocn−/− compared to WT mice. (F) KEGG pathview graph of glycolysis/gluconeogenesis pathways comparing the transcriptomic data obtained from Ocn+/− mice to those from WT mice. Data information: Values close to −1 (green) indicate a downregulation of the gene in Ocn+/− compared to WT, values close to 0 (gray) indicate no difference and values close to 1 (red) indicate an upregulation in Ocn+/− compared to WT.
Figure 6
Figure 6. Expression of components of molecular clock and a gluconeogenic enzyme in the pancreas, liver and testes depends on the Ocn genotype of the mother.
(A) Relative expression of circadian rhythm-related gene (Per1) in testes of P1 pups in different genotypes from the OcnGK mouse strain. n = 5 or more mice per genotype analyzed. (B) Relative expression of glucose homeostasis-related gene (Pck1) in testes at P1 pups of different genotypes from the OcnGK mouse strain. n = 4 or more mice per genotype analyzed. (CE) Immunohistofluorescence analysis of Bmal1 (C), Clock (D), and Pck1 (E) levels in pancreata of P1 pups of different genotypes in the OcnGK strain. In (C, D), co-immunolocalization of insulin levels was used to identify β-cells. (F) Relative expression of circadian rhythm-related gene (Bmal1, Clock, and Per1) in liver of P1 pups of different genotypes in the OcnGK mouse strain. n = 4 or more mice per genotype analyzed. (G) Relative expressions and quantifications of area under the curve (AUC) of circadian rhythm-related genes Bmal1, Clock, Per1 during the course of 24 h in the liver of adult mice of different genotypes in the OcnGK strain. n = 3 or more mice per genotype analyzed. Data information: In bar plots, each dot represents an individual mouse. All data are shown as mean ± SEM. Statistical significance was determined by one-way Kruskal–Wallis test followed by post hoc multiple comparisons test. *p < 0.05; **p < 0.01; ***p < 0.001, ****p < 0.0001, ns: not significant. Source data are available online for this figure.
Figure 7
Figure 7. Transcriptomic analysis of osteocalcin signaling in the forebrain of newborn mice of different genotypes.
(A) Heatmap illustrating results of unsupervised hierarchical clustering of forebrains obtained from WT (n = 2), Ocn+/− (n = 3) and Ocn−/− (n = 3) mice. (B) Volcano plots of the genes differentially expressed in forebrains from Ocn+/− [left panel] and Ocn−/− [right panel] mutant compared to WT mice. Each dot represents one gene or pseudogene (n = 3). (C, D) Heatplots of the top 25 GO molecular functions (GO term) that are significantly (C) downregulated or (D) upregulated in both Ocn+/− and Ocn−/− compared to WT mice. Pathways and genes that are underlined in green have also been identified in the molecular signature of osteocalcin in testes.
Figure EV1
Figure EV1. Characterization of three mouse models of Ocn deletion.
(A) Photomicrographs of gonadal fat pads from WT129, WTBW, and OcnBW−/− mice. Weight for each group is shown below each representative fat pad image. (B) Percent fat mass relative to body weight in WT129, WTBW, and OcnBW−/− mice assessed by EchoMRI. n = 4 or more mice per genotype analyzed. (C, D) Gonadal fat mass in different genotypes of 12 weeks-old OcnGK mice (C). n = 4 or more mice per genotype analyzed. Gonadal fat mass in different genotypes of 12 weeks-old OcnBW mice (D). n = 7 mice per genotype analyzed. (EG) Serum Osteocalcin levels in different genotypes of 12 weeks-old (E) and 5 weeks-old (F) OcnGK mice. n = 11 or more mice per genotype analyzed. Osteocalcin levels in different genotypes of 12 weeks-old OcnBW mice (G). n = 4 or more mice per genotype analyzed. (H, I) Fed (H) and fasting (I) glucose levels in OcnBW WT and WT129 mice. n = 14 or more mice per genotype analyzed. In bar plots, each dot represents an individual mouse. All data are shown as mean ± SEM. Statistical significance was determined by one-way Kruskal–Wallis test followed by post hoc multiple comparisons test. *p < 0.05; **p < 0.01, ****p < 0.0001. Source data are available online for this figure.
Figure EV2
Figure EV2. Dynamic analysis of glucose metabolism in Ocn-deficient mouse strains.
(A, B) Serum insulin levels at 0 and 2 min after glucose injection in glucose stimulated insulin secretion test in mice of indicated genotypes of OcnGK mouse strain (A). n = 4 or more mice per genotype analyzed. Serum insulin levels at 0 and 2 min after glucose injection in glucose stimulated insulin secretion test in mice of indicated genotypes of OcnBW (B) mouse strain. n = 7 or more mice per genotype analyzed. (CH) Serum glucose levels at different time points post injection of pyruvate in a pyruvate tolerance test in mice of indicated genotypes in the OcnGK (CF) mouse strain. Serum glucose levels at different time points post injection of pyruvate in a pyruvate tolerance test in mice of indicated genotypes in OcnBW (G, H) mouse strain. n = 6 or more mice per genotype analyzed. (I) Relative Pck1 and G6pc expression in the liver from adult mice of different genotypes in the OcnBW strain. n = 4 or more mice per genotype analyzed. In bar plots, each dot represents an individual mouse. All data are shown as mean ± SEM. Statistical significance was determined by one-way Kruskal–Wallis test followed by post hoc multiple comparisons test. *p < 0.05; **p < 0.01; ***p < 0.001 ns: not significant. Source data are available online for this figure.
Figure EV3
Figure EV3. KEGG analysis of transcriptomic studies of testes gene expression.
(A) KEGG pathview graph of the molecular clock comparing the transcriptomic data obtained from Ocn−/− mice to those from WT mice. Values close to −1 (green) indicate a downregulation of the gene in Ocn−/− compared to WT, values close to 0 (gray) indicate no difference and values close to 1 (red) indicate an upregulation in Ocn−/− compared to WT. (B) Heatplots of the top 25 GO biological processes (GO term) that are significantly downregulated in both Ocn+/− and Ocn−/− compared to WT mice. n = 2-3 mice per genotype analyzed.
Figure EV4
Figure EV4. Gene expression analysis in forebrain (newborn) and midbrain (adults).
(A) Relative expressions of circadian rhythm-related genes, Bmal1, Clock, Per1, and Cry1, and glucose homeostasis genes, Pck1 and G6pc in forebrain at P1 in different genotypes from OcnGK mouse strain. n = 9 or more mice per genotype analyzed. (B) Relative expressions of circadian rhythm-related genes Bmal1, Clock, Per1 and Cry1 in midbrain of adult mice of different genotypes from OcnGK mouse strain. n = 4 or more mice per genotype analyzed. In bar plots, each dot represents an individual mouse. All data are shown as mean ± SEM. Statistical significance was determined by one-way Kruskal–Wallis test followed by post hoc multiple comparisons test. Source data are available online for this figure.

Update of

Similar articles

Cited by

References

    1. Accili D, Drago J, Lee EJ, Johnson MD, Cool MH, Salvatore P, Asico LD, Jose PA, Taylor SI, Westphal H. Early neonatal death in mice homozygous for a null allele of the insulin receptor gene. Nat Genet. 1996;12:106–109. - PubMed
    1. Ashworth CJ, Hoggard N, Thomas L, Mercer JG, Wallace JM, Lea RG. Placental leptin. Rev Reprod. 2000;5:18–24. - PubMed
    1. Berger JM, Singh P, Khrimian L, Morgan DA, Chowdhury S, Arteaga-Solis E, Horvath TL, Domingos AI, Marsland AL, Yadav VK, et al. Mediation of the acute stress response by the skeleton. Cell Metab. 2019;30:890–902.e8. - PMC - PubMed
    1. Burger G, Drummond J, Sandstead H (1948) Malnutrition and starvation in Western Netherlands. Part I. General State Printing Office, The Hague
    1. Chan YF, Wai-Sum O, Tang F. Adrenomedullin in the rat testis. I: Its production, actions on testosterone secretion, regulation by human chorionic gonadotropin, and its interaction with endothelin 1 in the leydig cell. Biol Reprod. 2008;78:773–779. - PubMed