. 2024 May;5(5):791-807.
doi: 10.1038/s43018-023-00706-9. Epub 2024 Jan 16.

Intra-tumoral T cells in pediatric brain tumors display clonal expansion and effector properties

Affiliations

Intra-tumoral T cells in pediatric brain tumors display clonal expansion and effector properties

Aditi Upadhye et al. Nat Cancer. 2024 May.

Abstract

Brain tumors in children are a devastating disease in a high proportion of patients. Owing to inconsistent results in clinical trials in unstratified patients, the role of immunotherapy remains unclear. We performed an in-depth survey of the single-cell transcriptomes and clonal relationship of intra-tumoral T cells from children with brain tumors. Our results demonstrate that a large fraction of T cells in the tumor tissue are clonally expanded with the potential to recognize tumor antigens. Such clonally expanded T cells display enrichment of transcripts linked to effector function, tissue residency, immune checkpoints and signatures of neoantigen-specific T cells and immunotherapy response. We identify neoantigens in pediatric brain tumors and show that neoantigen-specific T cell gene signatures are linked to better survival outcomes. Notably, among the patients in our cohort, we observe substantial heterogeneity in the degree of clonal expansion and magnitude of T cell response. Our findings suggest that characterization of intra-tumoral T cell responses may enable selection of patients for immunotherapy, an approach that requires prospective validation in clinical trials.


Conflict of interest statement

Competing Interests

The authors declare no competing financial and / or non-financial interests.

Figures
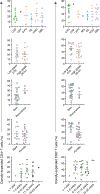
Extended Data Fig. 1:
Extended Data Fig. 1:. Clinical parameters do not correlate with T cell clonal expansion.
Correlation of CD4+ (left panel) or CD8+ (right panel) T cell clonal expansion with clinical and pathological characteristics of PBT patients (CD4+, n = 26; CD8+, n = 32). Patients with <50 CD8+ or CD4+ T cells with TCR data were excluded. Error bars represent mean ± s.e.m.
Extended Data Fig. 2:
Extended Data Fig. 2:. Mutanome analysis of pediatric brain tumors.
a, Schema of mutanome analysis and neoantigen profiling in pediatric brain tumors. b, Number of genomic tumor-specific variants in pediatric brain tumors (n = 9) (top); table shows top 10 high-confidence tumor-specific variants detected in two index patients (MBL, medulloblastoma; HGG, high-grade glioma) (bottom). c, Kaplan-Meier survival curve based on T cell gene signature in pediatric high-grade glioma from the Pediatric Brain Tumor Atlas (PBTA); n = 36 per signature group; n.s. denotes P =0.078 by multivariate Cox regression; HR, hazard ratio; CI, confidence interval.
Extended Data Fig. 3:
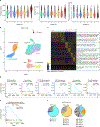
Extended Data Fig. 3:. CD8+ T cell subsets within pediatric brain tumors.
a, Violin plots show the per-cell distribution of unique genes, unique molecular identifiers (UMI), and percentage of UMI mapped to mitochondrial genome in 26,332 single CD8+ T cells across clusters in PBT (n = 38). Box plots extend from the 25th to 75th percentile and the center line represents the median. Whiskers are bounded by 25th percentile - 1.5*interquartile range or 75th percentile + 1.5*interquartile range. b, UMAP shows Seurat clustering of 26,332 CD8+ T cell transcriptomes in PBT (n = 38). c, Heatmap shows top 50 differentially-expressed genes using MAST across CD8+ T cell clusters. d, GSEA plot shows enrichment of the indicated gene signatures in the indicated CD8+ T cell clusters. e, Gene set enrichment analysis (GSEA) plot showing enrichment of the ICB response signature in clonally-expanded versus non-expanded T cells from PBT patients (CD8+, n =38; CD4+, n = 35). In d and e, FDR-adjusted P value (q) and normalized enrichment score (NES) determined using fgsea package on R. f, Pie charts show TRAV, TRAJ and TRBV gene usage by T cells in MAIT cell clusters (below, key).
Extended Data Fig. 4:
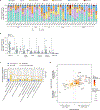
Extended Data Fig. 4:. Composition and phenotype of tumor-infiltrating CD8+ T cells.
a, Subset composition of tumor-infiltrating CD8+ T cells (stacked to 100%) across PBT patients (n = 38); numbers above bars represent total number of CD8+ T cells per patient and when <50, numbers are highlighted in red. b, Proportion of CD8+ T cell subsets among total CD8+ T cells in newly diagnosed (n = 34) versus recurrent (n = 4) tumors (above, key); all comparisons are non-significant by nonparametric two-tailed Mann-Whitney test. Error bars represent mean ± s.e.m. c, Analysis of canonical pathways from the Ingenuity Pathway Analysis database (horizontal axis; bars in plot) for which clonally-expanded CD8+ T cells from PBT show enrichment, presented as the frequency of differentially-expressed genes encoding components of each pathway that are upregulated or downregulated (key) in clonally-expanded CD8+ T cells relative to their expression in non-expanded cells (left vertical axis), and adjusted P values (right vertical axis; line; Fisher’s exact test); numbers above bars indicate total genes in each pathway. d, Crater plot displays genes differentially-expressed between clonally-expanded (clone size > 1) versus non-expanded (clone size = 1) CD8+ T cells from PBT (n = 38) (X axis) or pre-ICB tumors from ICB responders (n = 6) (Y axis). Top right quadrant displays genes upregulated in clonally-expanded CD8+ T cells that are shared between PBT and tumors from ICB responders. Size of dots represents significance (Benjamini-Hochberg FDR-corrected P value < 0.05 and log2 fold change > 0.35 or < −0.35 using MAST) and color of dots represents mean expression of displayed genes.
Extended Data Fig. 5:
Extended Data Fig. 5:. T cell responses in pediatric brain tumors versus adult brain tumors.
a, UMAP (left) and violin (right) displays TCF7 expression across subsets in tumor-infiltrating CD8+ T cells from PBT (n = 38). Inset (above left) shows proportion of TCF7-expressing cells per subset. b, UMAP (left) and violin (right) displays KLRB1 expression across subsets in tumor-infiltrating CD8+ T cells from PBT (n = 38). Inset (above left) shows proportion of KLRB1-expressing cells per subset. c, Expression of CLEC2D transcripts in adult glioblastoma (GBM, n = 96), pediatric high-grade glioma (pHGG, n = 25) or pediatric low-grade glioma (pLGG, n = 93) from PedcBioPortal datasets. In a-c, box plots extend from the 25th to 75th percentile and the center line represents the median. Whiskers represent minimum and maximum values. d, Single-cell trajectory analysis showing relationship between cells in different CD8+ T cell subsets (line) in pediatric brain tumors, constructed using Monocle 3.
Extended Data Fig. 6:
Extended Data Fig. 6:. Tumor-infiltrating PD-1+CD8+ T cells display clonal expansion and cytokine production.
a, Proportion of clonally-expanded CD8+ T cells in PDCD1-nonexpressing versus PDCD1-expressing CD8+ T cells (n = 32) (top); ****P = 1.6×10⁻⁵. Proportion of PDCD1-expressing CD8+ T cells in nonexpanded versus clonally-expanded CD8+ T cells in PBT (n = 32) (bottom); ****P = 1.8×10⁻⁵. P value determined by nonparametric two tailed Wilcoxon matched-pairs signed rank test in both analyses. Patients with <50 CD8+ T cells with TCR data were excluded. b, Representative flow-cytometric gating strategy for the assessment of CD103, cytotoxic molecule, and cytokine expression in total CD8+ T cells and in PD-1negCD8+ T cells versus PD-1+CD8+ T cells from PBT (also related to Fig. 4 b,c). c, Proportion (left plot) of cells expressing IL2 in PDCD1-non-expressing versus PDCD1-expressing CD8+ T cells in PBT (n = 38). Flow-cytometric analysis (right) of the expression and proportion of IL-2+ cells in PD 1negCD8+ T cells versus PD-1+CD8+ T cells from PBT patients (n = 7); n.s. denotes P = 0.16 by non-parametric two-tailed Wilcoxon matched-pairs signed rank test. d, Bar chart shows polyfunctionality based on the production of multiple cytokines in PD-1negCD8+ T cells versus PD-1+CD8+ T cells from PBT (n = 7). e, GSEA plot shows enrichment of cell cycle gene signature in PDCD1-expressing versus PDCD1-non-expressing CD8+ T cells in PBT (n = 38). P value and NES as in Fig. 2a.
Extended Data Fig. 7:
Extended Data Fig. 7:. Expression of transcripts encoding HLA molecules and features of LAG3-expressing CD8+ T cells in pediatric brain tumors.
Expression of (a) HLA-A, HLA-B, HLA-C, HLA-DRB1, HLA-DPB1, and HLA-DQB1 transcripts and (b) antigen processing and presentation signature genes across six diagnoses in the PBTA; error bars represent mean ± s.e.m. CPP, choroid plexus papilloma (n = 16); CrPh, craniopharyngioma (n = 36); LGG, low-grade glioma (n = 302); HGG, high-grade glioma (n = 148); MBL, medulloblastoma (n = 119); AE, anaplastic ependymoma (n = 93). c, Volcano plot shows differentially-expressed genes between LAG3-non-expressing versus LAG3-expressing CD8+ T cells from PBT patients with low expression of PDCD1 in CD8+ T cells (n = 10) (Benjamini-Hochberg FDR-corrected P value < 0.05, log2 fold change > 0.35 or < −0.35 using MAST); dot size and color as in Fig. 6b.
Extended Data Fig. 8:
Extended Data Fig. 8:. CD4+ T cell subsets within pediatric brain tumors.
a, Violin plots show the per-cell distribution of unique genes, unique molecular identifiers (UMI), and percentage of UMI mapped to mitochondrial genome in 14,994 single CD4+ T cells across clusters in PBT (n = 35). Box plots extend from the 25th to 75th percentile and the center line represents the median. Whiskers are bounded by 25th percentile - 1.5*interquartile range or 75th percentile + 1.5*interquartile range. b, UMAP shows Seurat clustering of 14,994 CD4+ T cell transcriptomes in PBT (n = 35). c, Heatmap shows top 50 differentially-expressed genes using MAST across CD4+ T cell clusters. d, GSEA plot shows enrichment of the indicated gene signatures in the indicated CD4+ T cell clusters. e, GSEA plot shows enrichment of CD4-CTL gene signature in clonally-expanded versus non-expanded non-TREG CD4+ T cells. In d and e, P value and NES determined as in Fig. 2a. f, Proportion of clonally-expanded CD4+ T cells in PDCD1-non-expressing versus PDCD1-expressing non-TREG CD4+ T cells (n = 24); Patients with <50 CD4+ T cells with TCR data or patients with 0 PDCD1+CD4+ T cells were excluded; **P = 0.0018 by nonparametric two-tailed Wilcoxon matched-pairs signed rank test. g, Flow-cytometric analysis of IL-2 expression and proportion of IL-2+ cells in PD-1negCD4+ T cells versus PD-1+CD4+ T cells from PBT patients (n = 10); n.s. denotes P = 0.37 by non-parametric two-tailed Wilcoxon matched-pairs signed rank test.
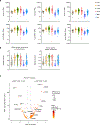
Fig. 1:
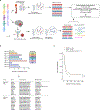
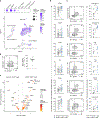
Fig. 1:. T cells within pediatric brain tumors show marked clonal expansion.
a, Study overview. b, T cell receptor (TCR) clone size distribution amongst tumor-infiltrating CD4+ and CD8+ T cells across pediatric brain tumor (PBT) patients (n = 38); grey bars indicate non-expanded cells with a clone size of 1; colored lines delineate expanded clonotypes with clone size >1. c, Proportion (left) of clonally-expanded CD4+ or CD8+ T cells and top five clones (right) among total CD4+ or CD8+ T cells from each patient (CD4+, n = 26; CD8+, n = 32) (dashed line marks 10%); each circle represents a patient (above, key). d, Normalized Inverse Simpson and Shannon-Wiener diversity index of CD4+ T cells (left panel) or CD8+ T cells (right panel) from PBT (CD4+, n = 26; CD8+, n = 32) versus NSCLC (n = 10) (above, key); **P = 0.0090, ****P = 4 × 10⁻⁶ and n.s. denotes P = 0.67 by nonparametric two-tailed Mann-Whitney test. In c and d, patients with <50 CD4+ or CD8+ T cells with TCR data were excluded; error bars represent mean ± s.e.m.
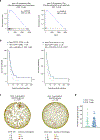
Fig. 2:
Fig. 2:. Tumor-infiltrating T cells display neoantigen-specific T cell gene signatures which are associated with improved survival.
a, Gene set enrichment analysis (GSEA) plot showing enrichment of neoantigen-specific CD8+ or CD4+ T cell gene signatures in clonally-expanded versus non-expanded T cells from PBT patients (CD8+, n = 38; CD4+, n = 35); FDR-adjusted P value (q) and normalized enrichment score (NES) determined using fgsea package on R. b, Kaplan-Meier survival curves showing significant prognostic separation according to CD8 (left) or CD4 (right) neoantigen-specific T cell gene signature in pediatric high-grade glioma from the Pediatric Brain Tumor Atlas (PBTA); n = 36 per signature group; ***P = 0.006, *P = 0.013, by multivariate Cox regression; HR, hazard ratio; CI, confidence interval. c, GLIPH2 analysis showing 1071 CD8+ (left) or 1104 CD4+ (right) specificity groups containing TCRβ sequences with shared motifs in tumor-infiltrating T cells from PBT patients (CD8+, n = 38; CD4+, n = 35). Each node represents a specificity group; node size represents the sum of TCRβ clone sizes within a specificity group; node color represents the number of unique TCRβ sequences; grey linkages represent the sharing of at least one TCRβ (Vβ-CDR3β-Jβ) sequence between specificity groups. d, Number of TCR specificity groups in tumor-infiltrating T cells from PBT patients (CD8+, n = 38; CD4+, n = 35) (dashed line marks 10 specificity groups); each circle represents a patient (above, key); error bars represent mean ± s.e.m.
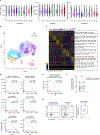
Fig. 3:
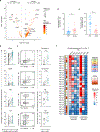
Fig. 3:. Clonally-expanded CD8+ T cells display cell states linked to anti-tumor immunity.
a, Uniform manifold approximation and projection (UMAP) displays single-cell transcriptomes and corresponding clone size of the CD8+ TCR clonotypes across PBT patients (n = 38); circle size in UMAP indicates degree of clonal expansion. Inset (right) shows the frequency of each cell subset among all clonally-expanded CD8+ T cells. b, Subset composition of clonally-expanded CD8+ T cells (stacked to 100%) across PBT patients (n = 32) (above, key); numbers above bars represent total number of expanded CD8+ T cells per patient. c, Proportion of GZMKhigh or CD16+ effector subset among clonally-expanded intra-tumoral CD8+ T cells in low-grade (LGG, CPP, CrPh; n = 14) versus high-grade (MG, AE, HGG, MBL; n = 18) tumors; *P = 0.011, GZMKhigh; *P = 0.034, CD16+ effector, by nonparametric two-tailed Mann-Whitney test. Error bars represent mean ± s.e.m. In b and c, patients with <50 CD8+ T cells with TCR data were excluded.
Fig. 4:
Fig. 4:. Clonally-expanded CD8+ T cells display effector properties.
a, Crater plot displays genes differentially-expressed between clonally-expanded (clone size > 1) versus non-expanded (clone size = 1) CD8+ T cells from PBT (n = 38) (X axis) or NSCLC tumors (n = 10) (Y axis). Top right quadrant displays genes upregulated in clonally-expanded CD8+ T cells that are shared between PBT and NSCLC. Size of dots represents significance (Benjamini-Hochberg FDR-corrected P-value < 0.05 and log2 fold change > 0.35 or < −0.35 using MAST) and color of dots represents mean expression of displayed genes. b, Flow-cytometric analysis of the expression and frequency of CD103+CD8+ T cells (top panel) or GZMK+CD8+ T cells (bottom panel) among tumor-infiltrating CD8+ T cells in PBT patients (n = 10). Error bars represent mean ± s.e.m. c, Bar chart shows production of multiple cytokines in GZMKnegCD8+ T cells versus GZMK+CD8+ T cells from PBT (n = 10). Gating strategy for b and c are shown in Extended Data Fig. 6b. d, Single-cell TCR sequence analysis showing TCR sharing between CD8+ T cells from the indicated subsets (rows in grid, connected by lines); colored vertical bars (top) indicate number of cells with TCR sharing between the indicated subsets (columns); colored horizontal bars (bottom) indicate number of CD8+ T cells per subset; color key as in Figure 3b.
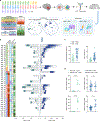
Fig. 5:
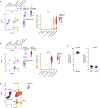
Fig. 5:. PDCD1-expressing intra-tumoral CD8+ T cells are not dysfunctional.
a, UMAP displays PDCD1 expression in tumor-infiltrating CD8+ T cells from PBT (n = 38). Inset (above) shows proportion of PDCD1-expressing cells per subset. b, Flow-cytometric analysis of the expression and frequency of PD-1+CD8+ T cells among tumor-infiltrating CD8+ T cells in PBT patients (n = 10); error bars represent mean ± s.e.m. c, Volcano plot shows differentially-expressed genes between PDCD1-non-expressing versus PDCD1-expressing CD8+ T cells from PBT (n = 38) (Benjamini-Hochberg FDR-corrected P value < 0.05, log2 fold change > 0.35 or < −0.35 by MAST); dot size represents the difference in percentage of expressing cells (for respective genes) between PDCD1-non-expressing and PDCD1-expressing CD8+ T cells; dot color indicates mean expression of respective gene. d, Proportion of cells expressing the indicated differentially-expressed genes between PDCD1-non-expressing versus PDCD1-expressing CD8+ T cells in PBT (n = 38). GZMA, IFNG, TNF, ITGAE, and GZMK are differentially-expressed genes in PDCD1-expressing CD8+ T cells (adjusted P value < 0.05, log2 fold change > 0.35). e, Flow-cytometric analysis of the expression (left) and proportion (right) of expressing cells for each of the indicated effector molecules or TRM marker in PD-1negCD8+ T cells versus PD-1+CD8+ T cells from PBT patients (n = 7 for IFNγ, TNF; n = 10 for granzyme A, granzyme B, granzyme K, CD103); **P = 0.002 for granzyme A, granzyme B, granzyme K, CD103; * P = 0.031 for IFNγ, TNF using non-parametric two-tailed Wilcoxon matched-pairs signed rank test.
Fig 6:
Fig 6:. Heterogeneity in the expression of immunotherapy targets in CD8+ T cells
a, Proportion of cells expressing the indicated transcripts (one per column, left) or ICB response signature score (column, right) in clonally-expanded intra-tumoral CD8+ T cells in PBT (n = 32); patients with <50 CD8+ T cells with TCR data were excluded; TIM3 gene name, HAVCR2; 4–1BB gene name, TNFRSF9. b, Volcano plot shows differentially-expressed genes between LAG3-non-expressing versus LAG3-expressing CD8+ T cells from PBT (n = 38) (Benjamini-Hochberg FDR-corrected P value < 0.05, log2 fold change > 0.35 or < −0.35 using MAST); dot size represents the difference in percentage of expressing cells (for respective genes) between LAG3-non-expressing and LAG3-expressing CD8+ T cells; dot color indicates mean expression of respective gene. c, Proportion of cells expressing the indicated differentially-expressed genes (Benjamini-Hochberg FDR-corrected P value < 0.05, log2 fold change > 0.35) between LAG3-non-expressing versus LAG3-expressing CD8+ T cells in PBT (n = 38). d, Proportion of clonally-expanded CD8+ T cells in LAG3-non-expressing versus LAG3-expressing CD8+ T cells in PBT (n = 32); patients with <50 CD8+ T cells with TCR data were excluded; ****P = 1 × 10⁻⁶ by nonparametric two-tailed Wilcoxon matched-pairs signed rank test; in PDCD1-low patients (n=10), **P = 0.0039. In (c) and (d), orange lines denote PBT donors with low PDCD1 expression in CD8+ T cells (n = 10).
Fig. 7:
Fig. 7:. CD4-CTLs are clonally-expanded in pediatric brain tumors.
a, UMAP displays single-cell transcriptomes and corresponding clone size of the CD4+ TCR clonotypes across PBT patients (n = 35); circle size in UMAP indicates degree of clonal expansion Inset (top) shows the frequency of each cell subset among all clonally-expanded CD4+ T cells. b, Subset composition of tumor-infiltrating CD4+ T cells (stacked to 100%) across PBT patients (n = 35); numbers above bars represent total number of CD4+ T cells per patient and when <50, numbers are highlighted in red. c, UMAP shows CD4-CTL gene signature score (left) or PDCD1 expression (right) in tumor-infiltrating CD4+ T cells from PBT (n = 35). Inset (above, right) shows proportion of PDCD1-expressing cells per subset. d, Flow-cytometric analysis of the proportion of tumor-infiltrating CD4+ T cells expressing granzyme A, granzyme B or PD-1 in PBT (n = 12); error bars represent mean ± s.e.m.
Fig. 8:
Fig. 8:. PD-1+CD4+ T cells display increased expression of cytotoxic molecules and cytokines
a, Volcano plot shows differentially-expressed genes between PDCD1-non-expressing versus PDCD1-expressing non-TREG CD4+ T cells from PBT (n = 35) (Benjamini-Hochberg FDR-corrected P value < 0.05, log2 fold change > 0.35 or < −0.35 using MAST); dot size represents the difference in percentage of expressing cells (for respective genes) between PDCD1-non-expressing and PDCD1-expressing non-TREG CD4+ T cells; dot color indicates mean expression of respective gene. b, Proportion of cells expressing transcripts encoding the indicated effector molecules in PDCD1-non-expressing versus PDCD1-expressing non-TREG CD4+ T cells in PBT (n = 35); GZMA and IFNG are differentially-expressed genes in PDCD1-expressing CD4+ T cells (Benjamini-Hochberg FDR-corrected P value < 0.05, log2 fold change > 0.35 using MAST). c, Flow-cytometric analysis of the expression and proportion of cells expressing the indicated effector molecules in PD-1negCD4+ T cells versus PD-1+CD4+ T cells from PBT (n = 10 for IFNγ, TNF; n = 12 for granzyme A, granzyme B). ***P = 0.0005 for granzyme A, granzyme B using nonparametric two-tailed Wilcoxon matched-pairs signed rank test. d, Proportion of TREG cells and e, CD4-CTL among tumor-infiltrating CD4+ T cells in pediatric brain tumors (n = 35) versus adult high-grade gliomas (n = 26); **P = 0.0013, ****P = 1.4 × 10⁻⁷ respectively by nonparametric two-tailed Mann-Whitney test; error bars represent mean ± s.e.m. f, Proportion of clonally-expanded intra-tumoral CD4+ T cells expressing the indicated transcripts (one per column) in PBT (n = 26) (one per row); patients with <50 CD4+ T cells with TCR data were excluded; TIM3 gene name, HAVCR2; 4–1BB gene name, TNFRSF9.

References

    1. Pollack IF Brain tumors in children. N Engl J Med 331, 1500–1507, doi: 10.1056/NEJM199412013312207 (1994). - DOI - PubMed
    1. Jones C & Baker SJ Unique genetic and epigenetic mechanisms driving paediatric diffuse high-grade glioma. Nat Rev Cancer 14, doi: 10.1038/nrc3811 (2014). - DOI - PMC - PubMed
    1. Chevignard M, Câmara-Costa H, Doz F & Dellatolas G Core deficits and quality of survival after childhood medulloblastoma: a review. Neuro-Oncology Practice 4, 82–97 (2017). - PMC - PubMed
    1. Makale MT, McDonald CR, Hattangadi-Gluth JA & Kesari S Mechanisms of radiotherapy-associated cognitive disability in patients with brain tumours. Nat Rev Neurol 13, 52–64, doi: 10.1038/nrneurol.2016.185 (2017). - DOI - PMC - PubMed
    1. Hwang EI et al. The current landscape of immunotherapy for pediatric brain tumors. Nat Cancer 3, 11–24, doi: 10.1038/s43018-021-00319-0 (2022). - DOI - PubMed

Substances