. 2024 Feb;9(2):451-463.
doi: 10.1038/s41564-023-01588-4. Epub 2024 Jan 16.

Evolution of enhanced innate immune suppression by SARS-CoV-2 Omicron subvariants

Affiliations

Evolution of enhanced innate immune suppression by SARS-CoV-2 Omicron subvariants

Ann-Kathrin Reuschl et al. Nat Microbiol. 2024 Feb.

Abstract

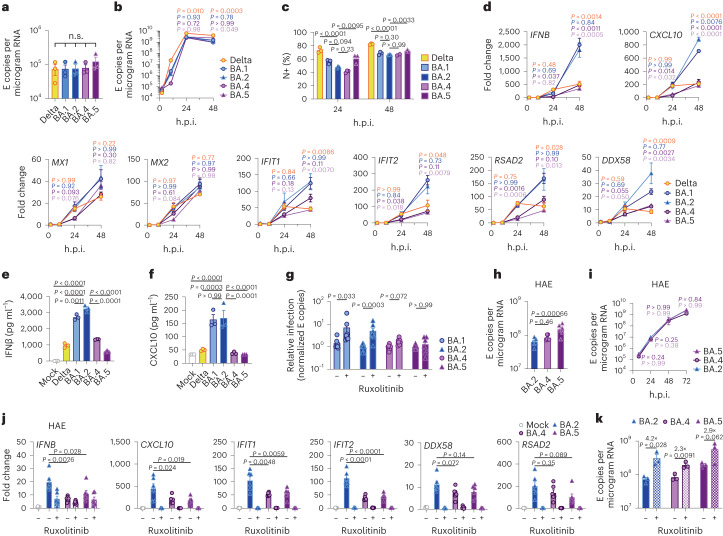
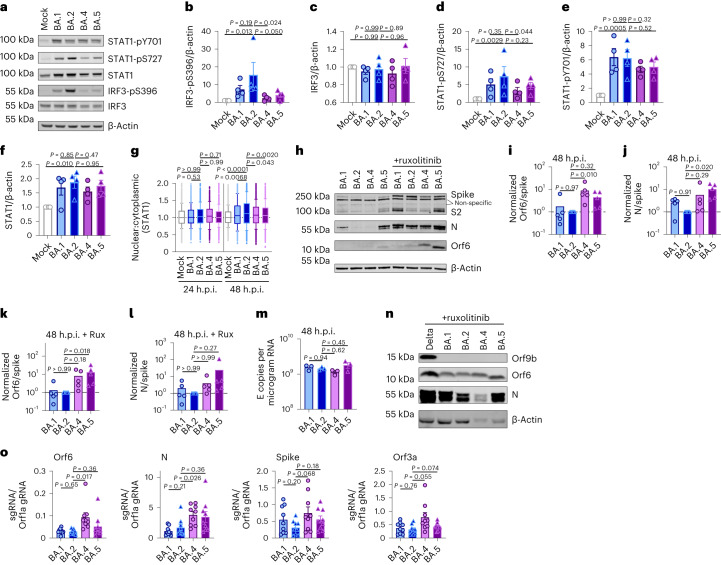
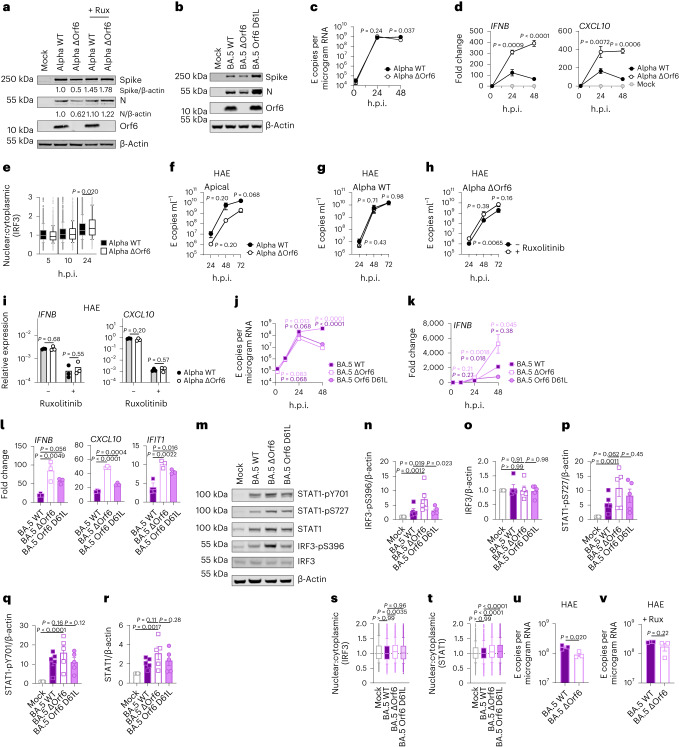
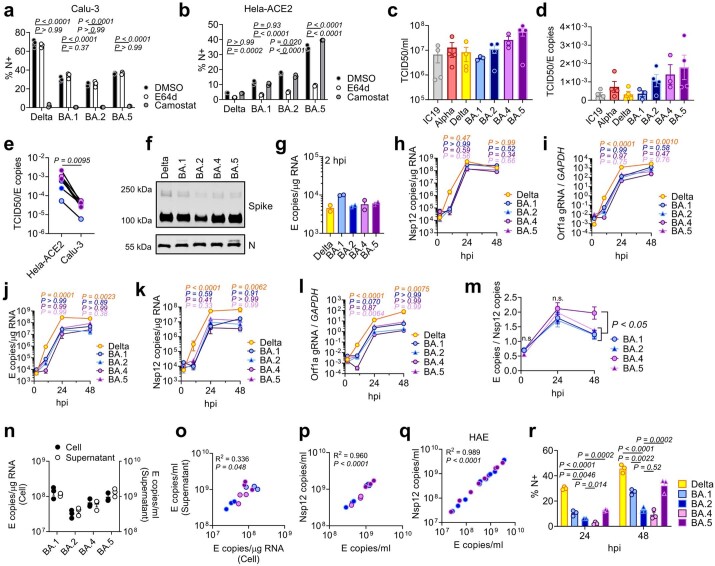
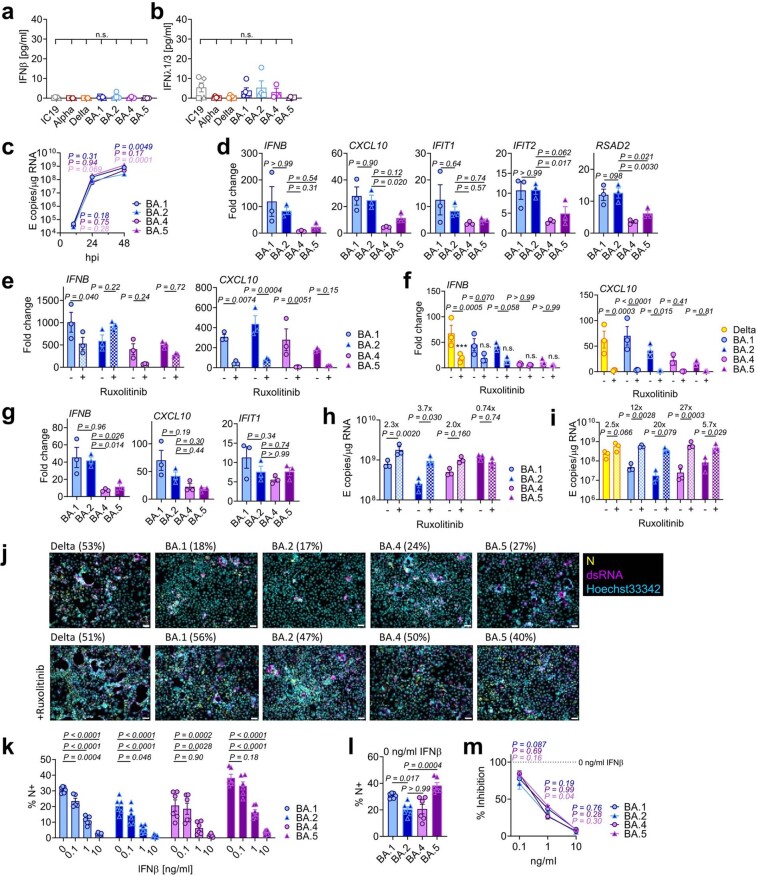
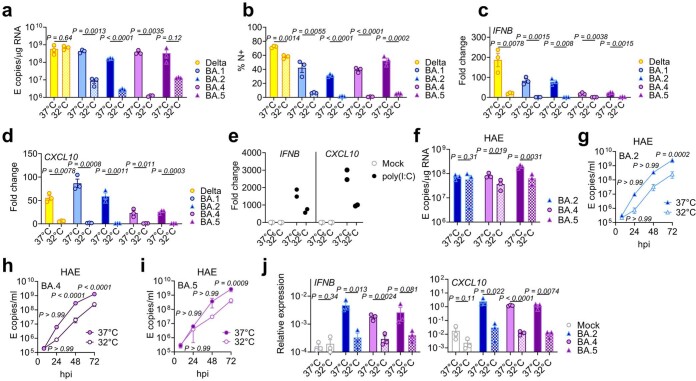
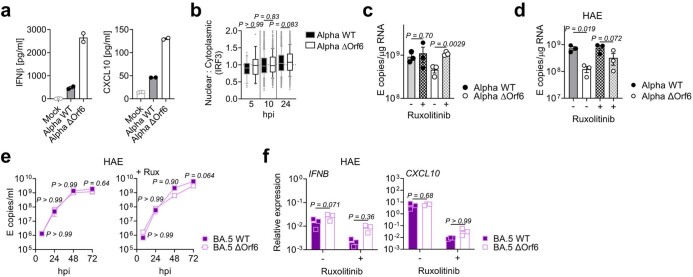
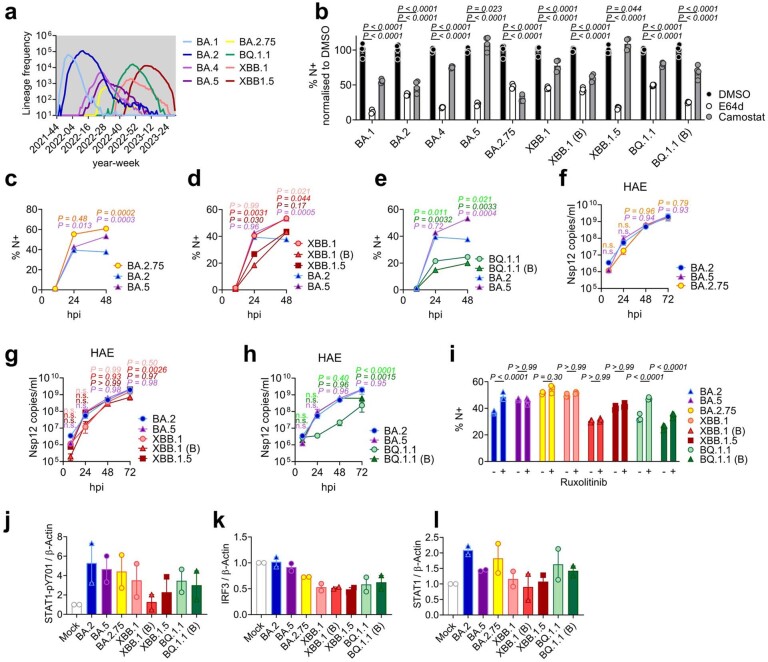
Severe acute respiratory syndrome coronavirus 2 (SARS-CoV-2) human adaptation resulted in distinct lineages with enhanced transmissibility called variants of concern (VOCs). Omicron is the first VOC to evolve distinct globally dominant subvariants. Here we compared their replication in human cell lines and primary airway cultures and measured host responses to infection. We discovered that subvariants BA.4 and BA.5 have improved their suppression of innate immunity when compared with earlier subvariants BA.1 and BA.2. Similarly, more recent subvariants (BA.2.75 and XBB lineages) also triggered reduced innate immune activation. This correlated with increased expression of viral innate antagonists Orf6 and nucleocapsid, reminiscent of VOCs Alpha to Delta. Increased Orf6 levels suppressed host innate responses to infection by decreasing IRF3 and STAT1 signalling measured by transcription factor phosphorylation and nuclear translocation. Our data suggest that convergent evolution of enhanced innate immune antagonist expression is a common pathway of human adaptation and link Omicron subvariant dominance to improved innate immune evasion.


Conflict of interest statement

The authors declare no competing interests.

Figures

Fig. 1
Fig. 1. BA.5 displays enhanced innate immune antagonism during infection of airway epithelial cells.
ag, Calu-3 infection with 2,000 E copies per cell of Delta (yellow, Ο), BA.1 (blue, Ο), BA.2 (blue, Δ), BA.4 (purple, O) and BA.5 (purple, Δ), n = 3: mean viral E copies at 2 h.p.i. across three independent experiments (a); viral replication over time measured by RT–qPCR for intracellular E copies per microgram RNA (b); infection levels measured by nucleocapsid expression (% N+ by flow cytometry) (c); expression of IFNB, CXCL10, IFIT1, IFIT2, RSAD2, MX1, MX2 and DDX58 in infected cells over time (d); IFNβ (e) and CXCL10 (f) secretion from infected Calu-3 cells measured by ELISA at 48 h.p.i.; rescue of viral replication by JAK1-inhibitor ruxolitinib in Calu-3 cells at 48 h.p.i., where relative infection levels are shown across three independent experiments determined by E copies per microgram RNA normalized to the median infection level of the untreated control (g). hk, Primary bronchial HAEs were infected with the indicated variants at 1,500 E copies per cell: viral replication measured by intracellular E copies at 72 h.p.i. (h) and viral release into apical washes over time (i), with three biological replicates shown; expression of IFNB, CXCL10, IFIT1, IFIT2, DDX58 and RSAD2 in HAEs at 72 h.p.i., with six biological replicates shown (j); intracellular viral E copies in HAEs in the presence or absence of 5 μM ruxolitinib at 72 h.p.i., with three biological replicates shown (k). For a, one-way analysis of variance (ANOVA) with Bonferroni post-test was used. n.s., not significant at P > 0.05 for all comparisons. For bh and j, one-way ANOVA and Dunnett’s post-test were used. For i, two-way ANOVA with a Bonferroni post-test was used. For k, one-tailed unpaired Student’s t-test was used. Replicate measurements from one of three independent experiments. Fold change over mock is shown. Mean ± s.e.m. or individual datapoints are shown. h.p.i., hours post infection. Source data
Fig. 2
Fig. 2. BA.5 efficiently expresses SARS-CoV-2 innate antagonists during airway epithelial cell infection.
Calu-3 cells were infected with 2,000 E copies per cell of the indicated variants. a, Western blot of STAT1-pY701, STAT1-pS727, total STAT1, IRF3-pS396, total IRF3 and β-actin at 24 h.p.i. One of four independent western blots is shown. bf, Quantification of four independent western blots showing IRF3-pS396 (b), IRF3 (c), STAT1-pS727 (d), STAT1-pY701 (e) and STAT1 (f) over β-actin at 24 h.p.i. normalized to mock. g, Quantification of STAT1 nuclear translocation detected by single-cell fluorescence microscopy over time in Calu-3 cells infected with the indicated variants. Data from 1,500 cells per condition are shown. In infected cultures, translocation was determined in N+ cells. h, Western blot of Orf6, N, spike and β-actin at 48 h.p.i. in infected cells ± 5 μM ruxolitinib (Rux). Non-specific bands detected by polyclonal anti-spike primary antibody are indicated (see Extended Data Fig. 4e for mock). One of five independent western blots shown. il, Quantification of Orf6 and N expression from five independent western blots of Calu-3 cells in the absence (i, Orf6; j, N) or presence of 5 μM ruxolitinib (k, Orf6; l, N) at 48 h.p.i., normalized to spike over BA.2. m, Viral replication in cells from h. n, Representative western blot of Calu-3 cells infected with Delta, BA.1, BA.2, BA.4 and BA.5 at 2,000 E copies per cell showing Orf9b, Orf6, N and β-actin expression at 48 h.p.i. + 5 μM ruxolitinib. o, sgRNA expression of Orf6, N, spike and Orf3a normalized to Orf1a gRNA in Calu-3 cells at 48 h.p.i.; nine measurements from three independent experiments shown. For bf, i–m and o, one-way analysis of variance with Dunnett’s post-test was used. For g, box-and-whisker blots show 10th–90th percentile, and groups were compared at each timepoint as indicated using a Kruskal–Wallis test. Mean ± s.e.m. or individual datapoints are shown. Source data
Fig. 3
Fig. 3. Orf6 expression is a major determinant of enhanced innate immune antagonism by emerging VOCs.
a,b, Western blot of Alpha (a) or BA.5 (b) reverse genetic (RG) virus infections in Calu-3 cells at 24 h.p.i. ± 5 μM ruxolitinib (Rux). c, Replication of RG viruses parental Alpha WT and ΔOrf6 in Calu-3 cells infected with 2,000 E copies per cell over time. d, Gene expression in cells from c over time. e, Quantification of IRF3 nuclear translocation detected by single-cell fluorescence microscopy over time. fi, HAEs were infected with 1,500 E copies per cell of the indicated variants ± 5 μM ruxolitinib. f, Viral release into apical washes over time. g,h, Apical release in HAEs infected with Alpha WT (g) or ΔOrf6 ± 5 μM ruxolitinib (h). i, Gene expression in cells from f. Three biological replicates shown. j, Replication of RG viruses BA.5 WT, ΔOrf6 and Orf6 D61L isolates in Calu-3 cells infected with 2,000 E copies per cell over time. k, IFNB expression in cells from j. l, Gene expression of Calu-3 cells at 24 h.p.i. m, Western blot of STAT1-pY701, STAT1-pS727, total STAT1, IRF3-pS396, total IRF3 and β-actin at 24 h.p.i. nr, Quantification of five independent western blots showing IRF3-pS396 (n), total IRF3 (o), STAT1-pS727 (p), STAT1-pY701 (q) and total STAT1 (r) over β-actin at 24 h.p.i. s,t, Quantification of IRF3 (s) and STAT1 (t) nuclear translocation detected by single-cell fluorescence microscopy at 24 h.p.i. u,v, Replication of BA.5 WT and ΔOrf6 in HAEs infected with 1,500 E copies per cell in the absence (u) or presence (v) of 5 μM ruxolitinib. For c and d, two-way analysis of variance (ANOVA) and Bonferroni post-test were used. For e, s and t, data from 1,500 cells per condition are shown as box-and-whisker blots indicating 10th–90th percentile. In infected cultures, translocation was determined in N+ cells. Groups were compared by Kruskal–Wallis test. For k, l and nr, one-way ANOVA with Dunnett’s post-test was used. For fi, u and v, unpaired two-tailed Student’s t-test was used. Replicate measurements from one of three independent experiments. Fold change over mock is shown. Mean ± s.e.m. or individual datapoints are shown. Source data
Fig. 4
Fig. 4. Innate immune phenotype of dominant Omicron subvariants.
a, Global SARS-CoV-2 variant sequence counts over time (scaled per variant), extracted from CoV-Spectrum using genomic data from GISAID. bd, Calu-3 cells were infected with 2,000 Nsp12 copies per cell. Replication of Omicron subvariants compared with BA.2 (blue) and BA.5 (purple) measured by Nsp12 copies per microgram RNA is shown for BA.2.75 (yellow; Ο) (b), XBB subvariants (XBB.1: light red, Ο; XBB.1 (B): red, Δ; XBB.1.5: dark red, □) (c) and BQ.1.1 (BQ.1.1: light green, Ο; BQ.1.1 (B): dark green, Δ) (d) isolates. e, HAEs were infected with 1,500 Nsp12 copies per cell and intracellular Nsp12 copies measured at 72 h.p.i. Three biological replicates shown. f, IFNB and CXCL10 expression in Calu-3 cells infected with 2,000 Nsp12 copies per cell of the indicated Omicron subvariants at 24 h.p.i. g, Viral replication of indicated variants in Calu-3 cells in the presence or absence of 5 μM ruxolitinib at 48 h.p.i. Numbers indicate fold change in replication in the presence of 5 μM ruxolitinib. h,i, Western blot of Orf6, N, spike and β-actin at 48 h.p.i. in cells from bd in the absence (h) or presence (i) of 5 μM ruxolitinib. j, Western blot of STAT1-pY701, STAT1-pS727, total STAT1, IRF3-pS396, total IRF3 and β-actin in Calu-3 cells at 48 h.p.i. k,l, Quantification of two independent western blots of IRF3-pS396 (k) and STAT1-pS727 (l) over β-actin at 24 h.p.i. For bd, variant replication was compared with BA.2 at each timepoint using a two-way analysis of variance (ANOVA) and Bonferroni post-test. Colours indicate comparator (BA.5, purple; BA.2.75, yellow; XBB.1, light red; XBB.1 (B), red; XBB.1.5, dark red; BQ.1.1, light green; BQ.1.1 (B), dark green). For eg, one-way ANOVA with Dunnett’s post-test was used to compare all variants with BA.2. Replicate measurements from one of three independent experiments. Fold change over mock is shown. Mean ± s.e.m. or individual datapoints are shown. For f, ***P < 0.0001. Source data
Extended Data Fig. 1
Extended Data Fig. 1. Replication measurements of SARS-CoV-2 variants.
(a) Calu-3 and (b) Hela-ACE2 were infected with 1000 E copies/cell in the presence of DMSO (-), 25 μM E64d or 25 μM Camostat. Infection levels at 24hpi by nucleocapsid expression, one of two independent experiments shown. (c) Quantification of viral stocks used in Figs. 1 and 2 by TCID50/ml on Hela-ACE2. Each symbol indicates an independent virus stock. (d) Ratio of TCID50/ml over E copies/ml for virus stocks from (d). (e) TCID50/ml over E copies/ml of virus stocks measured on Hela-ACE2 or Calu-3 cells. (f) Western blot of purified SARS-CoV-2 virions, n = 2. (g) Calu-3 infection with 200 E copies/cell of Delta (yellow; Ο), BA.1 (blue; Ο), BA.2 (blue; Δ), BA.4 (purple; Ο) and BA.5 (purple; Δ). Viral replication at 2hpi. (h) Nsp12 copies/μg RNA or (i) Orf1a gRNA/GAPDH in cells from Fig. 1a. Viral replication measured by (j) E copies/μg RNA, (k) Nsp12 copies/μg RNA or (l) Orf1a gRNA/GAPDH in cells infected with 200 E copies/ml. (m) E copies/Nsp12 copies in Calu-3 cells. Nine replicates from three independent experiments shown. (n-p) Calu-3 cells were infected with 2000 E copies/cell. (n) Intracellular replication (Cell) and viral release (Supernatant) was determined by quantification of E copies at 24hpi. (o) Correlation graph of intracellular E copies and virus released into supernatant at 24hpi. (p) Nsp12 and E gene copies correlation in supernatants from (n). (q) Correlation of Nsp12 and E copies in apical washes from HAEs infected with BA.2 (blue) or BA.5 (purple) (samples from Fig. 4). (r) Infections levels measured by nucleocapsid expression in cells from (j). For a, b, h-l, r, one-way ANOVA with a Dunnett post-test was used. For a, b, groups were compared to DMSO. For e, paired Student’s t-Test was used. For h-m, groups were compared to BA.2 and colors indicate comparator (Delta, yellow; BA.1, blue; BA.4, purple; BA.5, pink). For m, n.s. is not significant at P > 0.05 for all comparisons. For o,p,q, simple linear regression was used. Triplicate measurements from representative experiments. Mean + /-SEM or individual datapoints shown. hpi, hours post infection. gRNA, genomic RNA. Source data
Extended Data Fig. 2
Extended Data Fig. 2. BA.5 displays enhanced innate immune antagonism during infection of airway epithelial cells.
(a) IFNβ and (b) IFNλ1/3 levels detected in SARS-CoV-2 variant inoculum prepared from virus stocks prepped in Caco-2 cells. Symbols indicate independent virus stocks, 3–5 stocks are shown. (c-e) Calu-3 infection with 2000 E copies/cell of BA.1 (blue; Ο), BA.2 (blue; Δ), BA.4 (purple; Ο) and BA.5 (purple; Δ). (c) Viral replication over time. (d) IFNB, CXCL10, IFIT1, IFIT2 and RSAD2 gene expression at 24hpi. (e) Gene expression in the presence of ruxolitinib in cells from (c). (f) Gene expression in the presence of ruxolitinib in cells from Extended Data Fig. 1j at 24hpi. (g) Gene expression in infected cells at 24hpi in cells from Extended Data Fig. 1j. (h) Viral replication of indicated variants in the presence or absence of 5 μM ruxolitinib at 48hpi in cells from (c). (i) Viral replication of indicated variants in Calu-3 cells from Extended Data Fig. 1j in the presence or absence of 5 μM ruxolitinib at 48hpi. (j) Fluorescence microscopy of Calu-3 cells infected at 2000 E copies/cell at 48hpi in the presence or absence of 5 μM ruxolitinib. Percentage infection quantified by dsRNA-positive cells is indicated per condition. Nucleocapsid (N), yellow; dsRNA, magenta; Hoechst33342, cyan. Representative images from cells in Fig. 1b are shown. Scale bar, 50 μm. (k-m) IFNβ-sensitivity of indicated variants during Calu-3 cell infection at 2000 E copies/cell. (k) Infection levels measured by % N+ at 24hpi at the indicated concentrations of IFNβ. (l) Infection levels in cells from (k) at 0 ng/ml IFNβ. (m) Infection levels from (k) normalized to 0 ng/ml IFNβ for each variant. Six measurements from two independent experiments shown. One-way ANOVA and Dunnett’s post-test were used. Groups were compared as indicated or with BA.2. For a,b, comparisons were made using one-way ANOVA and Bonferroni post-test. For e, comparisons were made against 0 ng/ml IFNβ for each variant. Colors in c and m indicate comparator (BA.1, blue; BA.4, purple; BA.5, pink). Fold change over mock is shown. Triplicate measurements from independent experiments are shown. Mean + /-SEM or individual datapoints are shown. hpi, hours post infection. Source data
Extended Data Fig. 3
Extended Data Fig. 3. Entry and replication characteristics of Omicron subvariant BA.5.
(a-d) Calu-3 cells were infected with 2000 E copies/cell at 37 °C or 32 °C, one representative of two independent experiments shown. (a) Viral replication by RT-qPCR and (b) infection levels by flow cytometry at 24hpi. (c) IFNB and (d) CXCL10 expression in cells from (a). (e) IFNB and CXCL10 expression in response to poly(I:C) transfection in Calu-3 cells at 24h of stimulation, two replicates shown. (f-j) Primary bronchial human airway epithelial cells (HAEs) were infected with 1500 E copies/cell of the indicated variants at 37 °C or 32 °C. Three biological replicates shown. Viral replication was measured by (f) intracellular E copies at 72hpi and viral release of (g) BA.2, (h) BA.4 and (i) BA.5 into apical washes over time. Relative expression of (j) IFNB and CXCL10 normalized to GAPDH in cells from (f). Fold changes are normalized to mock. Pairwise comparisons were performed using an unpaired two-tailed Student’s t-Test as indicated. For g-i, two-way ANOVA with a Bonferroni post-test was used to compare temperatures at each time point. Fold change over mock is shown. Mean + /-SEM or individual datapoints are shown. hpi, hours post infection. Source data
Extended Data Fig. 4
Extended Data Fig. 4. BA.5 efficiently expresses SARS-CoV-2 innate antagonists during airway epithelial cell infection.
(a) Western blot of Calu-3 cells treated with poly(I:C), vehicle control lipofectamin2000 (L2K) or 5 μM ruxolitinib (Rux) where indicated. STAT1-pY701, STAT1-pS727, total STAT1, IRF3-pS396, total IRF3, and β-actin are shown at indicated time points. (b, c) Quantification of (b) IRF3 and (c) STAT1 nuclear translocation detected by single-cell fluorescence microscopy in Calu-3 cells stimulated with poly(I:C) or L2K. Data from 1500 cells/condition are shown. (d) Western blot of Orf9b, Orf6, spike and β-actin at 24hpi in Calu-3 cells infected with the indicated variants at 2000 E copies/cell. (e) Representative western blot of infected Calu-3 cells ±5 μM ruxolitinib. Non-specific bands detected by polyclonal anti-spike primary antibody are indicated. (f-k) Quantification of viral protein expression from five independent western blots of infected Calu-3 cells at 48hpi ±5 μM ruxolitinib. (f, g) Orf6, (h, i) N and (j, k) spike were normalized to β-Actin over BA.2. (l) Western blot of Calu-3 cells infected with BA.1, BA.2 and two independent BA.5 isolates at 48hpi. (m, n) Calu-3 cells were infected with BA.1, BA.2 and two independent BA.5 isolates and (m) replication measured. (n) Expression of IFNB, CXCL10 and IFIT1 is shown at 24hpi in cells from (m). (o) Representative western blot of Orf6 and N expression by HAEs infected with 1500 E copies/cell of BA.2 or BA.5 over time. (p) Viral replication in Calu-3 cells by RT-qPCR at 24hpi. (q) Orf6 and N sgRNA expression in cells from (n). For b, box and whisker blots show 10–90 percentile and groups were compared at each time point as indicated using a Kruskal-Wallis test. For f-k, n, p-q, one-way ANOVA with Dunnett’s post-test was used to compare BA.2 with other variants. For m, two-way ANOVA with a Bonferroni post-test was used to compare variants with BA.2 at each time point. Colors indicate comparator (BA.1, blue BA.5, purple; BA.5 (B), pink). For f-k, m-n, p-q, replicate measurements from one of two independent experiments are shown. Fold change over mock is shown. Mean + /-SEM or individual datapoints are shown. hpi, hours post infection. sgRNA, subgenomic RNA. Source data
Extended Data Fig. 5
Extended Data Fig. 5. Orf6 expression is a major determinant of enhanced innate immune antagonism by emerging VOCs.
(a) IFNβ and CXCL10 secretion from infected Calu-3 cells measured at 48hpi, replicate measurements from one of two independent experiments shown. (b) Quantification of IRF3 nuclear translocation in Calu-3 cells infected with Alpha WT and Alpha ΔOrf6 detected by single-cell fluorescence microscopy over time. Data from 1500 cells/condition are shown. (c) Viral replication in the presence or absence of 5 μM ruxolitinib (Rux) at 48hpi in cells from Fig. 3c. One representative of three independent experiments shown. (d) HAEs were infected with 1500 E copies/cell of the indicated variants in the presence or absence of 5 μM ruxolitinib. Intracellular E copies from three biological replicates are shown. Apical washes are shown in Fig. 3f–h. (e, f) Infection of HAEs with BA.5 WT or BA.5 ΔOrf6 with 1500 E copies/cell showing (e) viral release into apical washes over time or (f) IFNB and CXCL10 normalized to GAPDH at 72hpi. Three biological replicates shown. For a, c-f mean + /-SEM or independent datapoints are shown. For b, box and whisker blots show 10–90 percentile and groups were compared at each time point as indicated using a Kruskal-Wallis test. For c, groups were compared by an unpaired two-tailed Student’s t-Test. For d and f, one-way ANOVA with a Bonferroni post-test was used. For e, two-way ANOVA and Bonferroni post-test was used. Source data
Extended Data Fig. 6
Extended Data Fig. 6. Innate immune phenotype of dominant Omicron subvariants.
(a) Absolute global SARS-CoV-2 variant sequence counts over time, extracted from CoV-Spectrum using genomic data from GISAID. (b) ACE2/TMPRSS2-A549 cells were infected with 2000 Nsp12 copies/cell of the indicated SARS-CoV-2 variants in the presence of DMSO, 25 μM E64d or 25 μM Camostat. Infection levels were determined by N-positivity at 24hpi. (c-e) SARS-CoV-2 Omicron subvariants infection of Calu-3 cells determined by N-positivity over time for the indicated subvariants in cells from Fig. 4b–d with (c) BA.2.75 (yellow; Ο), (d) XBB-subvariants (XBB.1: light red, Ο; XBB.1 (B): red, Δ; XBB.1.5: dark red, □) and (e) BQ.1.1 (BQ.1.1: light green, Ο; BQ.1.1 (B): dark green, Δ) isolates shown. (f-h) HAEs were infected with 1500 E copies/cell of the indicated variants. Viral replication was measured by viral release into apical washes over time in cells from Fig. 4e. (f) BA.2.75, (g) XBB-subvariants and (h) BQ.1.1 isolates are shown compared to BA.2 (blue) and BA.5 (purple). (i) Infection levels of indicated variants in Calu-3 cells in the presence or absence of 5 μM ruxolitinib at 48hpi in cells from Fig. 4g. (j-l) Quantification of two independent western blots showing (j) STAT1-pY701, (k) total IRF3 and (l) total STAT1 over β-actin at 24hpi. For b, treatments were compared to DMSO for each variant using one-way ANOVA and Dunnett’s post-test. For c-i, variant infection levels were compared to BA.2 at each time point by two-way ANOVA and Bonferroni post-test. Colors indicate comparator (BA.5, purple; BA.2.75, yellow; XBB.1, light red; XBB.1 (B), red; XBB.1.5, dark red; BQ.1.1, light green; BQ.1.1 (B), dark green). Replicate measurements from one of three independent experiments. Fold change over mock is shown. Mean + /-SEM or individual datapoints are shown. hpi, hours post infection. Source data
Extended Data Fig. 7
Extended Data Fig. 7. Gating strategy for flow cytometry analysis of nucleocapsid expression.
Representative gating strategy shown. Nucleocapsid-positive cells (N+) were identified by intracellular staining for SARS-CoV-2 N. Positive gates were determined based on uninfected (mock) cells.

References

    1. Thorne LG, et al. Evolution of enhanced innate immune evasion by SARS-CoV-2. Nature. 2022;602:487–495. doi: 10.1038/s41586-021-04352-y. - DOI - PMC - PubMed
    1. Bouhaddou M, et al. SARS-CoV-2 variants evolve convergent strategies to remodel the host response. Cell. 2023;186:4597–4614.e26. doi: 10.1016/j.cell.2023.08.026. - DOI - PMC - PubMed
    1. Hansen CH, et al. Risk of reinfection, vaccine protection, and severity of infection with the BA.5 omicron subvariant: a nation-wide population-based study in Denmark. Lancet Infect. Dis. 2023;23:167–176. doi: 10.1016/S1473-3099(22)00595-3. - DOI - PMC - PubMed
    1. Wolter N, et al. Early assessment of the clinical severity of the SARS-CoV-2 omicron variant in South Africa: a data linkage study. Lancet. 2022;399:437–446. doi: 10.1016/S0140-6736(22)00017-4. - DOI - PMC - PubMed
    1. Viana R, et al. Rapid epidemic expansion of the SARS-CoV-2 Omicron variant in southern Africa. Nature. 2022;603:679–686. doi: 10.1038/s41586-022-04411-y. - DOI - PMC - PubMed