. 2024 May;29(5):1265-1280.
doi: 10.1038/s41380-024-02408-9. Epub 2024 Jan 16.

Dopamine neuron degeneration in the Ventral Tegmental Area causes hippocampal hyperexcitability in experimental Alzheimer's Disease

Affiliations

Dopamine neuron degeneration in the Ventral Tegmental Area causes hippocampal hyperexcitability in experimental Alzheimer's Disease

Elena Spoleti et al. Mol Psychiatry. 2024 May.

Abstract

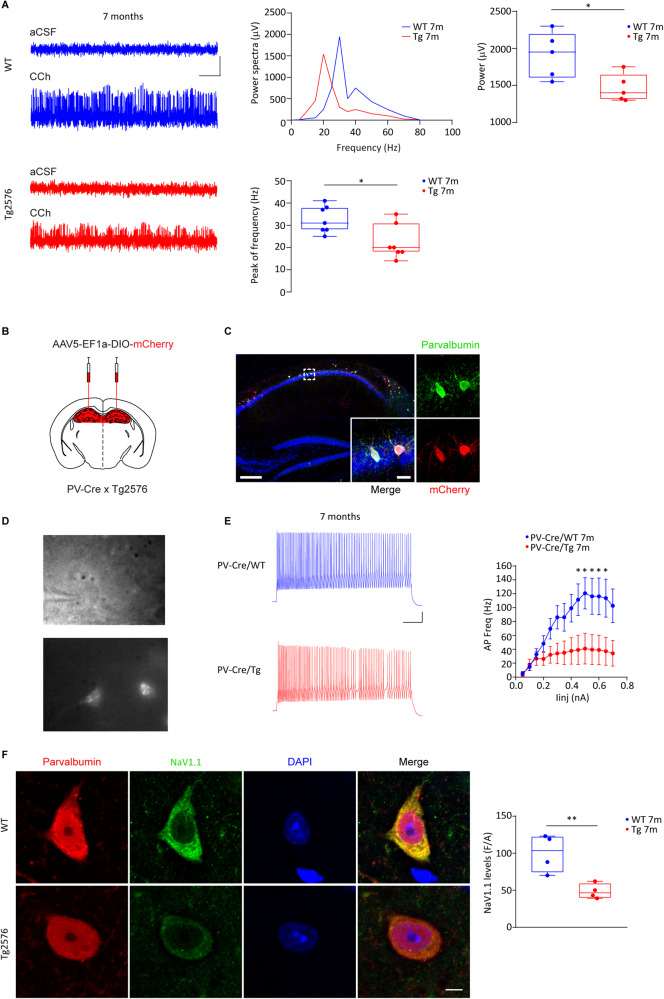
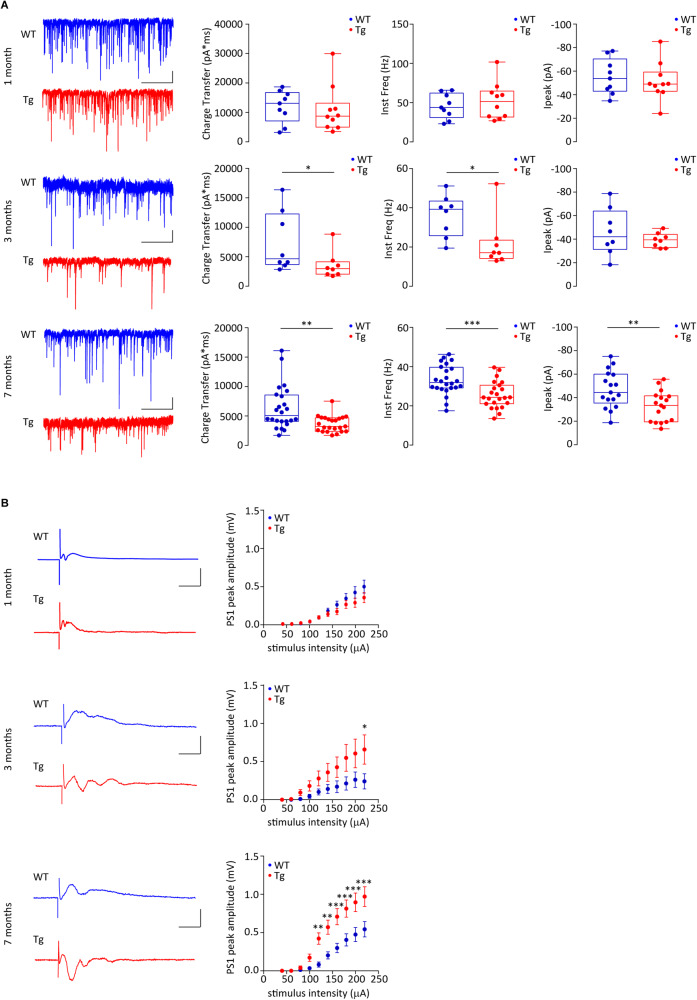
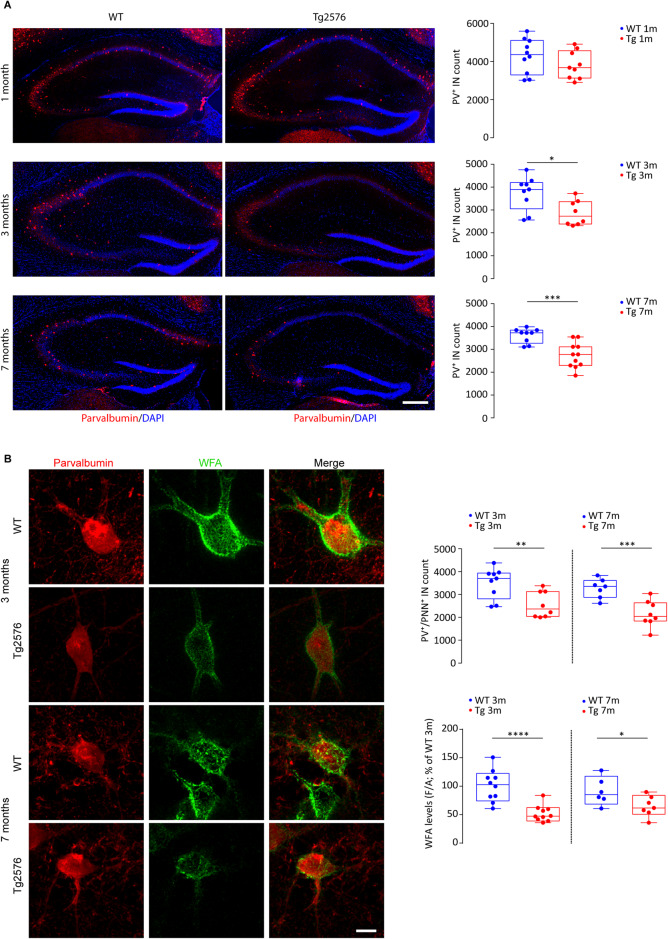
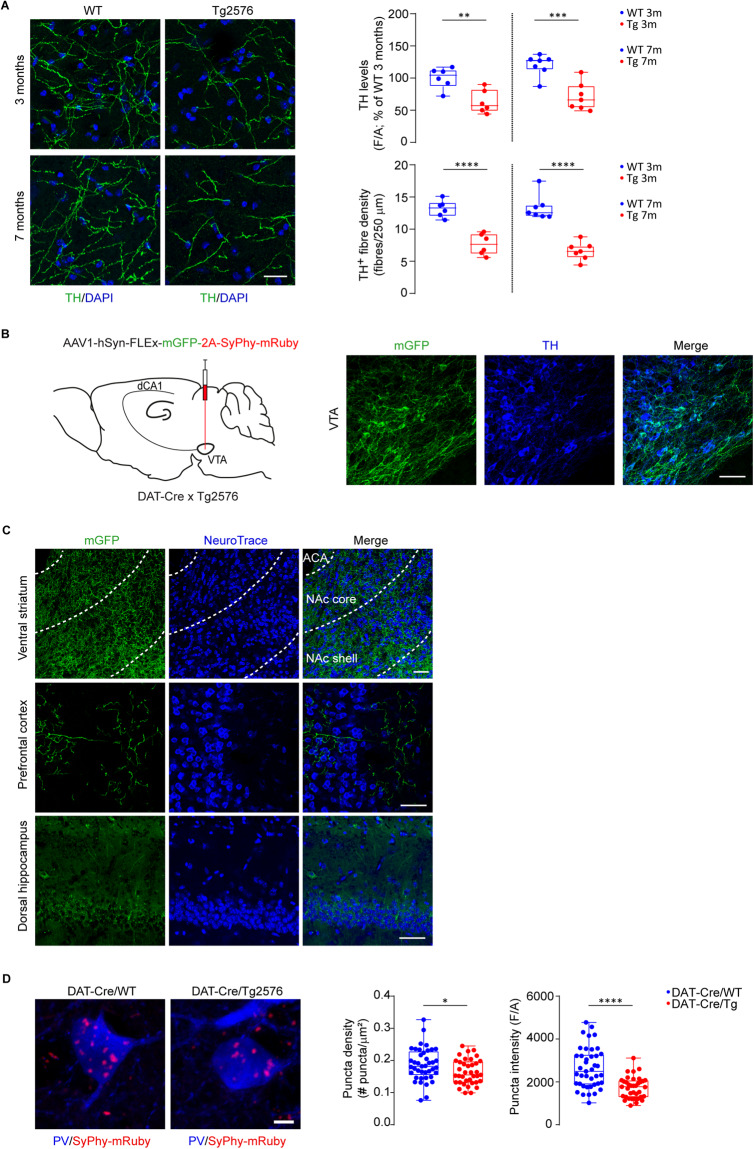
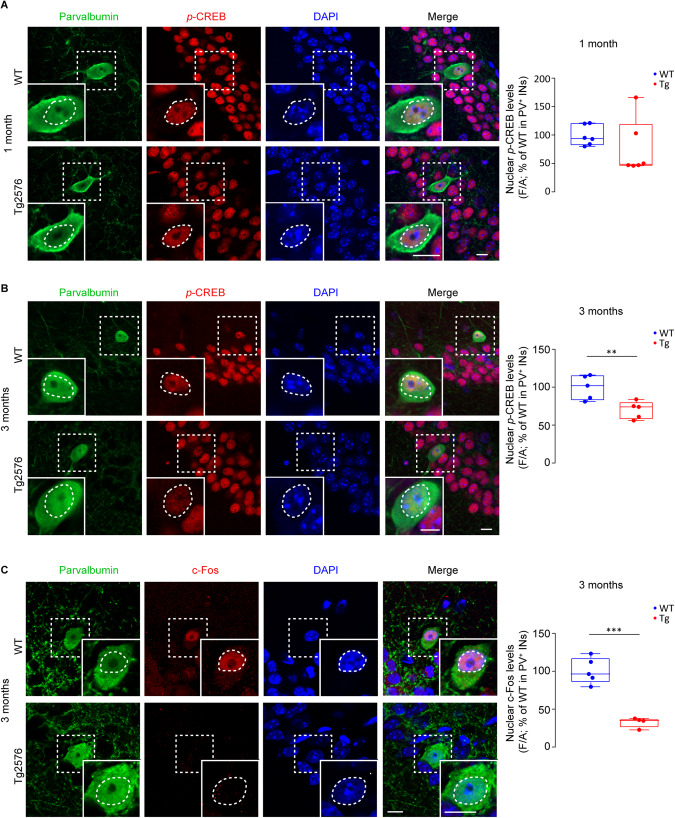
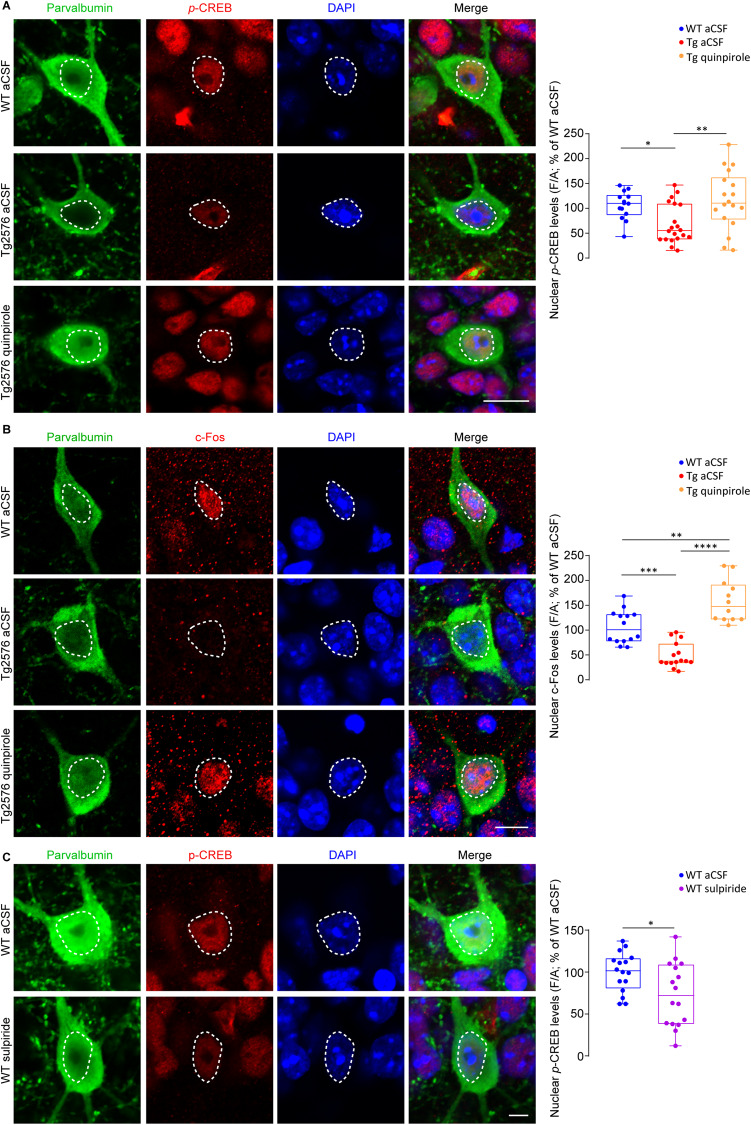
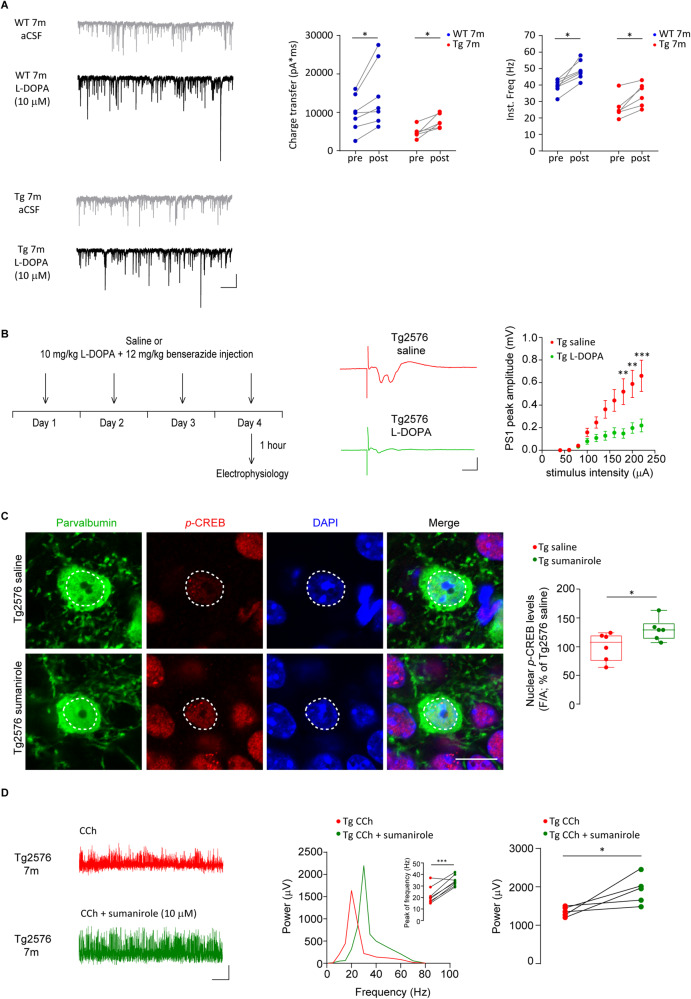
Early and progressive dysfunctions of the dopaminergic system from the Ventral Tegmental Area (VTA) have been described in Alzheimer's Disease (AD). During the long pre-symptomatic phase, alterations in the function of Parvalbumin interneurons (PV-INs) are also observed, resulting in cortical hyperexcitability represented by subclinical epilepsy and aberrant gamma-oscillations. However, it is unknown whether the dopaminergic deficits contribute to brain hyperexcitability in AD. Here, using the Tg2576 mouse model of AD, we prove that reduced hippocampal dopaminergic innervation, due to VTA dopamine neuron degeneration, impairs PV-IN firing and gamma-waves, weakens the inhibition of pyramidal neurons and induces hippocampal hyperexcitability via lower D2-receptor-mediated activation of the CREB-pathway. These alterations coincide with reduced PV-IN numbers and Perineuronal Net density. Importantly, L-DOPA and the selective D2-receptor agonist quinpirole rescue p-CREB levels and improve the PV-IN-mediated inhibition, thus reducing hyperexcitability. Moreover, similarly to quinpirole, sumanirole - another D2-receptor agonist and a known anticonvulsant - not only increases p-CREB levels in PV-INs but also restores gamma-oscillations in Tg2576 mice. Conversely, blocking the dopaminergic transmission with sulpiride (a D2-like receptor antagonist) in WT mice reduces p-CREB levels in PV-INs, mimicking what occurs in Tg2576. Overall, these findings support the hypothesis that the VTA dopaminergic system integrity plays a key role in hippocampal PV-IN function and survival, disclosing a relevant contribution of the reduced dopaminergic tone to aberrant gamma-waves, hippocampal hyperexcitability and epileptiform activity in early AD.


Conflict of interest statement

The authors declare no competing interests.

Figures

Fig. 1
Fig. 1. Gamma oscillations and PV-IN firing are altered in Tg2576 mice.
A Representative traces of local field potentials recorded in the hippocampal pyramidal layer of 7-month-old WT and Tg2576 mice before (aCSF) and during CCh bath-perfusion (scale bars: 500 ms, 200 μV). (Upper) The representative power spectra and relative plot for these signals acquired during CCh perfusion indicate a reduced gamma-power in Tg2576 mice compared to WTs; (bottom) the plot shows the peak frequency reduction in the gamma-frequency range in Tg2576 mice with respect to WT littermates (n = 7 slices, 3 WT and Tg2576 mice; power: *p = 0.031; peak frequency: *p = 0.017, all with unpaired t-test with Welch’s correction). B Schematic representation of AAV5-EF1a-DIO-mCherry stereotaxic bilateral injections in the dorsal hippocampus of PV-Cre/Tg2576 and PV-Cre/WT mice. C Representative confocal images showing the selective viral infection (mCherry, red) of PV-INs (PV, green; scale bar: 200 μm). Inserts show high magnification of infected cells (scale bar: 20 μm). D Images show patch-clamp recordings from a CA1 PV-IN visualized with infrared videomicroscopy (top) and fluorescence (bottom). E Example traces show action potentials fired by PV-INs from 7-month-old PV-Cre/WT and PV-Cre/Tg2576 mice following 50 pA stepped current injection (scale bars: 12 mV; 125 ms). The f-I curves (±s.e.m.) show a reduced number of action potentials recorded from CA1 PV-INs of PV-Cre/Tg2576 mice compared to PV-Cre/WTs (n = 11 cells, 4 PV-Cre/WT mice; n = 6 cells, 4 PV-Cre/Tg2576 mice; two-way RM ANOVA, with Bonferroni’s multiple comparisons post-hoc test, genotype x injected current, F13,182 = 3.001, ***p = 0.0005; WT vs Tg2576: *p = 0.046, 0.45 nA, *p = 0.018, 0.50 nA; *p = 0.026, 0.55 nA; *p = 0.025, 0.60 nA; *p = 0.027, 0.65 nA). F Representative confocal images of NaV1.1 (green) in labeled CA1 PV-INs (PV, red) in 7-month-old WT and Tg2576 mice (scale bar: 5 µm). NaV1.1 levels are reduced in Tg2576 PV-INs compared to WTs (n = 4 WT and Tg2576 mice; **p = 0.009 with unpaired t-test). The nuclei are visualized by DAPI (blue).
Fig. 2
Fig. 2. Tg2576 mice show reduced GABAergic transmission and hippocampal hyperexcitability starting at 3 months of age.
A Examples of sIPSCs recorded from CA1 PNs of 1-, 3- and 7-month-old Tg2576 and WTs (scale bars: 25 pA; 2 s). (Top) Plots show no differences between genotypes at 1 month of age (n = 9 cells, 4 WT mice; n = 10 cells, 4 Tg2576 mice; Total charge transfer: p = 0.549 with Mann–Whitney U test; Inst. Freq.: p = 0.486 with unpaired t-test with Welch’s correction; Ipeak: p = 0.581 with unpaired t-test with Welch’s correction). (Middle) 3-month-old Tg2576 mice show reduced total charge transfer and Inst. Freq. of sIPSCs with respect to WTs, whilst no changes were detected in peak amplitude (n = 8 cells, 4 WT mice, n = 8 cells, 6 Tg2576 mice; Total charge transfer *p = 0.038; Inst. Freq. *p = 0.021, all with Mann–Whitney U test). (Bottom) 7-month-old Tg2576 mice show reduced total charge transfer, Inst. Freq. and peak amplitude of sIPSCs compared to age-matched controls (n = 24 cells, 6 WT mice; n = 23 cells, 6 Tg2576 mice; Total charge transfer **p = 0.006 with Mann–Whitney U test; Inst. Freq. ***p = 0.007 with unpaired t-test with Welch’s correction; Ipeak **p = 0.006 with unpaired t-test with Welch’s correction). B Representative traces showing POPs recorded from the CA1 stratum pyramidale following half-maximal Schaffer collateral stimulation (scale bars: 0.25 mV; 5 ms; Left) and complete I/O curves (±s.e.m.; Right) in 1-, 3- and 7-month-old WT and Tg2576 mice. (Top) Plot shows similar I/O curves between genotypes at 1 month of age (n = 16 slices, 4 WT mice; n = 12 slices, 4 Tg2576 mice; two-way RM ANOVA with Bonferroni’s multiple comparison post-hoc test, genotype x stimulus intensity, F9,234 = 1.566, p = 0.126). (Middle) 3-month-old Tg2576 mice show increased POP peak amplitude in response to the maximum stimulation compared to controls (n = 7 slices, 4 WT mice; n = 8 slices, 6 Tg2576 mice; two-way RM ANOVA with Bonferroni’s, genotype x stimulus intensity, F9,117 = 2.610, p = 0.009; *p = 0.044 at 220 μA). (Bottom) I/O curves from 7-month-old Tg2576 mice show bigger POP peak amplitude than controls in response to increasing afferent stimulations (n = 14 slices, 6 WT mice; n = 12 slices, 6 Tg2576 mice; two-way RM ANOVA with Bonferroni’s, genotype x stimulus intensity, F9, 216 = 7.415, p < 0.0001; **p = 0.008, 120 μA, **p = 0.003, 140  μA, ***p = 0.0006, 160 μA, ***p = 0.0006, 180 μA, ***p = 0.0003, 200 μA, ***p = 0.0003, 220 μA).
Fig. 3
Fig. 3. Reduced number of PV-INs and PNN alterations in Tg2576 mice since 3 months of age.
A Representative confocal images of labeled PV-INs (PV, red) in coronal brain sections of dorsal hippocampus (DAPI, blue) of WT and Tg2576 mice at 1, 3 and 7 months of age and related stereological cell count (scale bar: 250 μm). The plot of 1-month-old mice indicates similar stereological cell counts for PV-INs between genotypes (n = 10 WT, n = 9 Tg2576 mice; p = 0.220); bottom plots show the reduction of PV-INs in the hippocampus of 3- and 7-month-old Tg2576 mice compared to WTs (3-month-old: n = 9 WT, n = 8 Tg2576 mice; *p = 0.015; 7-month-old: n = 9 WT, n = 11 Tg2576 mice; ***p = 0.0005; all with unpaired t-test). B Analysis of confocal Z-stack double immunofluorescent labeling of PV+/PNN+ INs (PV, red; WFA, green) in the dorsal hippocampus of 3- and 7-month-old WT and Tg2576 mice (scale bar: 10 μm); (top) the stereological cell count plot shows the reduced number of Tg2576 PV+/PNN+ INs compared to age-matched controls at both ages (3-month-old: n = 9 WT, n = 8 Tg2576 mice; **p = 0.007; 7-month-old: n = 7 WT, n = 8 Tg2576 mice; ***p = 0.001; all with unpaired t-test); (bottom) the plot shows reduced WFA fluorescence intensity in Tg2576 PV-INs at 3 and 7 months of age (3-month-old: n = 10 WT and Tg2576 mice; ****p < 0.0001; 7-month-old: n = 6 WT and n = 7 Tg2576 mice; *p = 0.043; all with unpaired t-test).
Fig. 4
Fig. 4. The dopaminergic input from the VTA is reduced in hippocampal PV-INs of Tg2576 mice.
A Z-stack immunofluorescent labeling of TH+ fibers (green) of dorsal hippocampus (scale bar: 25 μm). The upper plot depicts densitometric values of TH (3-month-old: n = 6 WT and Tg2576 mice; **p = 0.004; 7-month-old: n = 7 WT and Tg2576 mice; ***p = 0.0004; all with unpaired t-test) in 3- and 7-month-old WT and Tg2576 mice. The bottom plot shows mean TH+ fiber density (fibers/250 µm; 3-month-old: n = 6 WT and Tg2576 mice; ****p < 0.0001; 7-month-old: n = 7 WT and Tg2576 mice; ****p < 0.0001; all with unpaired t-test). B Schematic representation of AAV1-hSyn-FLEx-mGFP-2A-SyPhy-mRuby stereotaxic injection in the left VTA of DAT-Cre/Tg2576 and DAT-Cre/WT mice and representative confocal images showing the selective infection of VTA TH+ neurons (blue) with the injected AAV (mGFP, green; scale bar: 50 μm). C Representative confocal images (scale bar: 50 μm) showing 3 different VTA projection areas (NeuroTrace, blue) containing mGFP-labeling (Ventral striatum, Prefrontal cortex and the dorsal hippocampus; ACA: Anterior Cerebral Artery). D Representative z-stack confocal images showing the density of dopamine synapses (mRuby, red) onto CA1 PV-INs (blue) and relative plots showing reduced dopaminergic synapse density (left) and mean fluorescence (right) in CA1 PV-INs of 7-month-old Tg2576 mice compared to age-matched WTs (n = 41 cells, 3 WT mice; n = 37 cells, 3 Tg2576 mice; density as #puncta/μm2: *p = 0.028 with unpaired t-test; mean fluorescence: ****p < 0.0001; unpaired t-test with Welch’s correction; scale bar: 10 μm).
Fig. 5
Fig. 5. Reduced p-CREB and c-Fos levels in PV-INs of 3-month-old Tg2576 mice.
A Confocal images of nuclear p-CREB (red) in CA1 PV-INs (green) of 1-month-old Tg2576 and WT mice (scale bar: 10 µm each). The plot shows no changes in nuclear p-CREB levels in PV-INs from 1-month-old mice (n = 6 WT and Tg2576 mice; p = 0.223 with Mann–Whitney U test). Confocal images of nuclear p-CREB (B, red) and c-Fos (C, red) levels in CA1 PV-INs (green) of 3-month-old WT and Tg2576 mice. Protein levels of nuclear p-CREB (B) and c-Fos (C) in PV-INs of 3-month-old Tg2576 mice were reduced compared to WT littermates (p-CREB: n = 5 WT and Tg2576 mice; *p = 0.011 with unpaired t-test with Welch’s correction; c-Fos: n = 5 WT, n = 4 Tg2576 mice; ***p = 0.002 with unpaired t-test). The nuclei are visualized by DAPI (blue; scale bar: 10 µm each).
Fig. 6
Fig. 6. D2-like receptor activation increases p-CREB and c-Fos levels in PV-INs of Tg2576 mice.
A Confocal images of nuclear p-CREB (red) in CA1 PV-INs (green; scale bar: 10 µm) from 3-month-old mice in acute slices incubated for 10 min with aCSF or quinpirole 60 µM. Fluorescence intensity levels of nuclear p-CREB in PV-INs of 3-month-old Tg2576 aCSF were lower compared to WT aCSF; PV-INs in Tg2576 slices treated with quinpirole show enhanced levels of nuclear p-CREB with respect to Tg2576 aCSF (n = 14 WT aCSF cells; n = 20 Tg2576 aCSF cells; n = 18 Tg2576 quinpirole cells; n = 3 mice each. One-Way ANOVA interaction F2,49 = 6.029, p = 0.005; Tukey’s post-hoc test: WT aCSF vs Tg2576 aCSF: *p = 0.049; Tg2576 aCSF vs Tg2576 quinpirole: **p = 0.005). B Same as above, showing nuclear c-Fos (red; scale bar: 10 µm). c-Fos nuclear levels in PV-INs of 3-month-old Tg2576 aCSF were reduced compared to WT aCSF; PV-INs of Tg2576 slices treated with quinpirole show high levels of c-Fos with respect to Tg2576 aCSF (F/A % of WT aCSF; n = 14 WT aCSF cells; n = 15 Tg2576 aCSF cells; n = 12 Tg2576 quinpirole; n = 3 WT and Tg2576 mice. One-Way ANOVA interaction: F2,38 = 35.18, p < 0.0001; with Tukey’s post-hoc test: WT aCSF vs Tg2576 aCSF: ***p = 0.0001; Tg2576 aCSF vs Tg2576 quinpirole 60 µM: ****p < 0.0001; WT aCSF vs Tg2576 quinpirole 60 µM: **p = 0.0011). The nuclei are visualized by DAPI (blue). C Same as above, showing nuclear p-CREB levels (red) in CA1 PV-INs (green) from 3-month-old WT mice in acute slices incubated for 10 min with aCSF or sulpiride 100 µM (scale bar: 5 µm). Nuclear p-CREB levels in PV-INs of WT sulpiride slices are reduced compared to WT aCSF (n = 16 cells/group; n = 3 mice; *p = 0.022 with unpaired t-test).
Fig. 7
Fig. 7. L-DOPA or sumanirole rescues GABAergic activity, reduces hippocampal hyperexcitability and enhances gamma-oscillations in Tg2576 mice.
A Examples of sIPSCs recorded from WT (Top) and Tg2576 (Bottom) CA1 PNs at 7 months of age before (gray) and after (black) bath-applied L-DOPA 10 μM (scale bars: 50 pA; 1 s). Plots show that L-DOPA increases charge transfer (left) and  Inst. Freq. (right) of sIPSCs in both Tg2576 and WT mice (n = 7 cells, 3 WT mice; n = 6 cells, 3 Tg2576 mice; WT aCSF vs WT L-DOPA: charge transfer *p = 0.016; Inst. Freq: *p = 0.016; Tg2576 aCSF vs Tg2576 L-DOPA: charge transfer *p = 0.031; Inst. Freq: *p = 0.031; all with Wilcoxon matched-pairs signed rank test). B (Top) Experimental procedure for the sub-chronic treatment of saline or L-DOPA (10 mg/kg + benserazide 12 mg/kg) in 7-month-old WT and Tg2576 mice. Animals received single i.p. injections (5 μl/grams of weight) for 4 consecutive days; mice were sacrificed 1 h after the last injection to perform electrophysiological recordings. (Bottom) Representative POPs recorded from the CA1 stratum pyramidale following half-maximal Schaffer collateral stimulation in 7-month-old Tg2576 mice with sub-chronic L-DOPA or saline treatment (left; scale bars: 0.5 mV; 10 ms) and relative I/O curves (right) at increasing stimulation. I/O curves show that the peak amplitude of POPs in Tg2576 mice treated with L-DOPA is reduced compared to Tg2576 animals injected with saline (n = 10 Tg2576 saline, n = 8 Tg2576 L-DOPA slices; n = 3 Tg2576 mice; I/O curves: Two-way RM ANOVA with Sidak’s multiple comparisons post-hoc test, treatment × stimulus intensity, F9,153 = 6.621, p < 0.0001; **p = 0.003, 180 μA; **p = 0.002, 200 μA, ***p = 0.0002, 220 μA). C Confocal images of nuclear p-CREB (red) in CA1 PV-INs (green) of 3-month-old Tg2576 mice injected with sumanirole (5 mg/kg, i.p.) or saline (scale bar: 5 µm). Nuclear p-CREB levels in PV-INs from Tg2576 mice injected with sumanirole are increased compared to saline-injected Tg2576 (n = 6 mice/group; *p = 0.043 with unpaired t-test). D Representative traces of CCh-induced local field potentials recorded in the hippocampal pyramidal layer of 7-month-old Tg2576 slices before and during sumanirole bath-application (scale bars: 500 ms, 200 μV). On the left, a representative power spectra plot is shown together with an inset showing the peak of frequency increasing following sumanirole (n = 8 slices/group; n = 3 Tg2576 mice; ***p = 0.0007 paired t-test); on the right, the relative plot indicates that bath-applied sumanirole increases gamma-power in Tg2576 slices (n = 3 Tg2576 mice; n = 5 slices/group; *p = 0.048 paired t-test).

Similar articles

Cited by

References

    1. Gauthier S, Webster C, Servaes S, Morais JA, Rosa-Neto P. World Alzheimer Report 2022 – Life after diagnosis: Navigating treatment, care and support. London, England: Alzheimer’s Disease International; 2022.
    1. Blennow K, de Leon MJ, Zetterberg H. Alzheimer’s disease. Lancet. 2006;368:387–403. doi: 10.1016/S0140-6736(06)69113-7. - DOI - PubMed
    1. Krashia P, Spoleti E, D’Amelio M. The VTA dopaminergic system as diagnostic and therapeutical target for Alzheimer’s disease. Front Psychiatry. 2022;13:1039725. doi: 10.3389/fpsyt.2022.1039725. - DOI - PMC - PubMed
    1. Amatniek JC, Hauser WA, DelCastillo-Castaneda C, Jacobs DM, Marder K, Bell K, et al. Incidence and predictors of seizures in patients with Alzheimer’s disease. Epilepsia. 2006;47:867–72. doi: 10.1111/j.1528-1167.2006.00554.x. - DOI - PubMed
    1. Koenig T, Prichep L, Dierks T, Hubl D, Wahlund LO, John ER, et al. Decreased EEG synchronization in Alzheimer’s disease and mild cognitive impairment. Neurobiol Aging. 2005;26:165–71. doi: 10.1016/j.neurobiolaging.2004.03.008. - DOI - PubMed

MeSH terms