. 2024 May;45(5):1060-1076.
doi: 10.1038/s41401-023-01219-y. Epub 2024 Jan 16.

Targeted inhibition of the HNF1A/SHH axis by triptolide overcomes paclitaxel resistance in non-small cell lung cancer

Affiliations

Targeted inhibition of the HNF1A/SHH axis by triptolide overcomes paclitaxel resistance in non-small cell lung cancer

Ling-Bing Li et al. Acta Pharmacol Sin. 2024 May.

Abstract

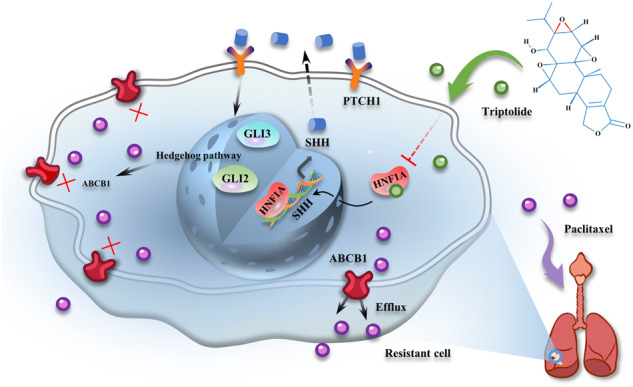
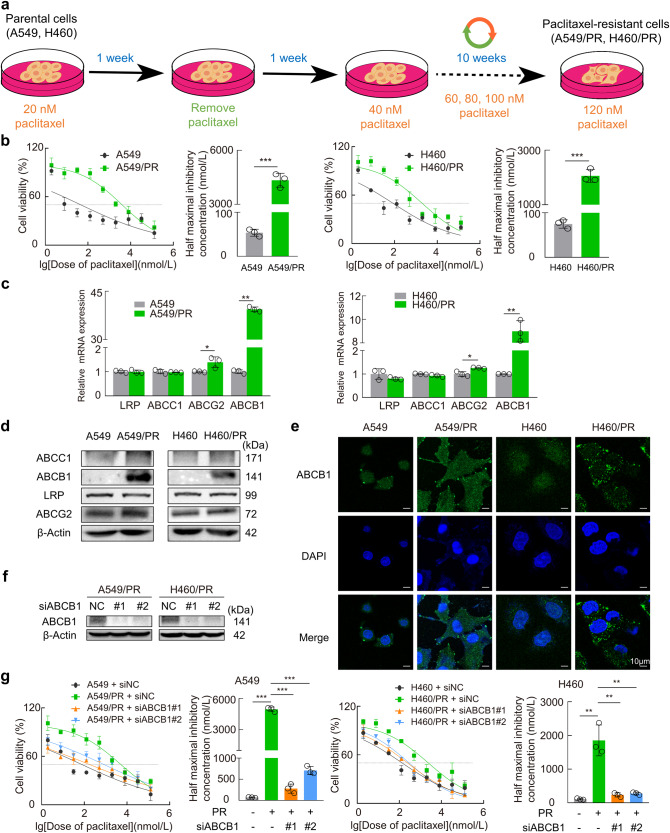
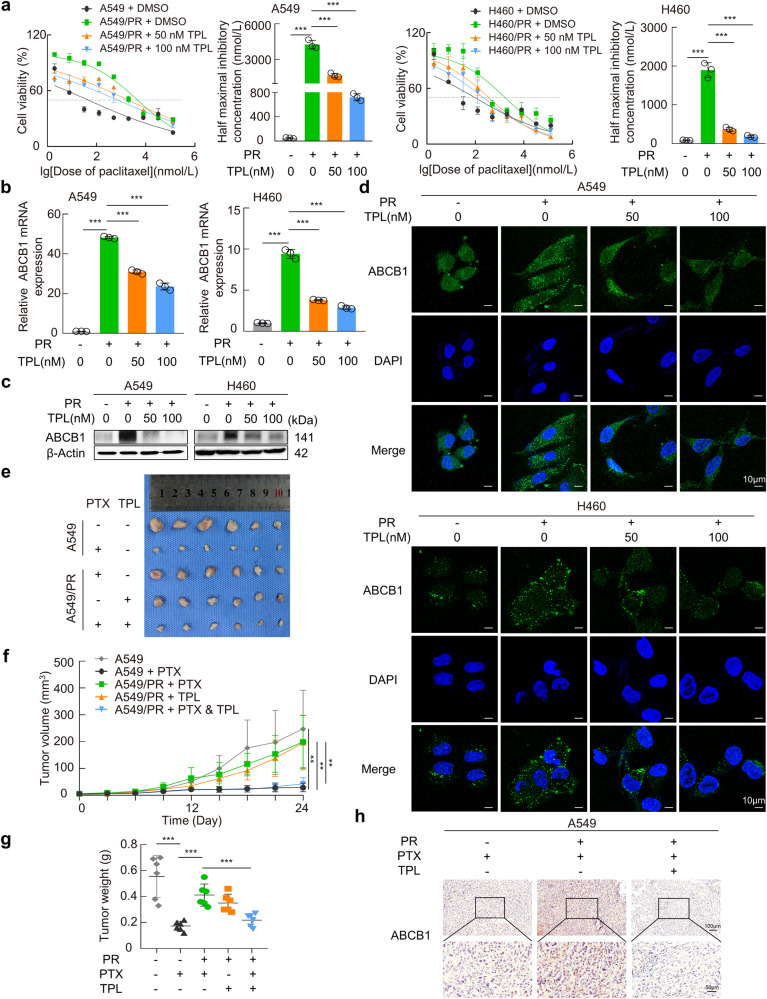
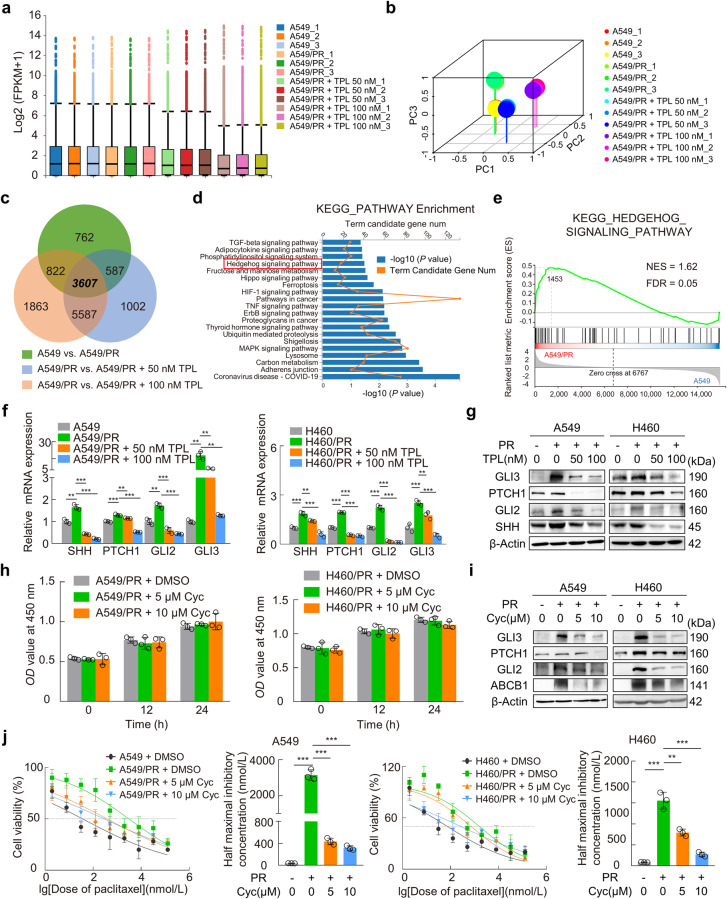
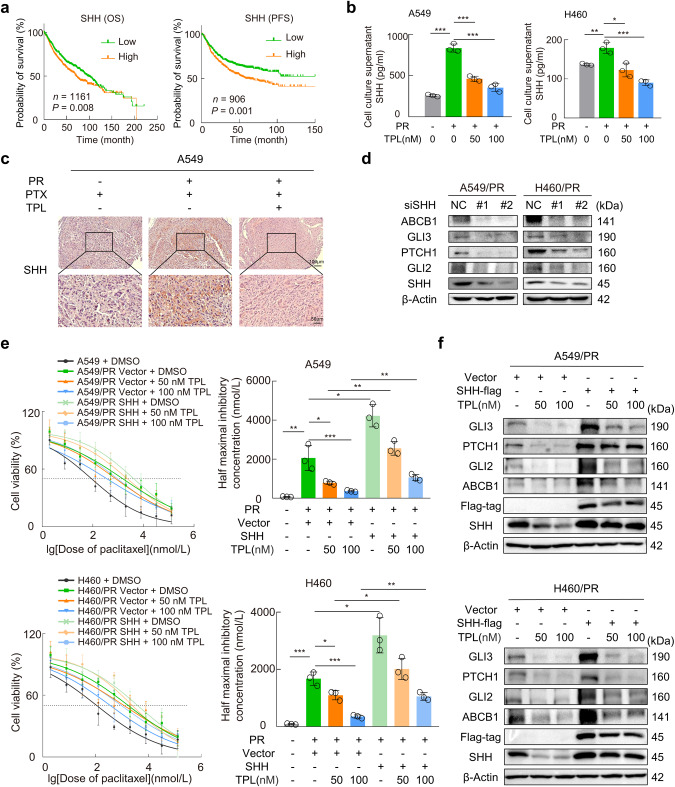
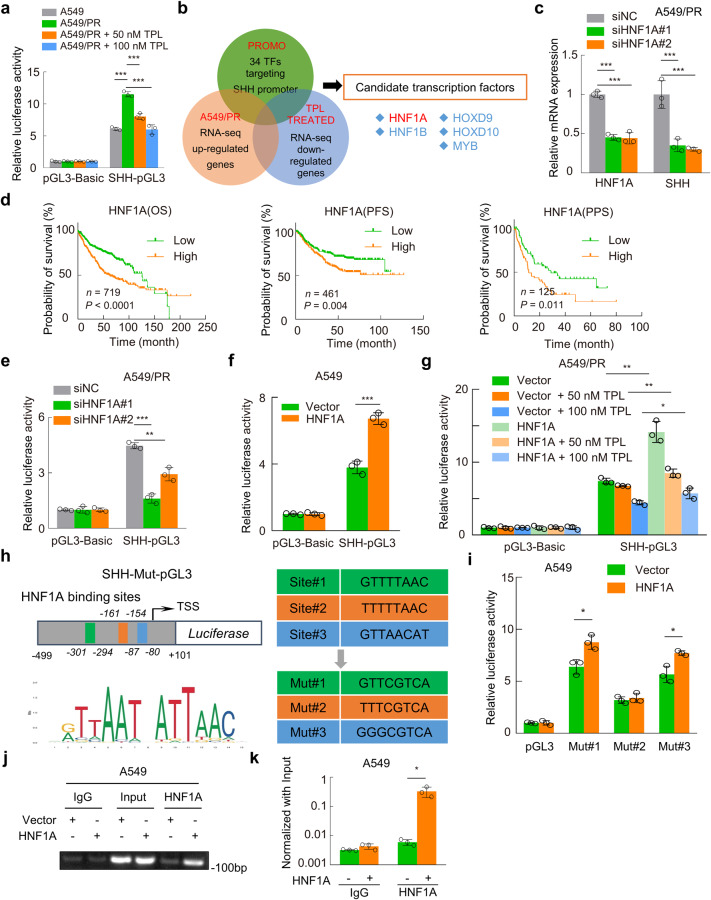
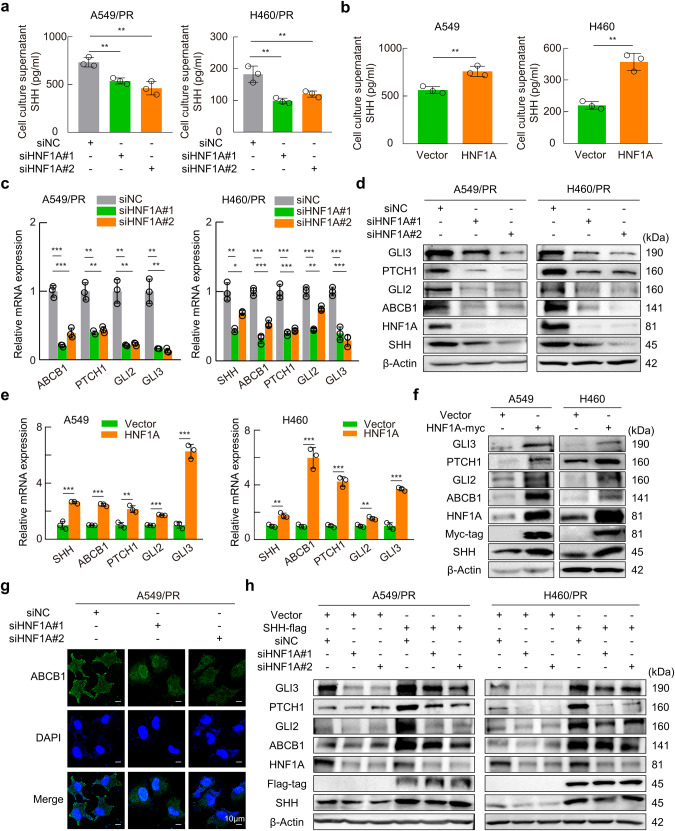
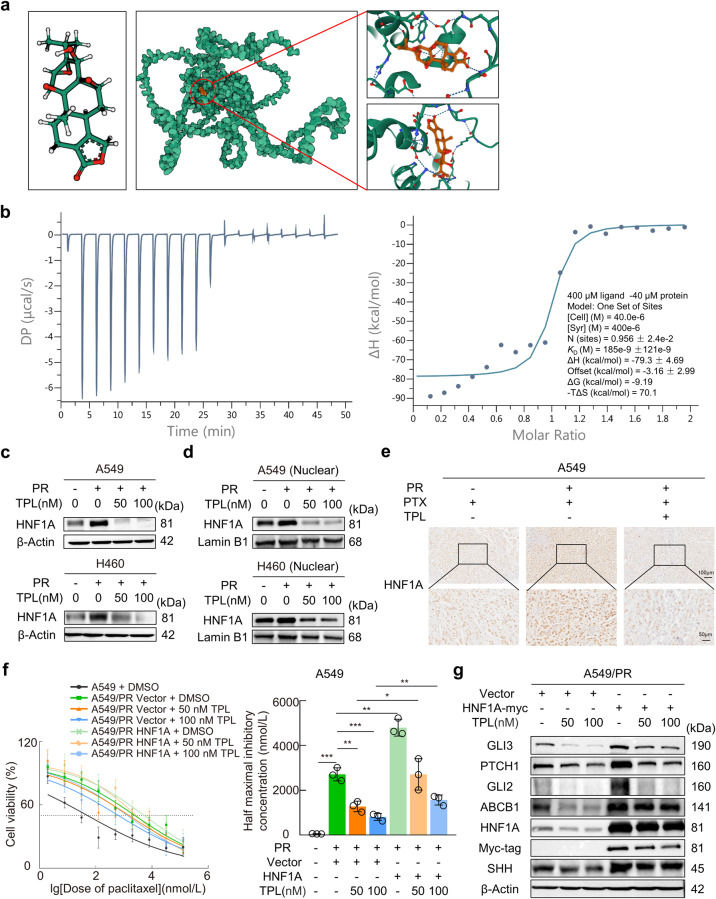
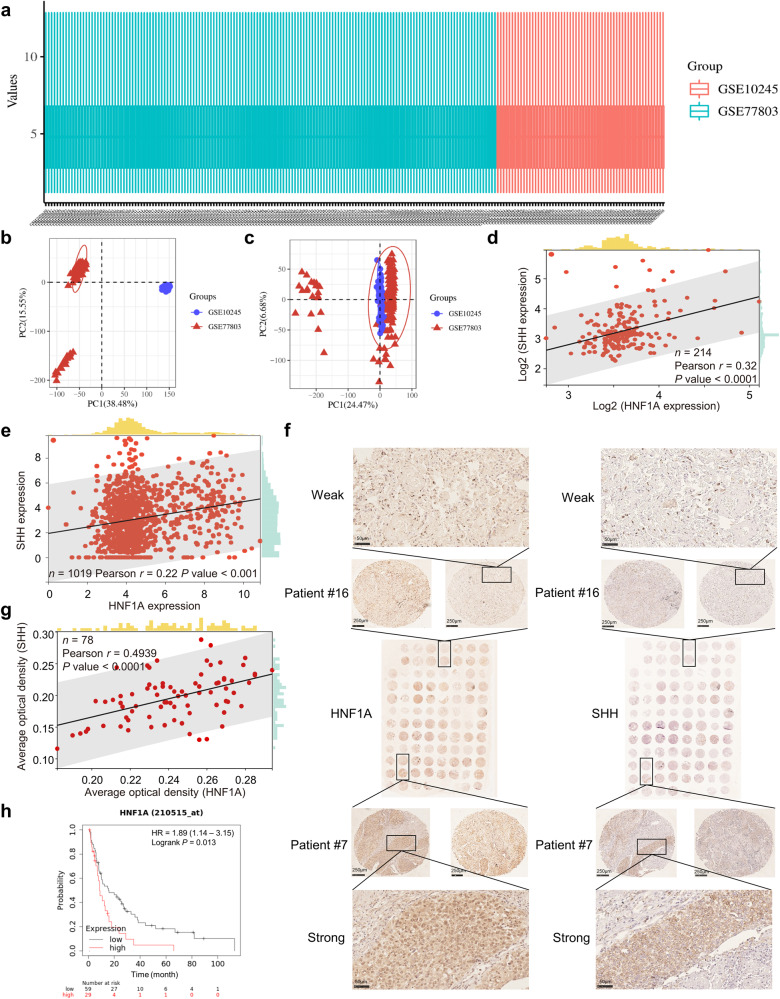
Paclitaxel resistance is associated with a poor prognosis in non-small cell lung cancer (NSCLC) patients, and currently, there is no promising drug for paclitaxel resistance. In this study, we investigated the molecular mechanisms underlying the chemoresistance in human NSCLC-derived cell lines. We constructed paclitaxel-resistant NSCLC cell lines (A549/PR and H460/PR) by long-term exposure to paclitaxel. We found that triptolide, a diterpenoid epoxide isolated from the Chinese medicinal herb Tripterygium wilfordii Hook F, effectively enhanced the sensitivity of paclitaxel-resistant cells to paclitaxel by reducing ABCB1 expression in vivo and in vitro. Through high-throughput sequencing, we identified the SHH-initiated Hedgehog signaling pathway playing an important role in this process. We demonstrated that triptolide directly bound to HNF1A, one of the transcription factors of SHH, and inhibited HNF1A/SHH expression, ensuing in attenuation of Hedgehog signaling. In NSCLC tumor tissue microarrays and cancer network databases, we found a positive correlation between HNF1A and SHH expression. Our results illuminate a novel molecular mechanism through which triptolide targets and inhibits HNF1A, thereby impeding the activation of the Hedgehog signaling pathway and reducing the expression of ABCB1. This study suggests the potential clinical application of triptolide and provides promising prospects in targeting the HNF1A/SHH pathway as a therapeutic strategy for NSCLC patients with paclitaxel resistance. Schematic diagram showing that triptolide overcomes paclitaxel resistance by mediating inhibition of the HNF1A/SHH/ABCB1 axis.

Keywords: ABCB1; HNF1A; Sonic Hedgehog; non-small cell lung cancer; paclitaxel resistance; triptolide.


Conflict of interest statement

The authors declare no competing interests.

Figures

None
Schematic diagram showing that triptolide overcomes paclitaxel resistance by mediating inhibition of the HNF1A/SHH/ABCB1 axis.
Fig. 1
Fig. 1. Establishment of paclitaxel-resistant cell lines (A549/PR and H460/PR).
a Diagrams show the treatment of parental A549 and H460 cells with gradients of paclitaxel to produce A549/PR and H460/PR cells. b Cell viability was detected by the CCK-8 method, and the dose–response curves of paclitaxel in parental and resistant cells were plotted. The IC50 value was calculated according to the fitting curves. c, d Results of RT‒qPCR and Western blotting of LRP, ABCB1, ABCC1, and ABCG2 in parental and paclitaxel-resistant cells. e Immunofluorescence staining detected ABCB1 expression in the parental and resistant groups. f Protein expression was assessed using a Western blot assay following knockdown of ABCB1. g The cell viability was assessed, and a dose–response curve of paclitaxel in ABCB1 knockdown resistant cells was constructed. The IC50 values were determined based on the fitted curves. Data are presented as the mean ± SD, *P < 0.05, **P < 0.01, ***P < 0.001. PR paclitaxel resistance.
Fig. 2
Fig. 2. Triptolide reverses paclitaxel resistance in NSCLC via downregulation of ABCB1.
a Plotting and evaluation of the dose–response curves of paclitaxel in cells after 24 h of triptolide cotreatment. The IC50 of paclitaxel after combined triptolide treatment was calculated based on the fitted curves. b, c ABCB1 expression levels were evaluated by RT‒qPCR and Western blotting in different treatment groups. d Confocal immunofluorescence staining showed changes in ABCB1 protein around the time of triptolide treatment. e Subcutaneous xenograft tumors derived from parental and resistant cells under different treatments. f Growth curve of subcutaneous xenograft tumors. g Tumor weight of subcutaneous xenografts. h IHC staining was applied to detect ABCB1 protein levels in tumor sections from xenograft models of different treatment groups. Data are presented as the mean ± SD, **P < 0.01, ***P < 0.001. TPL triptolide, PR paclitaxel resistance.
Fig. 3
Fig. 3. Triptolide reverses cellular resistance to paclitaxel by inhibiting the Hedgehog pathway.
a Box plots showing the distribution of gene expression levels for each group in the sequencing data. b 3D-plot of principal component analysis (PCA) analysis of different treatment groups. c Overlapping DEGs from the three comparisons were shown in the Venn diagram according to the RNA-seq data. d Representative terms from KEGG pathway enrichment analysis based on the overlapping DEGs. e GSEA was performed in KEGG Hedgehog signaling pathway gene sets. f, g RT‒qPCR and Western blotting verified the expression levels of SHH, PTCH1, GLI2, and GLI3 in the indicated cells with or without triptolide treatment. h A549/PR and H460/PR cells were treated with cyclopamine (5 or 10 μM) for 24 h. A CCK-8 assay was applied to quantify cell viability. i Western blotting was used to detect the protein levels of the indicated genes in cyclopamine-treated paclitaxel-resistant cells. j Dose–response curves of paclitaxel in cyclopamine-treated resistant cells were plotted based on CCK-8 assays. Histograms revealed the IC50 value calculated from the fitted curves. Data are indicated as the mean ± SD, **P < 0.01, ***P < 0.001. TPL triptolide, Cyc cyclopamine, PR paclitaxel resistance.
Fig. 4
Fig. 4. SHH plays a crucial role in the triptolide-induced reversal of paclitaxel resistance.
a Kaplan–Meier plot of LUAD patient OS and PFS stratified by SHH expression status. b ELISA was used to detect the concentration of SHH in the cell supernatants of different groups. c Representative images of SHH immunohistochemical staining from tumor slides in different treatment groups of mice. d Western blotting was used to detect the expression levels of the indicated proteins after SHH knockdown. e Dose–response curves of paclitaxel in SHH-overexpressing A549/PR cells with or without triptolide were determined. The histogram showed the estimated IC50 values based on the fitting curves. f A549/PR or H460/PR cells were transfected with SHH-overexpressing plasmids followed by triptolide treatments for 24 h. Western blotting was applied to detect the expression levels of the indicated proteins. Data are indicated as the mean ± SD, *P < 0.05, **P < 0.01, ***P < 0.001. TPL triptolide, PR paclitaxel resistance, OS overall survival, PFS progression-free survival.
Fig. 5
Fig. 5. HNF1A acts as a transcription factor that binds directly to the SHH promoter region.
a The dual-luciferase reporter assay was used to detect the luciferase activity of different groups after transfection for 48 h. b Venn diagram showing five shared genes among the three indicated groups. c RT‒qPCR was performed to detect the expression levels of HNF1A and SHH mRNA in different groups. d Kaplan–Meier curves showing the OS, PFS, and PPS among LUAD patients in the TCGA database stratified by HNF1A expression. e, f Detection of SHH-pGL3 promoter luciferase activity in HNF1A-knockdown A549/PR cells and HNF1A-overexpressing A549 cells. g Luciferase activity was measured at 48 h post transfection and 24 h after triptolide treatment. h The schematic diagram showed the promoter region of SHH (−499 to +101 bp), and motif analysis of the HNF1A binding element was performed. Mutant (Mut) promoter sequences were designed for insertion into the luciferase vector (pGL3-Basic) based on the predicted binding site sequence. i Detection of mutant promoter activity in HNF1A-overexpressing A549 cells using dual-luciferase reporter assays. j ChIP assays were performed using a specific HNF1A or IgG antibody. The results were semi-quantified by agarose gel electrophoresis. k Quantitative analysis of ChIP results using real-time qPCR. Data are presented as the mean ± SD, *P < 0.05, **P < 0.01, ***P < 0.001. TPL triptolide, OS overall survival, PFS progression-free survival, PPS post-progression survival.
Fig. 6
Fig. 6. HNF1A regulates the SHH signaling pathway and ABCB1 expression.
a, b ELISAs were used to detect the concentration of SHH in the supernatant of HNF1A-knockdown and -overexpression cells. c, d RT‒qPCR and Western blotting were used to detect the mRNA and protein levels of the indicated genes after HNF1A knockdown. e, f Total RNA and protein were isolated from cells transfected with HNF1A-expressing plasmid. RT‒qPCR and Western blotting were used to evaluate the expression levels of the indicated genes. g Immunofluorescence was used to assess the location and abundance of ABCB1 protein in HNF1A-knockdown A549/PR cells. h Western blot analysis of the effect of HNF1A knockdown on the Hedgehog pathway and ABCB1 protein expression in SHH-overexpressing cells. Data are presented as the mean ± SD, *P < 0.05, **P < 0.01, ***P < 0.001. TPL triptolide, PR paclitaxel resistance.
Fig. 7
Fig. 7. Targeted inhibition of HNF1A by triptolide reverses paclitaxel resistance.
a Chemical structure of triptolide (left), binding mode of triptolide to HNF1A (middle), 3D binding structures of triptolide and HNF1A magnified from various angles (right). White is hydrogen, green is carbon, red is oxygen, and blue is nitrogen. The dotted lines indicated the forces of interaction of the small molecules with the protein structure. b Isothermal titration calorimetry revealed the binding of HNF1A ligand-binding domain protein to triptolide. c Western blotting indicated HNF1A expression levels in each treatment group. d Western blotting was performed to detect the protein expression of HNF1A in the nucleus. Lamin B1 was used as a control. e Immunohistochemical staining was applied to assess the location and expression level of HNF1A in tumor sections of xenograft models from different treatment groups. f CCK-8 cell viability assays revealed dose–response curves for paclitaxel and IC50 values calculated in HNF1A-overexpressing paclitaxel-resistant cells treated with different doses of triptolide. g Western blot showing the expression levels of the indicated proteins in HNF1A-overexpressing A549/PR cells treated with triptolide. Data are presented as the mean ± SD, *P < 0.05, **P < 0.01, ***P < 0.001. PR paclitaxel resistance, TPL triptolide.
Fig. 8
Fig. 8. SHH expression in clinical tissue samples is positively correlated with HNF1A.
a Different colors represented box plots of the data normalized for different GEO NSCLC data sets. b The PCA results before batch removal showed two separate data sets without any intersection. c The PCA results after batch removal showed that some data intersected together for subsequent analysis. d Results of two gene correlation analyses in the intersecting data. e Results of correlation analysis of two genes in the TCGA NSCLC dataset. f IHC staining for HNF1A and SHH was performed on two independent tumor microarrays (TMA1 and TMA2). Images of representative cases with strong or weak expression of HNF1A and SHH in TMA1 were enlarged in the figure. g Correlation analysis of the average optical density values of IHC staining for two genes in TMA1 and TMA2. Damaged samples were not considered for scoring. h Kaplan–Meier plot of post-progression survival in NSCLC patients receiving chemotherapy stratified by HNF1A expression status.

References

    1. Siegel RL, Miller KD, Fuchs HE, Jemal A. Cancer statistics, 2022. CA Cancer J Clin. 2022;72:7–33. doi: 10.3322/caac.21708. - DOI - PubMed
    1. Xia C, Dong X, Li H, Cao M, Sun D, He S, et al. Cancer statistics in China and United States, 2022: profiles, trends, and determinants. Chin Med J (Engl) 2022;135:584–90. doi: 10.1097/CM9.0000000000002108. - DOI - PMC - PubMed
    1. Herbst RS, Morgensztern D, Boshoff C. The biology and management of non-small cell lung cancer. Nature. 2018;553:446–54. doi: 10.1038/nature25183. - DOI - PubMed
    1. Rodak O, Peris-Diaz MD, Olbromski M, Podhorska-Okolow M, Dziegiel P. Current landscape of non-small cell lung cancer: epidemiology, histological classification, targeted therapies, and immunotherapy. Cancers (Basel). 2021;13:4705. - PMC - PubMed
    1. Berghmans T, Durieux V, Hendriks LEL, Dingemans AM. Immunotherapy: from advanced NSCLC to early stages, an evolving concept. Front Med (Lausanne) 2020;7:90. doi: 10.3389/fmed.2020.00090. - DOI - PMC - PubMed

MeSH terms