. 2024 Jan 17;31(1):8.
doi: 10.1186/s12929-024-00995-x.

Attenuation of neurovirulence of chikungunya virus by a single amino acid mutation in viral E2 envelope protein

Affiliations

Attenuation of neurovirulence of chikungunya virus by a single amino acid mutation in viral E2 envelope protein

Huixin Chen et al. J Biomed Sci. .

Abstract

Background: Chikungunya virus (CHIKV) has reemerged as a major public health concern, causing chikungunya fever with increasing cases and neurological complications.

Methods: In the present study, we investigated a low-passage human isolate of the East/ Central/South African (ECSA) lineage of CHIKV strain LK(EH)CH6708, which exhibited a mix of small and large viral plaques. The small and large plaque variants were isolated and designated as CHIKV-SP and CHIKV-BP, respectively. CHIKV-SP and CHIKV-BP were characterized in vitro and in vivo to compare their virus production and virulence. Additionally, whole viral genome analysis and reverse genetics were employed to identify genomic virulence factors.

Results: CHIKV-SP demonstrated lower virus production in mammalian cells and attenuated virulence in a murine model. On the other hand, CHIKV-BP induced higher pro-inflammatory cytokine levels, compromised the integrity of the blood-brain barrier, and led to astrocyte infection in mouse brains. Furthermore, the CHIKV-SP variant had limited transmission potential in Aedes albopictus mosquitoes, likely due to restricted dissemination. Whole viral genome analysis revealed multiple genetic mutations in the CHIKV-SP variant, including a Glycine (G) to Arginine (R) mutation at position 55 in the viral E2 glycoprotein. Reverse genetics experiments confirmed that the E2-G55R mutation alone was sufficient to reduce virus production in vitro and virulence in mice.

Conclusions: These findings highlight the attenuating effects of the E2-G55R mutation on CHIKV pathogenicity and neurovirulence and emphasize the importance of monitoring this mutation in natural infections.

Keywords: Attenuation; Chikungunya virus; Neurovirulence; Pathogenesis; Plaque size.


Conflict of interest statement

The authors declare that they have no competing interests.

Figures

Fig. 1
Fig. 1
Viral plaque morphologies and replication kinetics of CHIKV variants. A Plaque morphologies of the LK(EH)CH6708 strain showing a mixed phenotype with both small and big plaques. Purified CHIKV-SP (B) and CHIKV-BP (C) variants displayed uniform small plaque and big plaque phenotypes, respectively. Replication kinetics of CHIKV-SP and CHIKV-BP variants were assessed in D C6/36 cells, E BHK cells, and F HeLa cells. Each experiment was performed in triplicates, and the results are presented as mean ± SD. Statistical analysis using one-way ANOVA followed by Dunnett’s test was conducted to compare virus titres (*P < 0.05, **P < 0.01, ***P < 0.001)
Fig. 2
Fig. 2
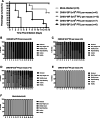
Comparison of virulence among various CHIKV variants in 6-day-old BALB/c mice model. A 6-day-old BALB/c mice were intraperitoneally inoculated with CHIKV-SP, CHIKV-BP, CHIKV-MP, or mock-infected. Survival was monitored daily for 14 days post-inoculation, and the data are presented as Kaplan–Meier survival curves. Statistical analysis using the Mantel-Cox test revealed significant differences (P < 0.05) between the survival curves of the CHIKV-infected groups compared to the mock-infected group. BF Daily assessments of the mice were conducted using a mouse clinical scoring system to evaluate the severity of clinical symptoms induced by CHIKV infection (Additional file 1: Table S1). GK 6-day-old BALB/c mice were infected with 5 × 105 PFU of CHIKV-SP or CHIKV-BP. At specific time points (6 h.p.i., 1 d.p.i., 2 d.p.i., 3 d.p.i., 4 d.p.i., and 5 d.p.i.), serum, spleen, brain, liver, and limb tissues were collected from a group of 3 to 4 mice per group. The collected tissue samples were homogenized, and the supernatant was used for quantifying the amount of infectious virus particles of CHIKV-BP and CHIKV-SP using viral plaque assay. The dashed line in the figure represents the Limit of Detection (LOD) of the viral plaque assay. The mean values along with individual data points are presented to illustrate the viremia and viral load dynamics in the different tissues over the course of infection
Fig. 2
Fig. 2
Comparison of virulence among various CHIKV variants in 6-day-old BALB/c mice model. A 6-day-old BALB/c mice were intraperitoneally inoculated with CHIKV-SP, CHIKV-BP, CHIKV-MP, or mock-infected. Survival was monitored daily for 14 days post-inoculation, and the data are presented as Kaplan–Meier survival curves. Statistical analysis using the Mantel-Cox test revealed significant differences (P < 0.05) between the survival curves of the CHIKV-infected groups compared to the mock-infected group. BF Daily assessments of the mice were conducted using a mouse clinical scoring system to evaluate the severity of clinical symptoms induced by CHIKV infection (Additional file 1: Table S1). GK 6-day-old BALB/c mice were infected with 5 × 105 PFU of CHIKV-SP or CHIKV-BP. At specific time points (6 h.p.i., 1 d.p.i., 2 d.p.i., 3 d.p.i., 4 d.p.i., and 5 d.p.i.), serum, spleen, brain, liver, and limb tissues were collected from a group of 3 to 4 mice per group. The collected tissue samples were homogenized, and the supernatant was used for quantifying the amount of infectious virus particles of CHIKV-BP and CHIKV-SP using viral plaque assay. The dashed line in the figure represents the Limit of Detection (LOD) of the viral plaque assay. The mean values along with individual data points are presented to illustrate the viremia and viral load dynamics in the different tissues over the course of infection
Fig. 3
Fig. 3
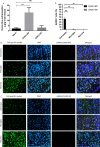
CHIKV-BP infection increases BBB permeability and selectively infect astrocytes in mouse brain. Mice were intraperitoneally injected with 4 μl/g of body weight of a 2% solution of Evans Blue in PBS at 2 d.p.i. and incubated for 3 h. A Quantification of Evans Blue dye incorporated into the brain was performed using spectrophotometry at 610 nm. The values represent mean ± SD (n = 6/group). Statistical analysis was conducted using Kruskal–Wallis test followed by Dunn's multiple comparisons post-test; ***p < 0.001; **p < 0.01; *p < 0.05. Brain slices from CHIKV-infected mice were subjected to double staining for dsRNA (CHIKV), the astrocyte marker GFAP, the microglia marker Iba1, and the neuron marker NeuN. B dsRNA-positive astrocytes were exclusively detected in CHIKV-BP-infected brains. C No dsRNA-positive brain cell were observed in CHIKV-SP-infected brains. Tissue sections were counterstained with DAPI. Single-channel and merged images of the same frames are presented (scale bar: 20 μm). D Comparative analysis of percentage (%) of dsRNA + brain cells
Fig. 4
Fig. 4
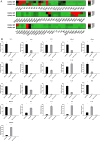
Analysis of mouse cytokine gene expression. A Heatmap illustrating the expression of mouse cytokine genes at 2 days post-inoculation with CHIKV-SP (n = 6) or CHIKV-BP (n = 6). High and low gene expression levels are depicted in red and green, respectively. B Cytokines showing significant upregulation in their expressions (≥ twofold change, P < 0.05) in CHIKV-BP or CHIKV-SP-infected mice compared to the mock-infected group (n = 6). Data are presented as mean ± SEM, and statistically significant values are denoted as *P < 0.05, **P < 0.01, ***P < 0.001 (Mann–Whitney U-test). Multiple comparison tests were performed for each group of genes and adjusted against the mock-infected group
Fig. 5
Fig. 5
Infection rate, dissemination rate, and salivary gland infection rate of CHIKV-BP and CHIKV-SP in mosquitoes. Mosquitoes were blood-fed with CHIKV-BP or CHIKV-SP viruses at a titre of 107 PFU/mL. The presence of the virus was analyzed in the bodies (as an indicator of the infection rate), legs (as an indicator of the dissemination rate), and salivary glands (indicative of the salivary gland infection rate) at 7 d.p.i. A The infection rate was calculated as the percentage of infected mosquitoes divided by the total number of mosquitoes examined. B The dissemination rate was determined by scoring the number of infected mosquitoes with infected legs out of the total number of infected mosquitoes. C The salivary gland infection rate was measured as the ratio of mosquito with detectable virus in salivary glands to the number of infected mosquitoes. The bars represent the cumulative data for infection, dissemination, and salivary gland infection rates from a sample size of n = 30 mosquitoes. Statistical analysis was performed using Fisher's exact test. (DF) Demonstrates the mean ± SEM tires of CHIKV-BP and CHIKV-SP in the body, legs, and salivary glands of mosquitoes examined
Fig. 6
Fig. 6
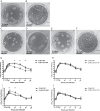
Characterization of infectious clone-derived and mutant viruses. A CHIKV-BP infectious clone-derived virus exhibited large plaques (2.03 ± 0.15 mm). B CHIKV-SP infectious clone-derived virus exhibited small plaques (0.36 ± 0.09 mm). C CHIKV-m1 clone-derived virus exhibited small plaques (0.38 ± 0.09 mm). D CHIKV-m2 clone-derived virus exhibited large plaques (2.08 ± 0.16 mm). E CHIKV-m3 clone-derived virus exhibited large plaques (2.11 ± 0.17 mm). F CHIKV-m4 clone-derived virus exhibited small plaques (0.35 ± 0.08 mm). HeLa cells were infected with each variant of CHIKV at a M.O.I. of 1. The supernatant was collected at various time points post-infection, and infectious virus particles were quantified using a standard viral plaque assay. G Replication kinetics of CHIKV-E2-55R (m1) and the parental variant CHIKV-BP. H Replication kinetics of CHIKV-nsP3-471P (m3) and the parental variant CHIKV-BP. I Replication kinetics of CHIKV- E2-55G (m2) and the parental variant CHIKV-SP. J Replication kinetics of CHIKV- nsP3-471S (m4) and the parental variant CHIKV-SP. Each experiment was performed in triplicates, and the mean ± SD are shown. Statistical analysis was conducted using one-way ANOVA followed by Dunnett’s test to compare virus titres (*P < 0.05, **P < 0.01, ***P < 0.001). K 6-day-old BALB/c mice were intraperitoneally inoculated with each of the clone-derived viruses (CHIKV-BP, -SP, -m1, -m2, -m3, and -m4). Survival was monitored daily for 14 d.p.i., and the data were presented as Kaplan-Meier survival curves. Statistical analysis was performed using the Kaplan-Meier method with a Mantel-Cox test. LP At 2 d.p.i., serum, spleen, brain, liver, and limb tissues (n = 3 mice per group) were harvested. The amount of infectious virus particles in these tissues was quantified using a viral plaque assay. The mean values along with individual data points are shown
Fig. 6
Fig. 6
Characterization of infectious clone-derived and mutant viruses. A CHIKV-BP infectious clone-derived virus exhibited large plaques (2.03 ± 0.15 mm). B CHIKV-SP infectious clone-derived virus exhibited small plaques (0.36 ± 0.09 mm). C CHIKV-m1 clone-derived virus exhibited small plaques (0.38 ± 0.09 mm). D CHIKV-m2 clone-derived virus exhibited large plaques (2.08 ± 0.16 mm). E CHIKV-m3 clone-derived virus exhibited large plaques (2.11 ± 0.17 mm). F CHIKV-m4 clone-derived virus exhibited small plaques (0.35 ± 0.08 mm). HeLa cells were infected with each variant of CHIKV at a M.O.I. of 1. The supernatant was collected at various time points post-infection, and infectious virus particles were quantified using a standard viral plaque assay. G Replication kinetics of CHIKV-E2-55R (m1) and the parental variant CHIKV-BP. H Replication kinetics of CHIKV-nsP3-471P (m3) and the parental variant CHIKV-BP. I Replication kinetics of CHIKV- E2-55G (m2) and the parental variant CHIKV-SP. J Replication kinetics of CHIKV- nsP3-471S (m4) and the parental variant CHIKV-SP. Each experiment was performed in triplicates, and the mean ± SD are shown. Statistical analysis was conducted using one-way ANOVA followed by Dunnett’s test to compare virus titres (*P < 0.05, **P < 0.01, ***P < 0.001). K 6-day-old BALB/c mice were intraperitoneally inoculated with each of the clone-derived viruses (CHIKV-BP, -SP, -m1, -m2, -m3, and -m4). Survival was monitored daily for 14 d.p.i., and the data were presented as Kaplan-Meier survival curves. Statistical analysis was performed using the Kaplan-Meier method with a Mantel-Cox test. LP At 2 d.p.i., serum, spleen, brain, liver, and limb tissues (n = 3 mice per group) were harvested. The amount of infectious virus particles in these tissues was quantified using a viral plaque assay. The mean values along with individual data points are shown

References

    1. Weaver SC, Forrester NL. Chikungunya: evolutionary history and recent epidemic spread. Antiviral Res. 2015;120:32–39. doi: 10.1016/j.antiviral.2015.04.016. - DOI - PubMed
    1. Rupp JC, Sokoloski KJ, Gebhart NN, et al. Alphavirus RNA synthesis and non-structural protein functions. J Gen Virol. 2015;96(9):2483–2500. doi: 10.1099/jgv.0.000249. - DOI - PMC - PubMed
    1. Fitzsimmons WJ, Woods RJ, McCrone JT, et al. A speed-fidelity trade-off determines the mutation rate and virulence of an RNA virus. PLoS Biol. 2018;16(6):e2006459. doi: 10.1371/journal.pbio.2006459. - DOI - PMC - PubMed
    1. Solignat M, Gay B, Higgs S, et al. Replication cycle of chikungunya: a re-emerging arbovirus. Virology. 2009;393(2):183–197. doi: 10.1016/j.virol.2009.07.024. - DOI - PMC - PubMed
    1. Metz SW, Pijlman GP. Production of Chikungunya virus-like particles and subunit vaccines in insect cells. Methods Mol Biol. 2016;1426:297–309. doi: 10.1007/978-1-4939-3618-2_27. - DOI - PubMed

Supplementary concepts