. 2024 Jan 16;22(1):63.
doi: 10.1186/s12967-024-04881-w.

MicroRNA-218-5p-Ddx41 axis restrains microglia-mediated neuroinflammation through downregulating type I interferon response in a mouse model of Parkinson's disease

Affiliations

MicroRNA-218-5p-Ddx41 axis restrains microglia-mediated neuroinflammation through downregulating type I interferon response in a mouse model of Parkinson's disease

Danlei Wang et al. J Transl Med. .

Abstract

Background: Parkinson's disease (PD) is a neurodegenerative disorder characterized by the loss of dopaminergic (DA) neurons in the substantia nigra (SN). Microglia-mediated neuroinflammation has been largely considered one of main factors to the PD pathology. MicroRNA-218-5p (miR-218-5p) is a microRNA that plays a role in neurodevelopment and function, while its potential function in PD and neuroinflammation remains unclear.

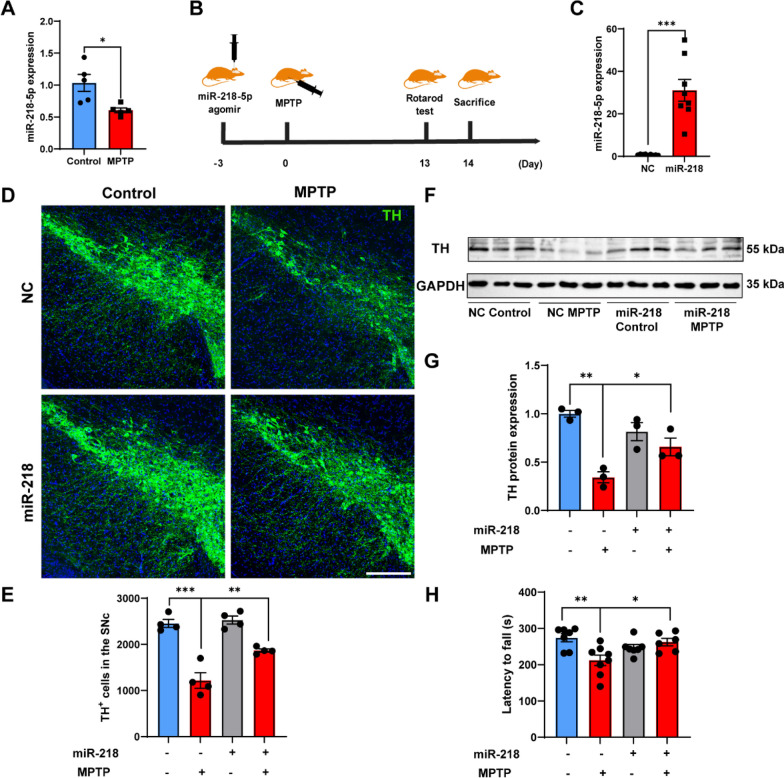
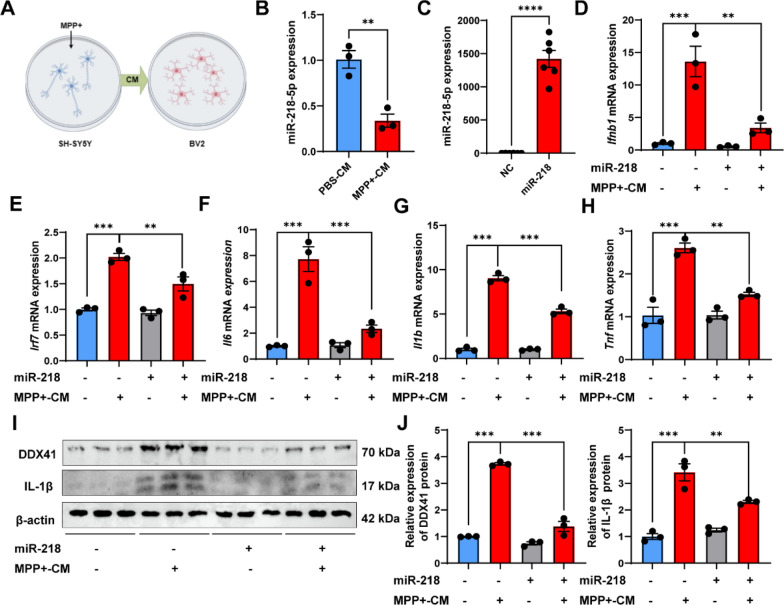
Methods: We explore the involvement of miR-218-5p in the PD in a 1-methyl-4-phenyl-1,2,3,6-tetrahydropyridine (MPTP)-induced mouse model. The miR-218-5p agomir used for overexpression was delivered into the substantia nigra (SN) by bilateral stereotaxic infusions. The loss of dopaminergic (DA) neurons and microglial inflammation in the SN was determined using Western blotting and immunofluorescence. Motor function was assessed using the rotarod test. RNA sequencing (RNA-seq) was performed to explore the pathways regulated by miR-218-5p. The target genes of miR-218-5p were predicted using TargetScan and confirmed using dual luciferase reporter assays. The effects of miR-218-5p on microglial inflammation and related pathways were verified in murine microglia-like BV2 cells. To stimulate BV2 cells, SH-SY5Y cells were treated with 1-methyl-4-phenylpyridinium (MPP+) and the conditioned media (CM) were collected.

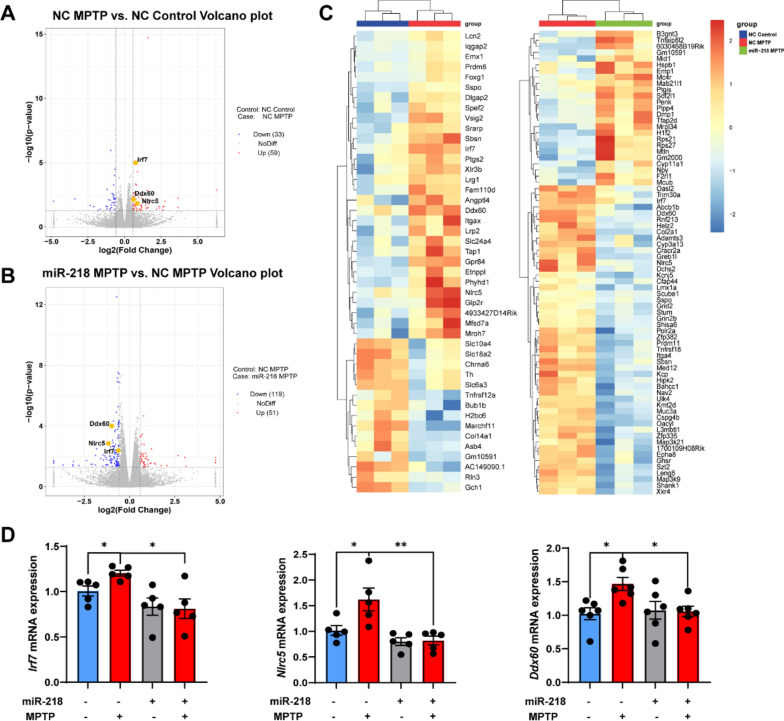
Results: MiR-218-5p expression was reduced in both the SN of MPTP-induced mice and MPP+-treated BV2 cells. MiR-218-5p overexpression significantly alleviated MPTP-induced microglial inflammation, loss of DA neurons, and motor dysfunction. RNA sequence and gene set enrichment analysis showed that type I interferon (IFN-I) pathways were upregulated in MPTP-induced mice, while this upregulation was reversed by miR-218-5p overexpression. A luciferase reporter assay verified that Ddx41 was a target gene of miR-218-5p. In vitro, miR-218-5p overexpression or Ddx41 knockdown inhibited the IFN-I response and expression of inflammatory cytokines in BV2 cells stimulated with MPP+-CM.

Conclusions: MiR-218-5p suppresses microglia-mediated neuroinflammation and preserves DA neurons via Ddx41/IFN-I. Hence, miR-218-5p-Ddx41 is a promising therapeutic target for PD.

Keywords: DEAD-box helicase 41; Interferon; Microglia; Neuroinflammation; Parkinson’s disease; miR-218-5p.


Conflict of interest statement

The authors declare that they have no competing interests.

Figures

Fig. 1
Fig. 1
miR-218-5p overexpression alleviates the loss of dopaminergic neurons and motor deficits in MPTP-induced mice. A miR-218-5p expression in the SN of Control and MPTP mice 14 days post MPTP administration is shown by qPCR analysis. N = 5 per group. B A schematic diagram of constructing a miR-218-5p-overexpressing-MPTP mice model. C Effective miR-218-5p overexpression in the SN of mice 17 days post miR-218-5p agomir injection was verified by qPCR analysis. miR-218, mice injected with miR-218-5p agomir. NC, mice injected with NC agomir. N = 8–9 per group. D, E Representative confocal images staining of TH in the SN (D) and quantification of TH+ cells (E) of NC Control, NC MPTP, miR-218 Control and miR-218 MPTP mice. Scale bar, 250 μm. N = 3–4 per group. F, G TH expression in the SN by western blot (F) and quantitative analysis (G) of NC Control, NC MPTP, miR-218 Control and miR-218 MPTP mice. N = 3 per group. H Quantification of latency to fall in the accelerating Rotarod test of NC Control, NC MPTP, miR-218 Control and miR-218 MPTP mice 13 days post MPTP administration. N = 6–8 per group. Data are shown as the mean ± SEM. Significance in A, C was tested by two-tailed unpaired Student’s t-test. Significance in EH was tested by two-way ANOVA. *p < 0.05, **p < 0.01, ***p < 0.001
Fig. 2
Fig. 2
miR-218-5p overexpression inhibits microglial inflammatory and IFN-I responses in the SN in MPTP-induced mice. A Representative confocal images and 3D reconstructed images staining of IBA1 (red) and CD68 (green) in the SN of NC Control, NC MPTP, miR-218 Control and miR-218 MPTP mice. Scale bar, 25 μm. B Quantification of IBA1+ cells, IBA1+ cell volume and the ratio of CD68+IBA1+ puncta volume to IBA1+ cell volume in the SN of NC Control, NC MPTP, miR-218 Control and miR-218 MPTP mice. N = 4 per group. C Representative confocal images staining of IBA1 (red) and IRF7 (green) in the SN of NC Control, NC MPTP, miR-218 Control and miR-218 MPTP mice. Scale bar, 25 μm. D Quantification of the average intensity of IRF7 protein in IBA1+ cells in the SN of NC Control, NC MPTP, miR-218 Control and miR-218 MPTP mice. Data are shown as the mean ± SEM. Significance was tested by two-way ANOVA. *p < 0.05, **p < 0.01, ***p < 0.001
Fig. 3
Fig. 3
miR-218-5p overexpression inhibits the expression of IFN-I response related genes in the SN of MPTP-induced mice. A, B Volcano plots showing the DEGs in NC MPTP mice versus NC Control mice (A) and the DEGs in miR-218 MPTP mice versus NC MPTP mice (B). N = 3 per group. Data are shown as |Log2 (fold change)|≥ 0.585, p-value < 0.05. C Pheatmaps showing the top DEGs in NC MPTP mice versus NC Control mice and the top DEGs in miR-218 MPTP mice versus miR-218 Control mice. D qPCR analysis showing mRNA expression of several IFN-I related genes (Irf7, Nlrc5, Ddx60) in the SN of NC Control, NC MPTP, miR-218 Control and miR-218 MPTP mice. N = 5–6 per group. Data are shown as the mean ± SEM. Significance was tested by two-way ANOVA. *p < 0.05, **p < 0.01
Fig. 4
Fig. 4
Top GO enrichment terms in GSEA of NC Control, NC MPTP, miR-218 Control and miR-218 MPTP mice. A Top GO enrichment terms are shown in GSEA of NC MPTP mice versus NC Control mice. B Top GO enrichment terms are shown in GSEA of miR-218 MPTP mice versus NC MPTP mice. C Several IFN-I responses terms are shown in GSEA of NC MPTP mice versus NC Control mice and miR-218 MPTP mice versus NC MPTP mice. |NES|> 1, NOM p-value < 0.05, and FDR q-value < 0.25 are considered to be of interest
Fig. 5
Fig. 5
Ddx41 is a target gene of miR-218-5p. A The binding sites of mmu-miR-218-5p with Ddx41 3′UTR. B, C DDX41 expression in the SN by western blot (B) and quantitative analysis (C) of NC Control, NC MPTP, miR-218 Control and miR-218 MPTP mice. N = 3 per group. D PmirGLO vectors including wildtype (WT) or mutated (MUT) 3′UTR of Ddx41 were co-transfected with miR-218-5p mimic or mimic NC in HEK293T cells. Luciferase activity was measured. N = 4 per group. Data are shown as the mean ± SEM. Significance was tested by two-way ANOVA. *p < 0.05, **p < 0.01, ***p < 0.001
Fig. 6
Fig. 6
miR-218-5p overexpression suppresses IFN-I and inflammatory responses in BV2 cells treated with MPP + conditioned media. A A schematic diagram showing treatment of conditioned medium (CM) from MPP+ stimulated SH-SY5Y cells into BV2 cells. B miR-218-5p expression in BV2 cells treated with PBS-conditioned media (PBS-CM) and MPP+-conditioned media (MPP+-CM) is shown by qPCR analysis. N = 3 per group. C Effective miR-218-5p overexpression in the BV2 cells transfected with miR-218-5p mimic was verified by qPCR analysis. N = 6 per group. DH Ifnb1 (D), Irf7 (E), Il6 (F), Il1b (G) and Tnf (H) mRNA expression in BV2 cells transfected with miR-218-5p mimic and stimulated with or without MPP+-CM is shown by qPCR analysis. N = 3 per group. I, J DDX41 and IL-1β protein levels in BV2 cells transfected with miR-218-5p mimic and stimulated with or without MPP+-CM by western blot (I) and quantitative analysis (J) are shown. N = 3 per group. Data are shown as the mean ± SEM, *p < 0.05, **p < 0.01, ***p < 0.001,****p < 0.0001
Fig. 7
Fig. 7
Ddx41 knockdown suppresses IFN-I and inflammatory responses in BV2 cells treated with MPP+ conditioned media. AE Ifnb1 (A), Irf7 (B), Il6 (C), Il1b (D) and Tnf (E) mRNA expression in BV2 cells transfected with Ddx41 siRNA and stimulated with or without MPP+-CM is shown by qPCR analysis. N = 3 per group. F, G DDX41 and IL-1β protein levels in BV2 cells transfected with Ddx41 siRNA and stimulated with or without MPP+-CM by western blot (F) and quantitative analysis (G) are shown. N = 3 per group. Data are shown as the mean ± SEM, *p < 0.05, **p < 0.01, ***p < 0.001

Similar articles

Cited by

References

    1. Postuma RB, Berg D, Stern M, Poewe W, Olanow CW, Oertel W, et al. MDS clinical diagnostic criteria for Parkinson's disease. Move Disord Off J Move Disord Soc. 2015;30(12):1591–1601. doi: 10.1002/mds.26424. - DOI - PubMed
    1. Schapira AHV, Chaudhuri KR, Jenner P. Non-motor features of Parkinson disease. Nat Rev Neurosci. 2017;18(7):435–450. doi: 10.1038/nrn.2017.62. - DOI - PubMed
    1. Kalia LV, Lang AE. Parkinson's disease. Lancet. 2015;386(9996):896–912. doi: 10.1016/S0140-6736(14)61393-3. - DOI - PubMed
    1. Bloem BR, Okun MS, Klein C. Parkinson's disease. Lancet. 2021;397(10291):2284–2303. doi: 10.1016/S0140-6736(21)00218-X. - DOI - PubMed
    1. Leng F, Edison P. Neuroinflammation and microglial activation in Alzheimer disease: where do we go from here? Nat Rev Neurol. 2021;17(3):157–172. doi: 10.1038/s41582-020-00435-y. - DOI - PubMed

Publication types