. 2024 Jan 12:17:279-299.
doi: 10.2147/JIR.S433057. eCollection 2024.

Analysis of Immune and Prognostic-Related lncRNA PRKCQ-AS1 for Predicting Prognosis and Regulating Effect in Sepsis

Affiliations

Analysis of Immune and Prognostic-Related lncRNA PRKCQ-AS1 for Predicting Prognosis and Regulating Effect in Sepsis

Xian Ding et al. J Inflamm Res. .

Abstract

Background: Sepsis was a high mortality and great harm systemic inflammatory response syndrome caused by infection. lncRNAs were potential prognostic marker and therapeutic target. Therefore, we expect to screen and analyze lncRNAs with potential prognostic markers in sepsis.

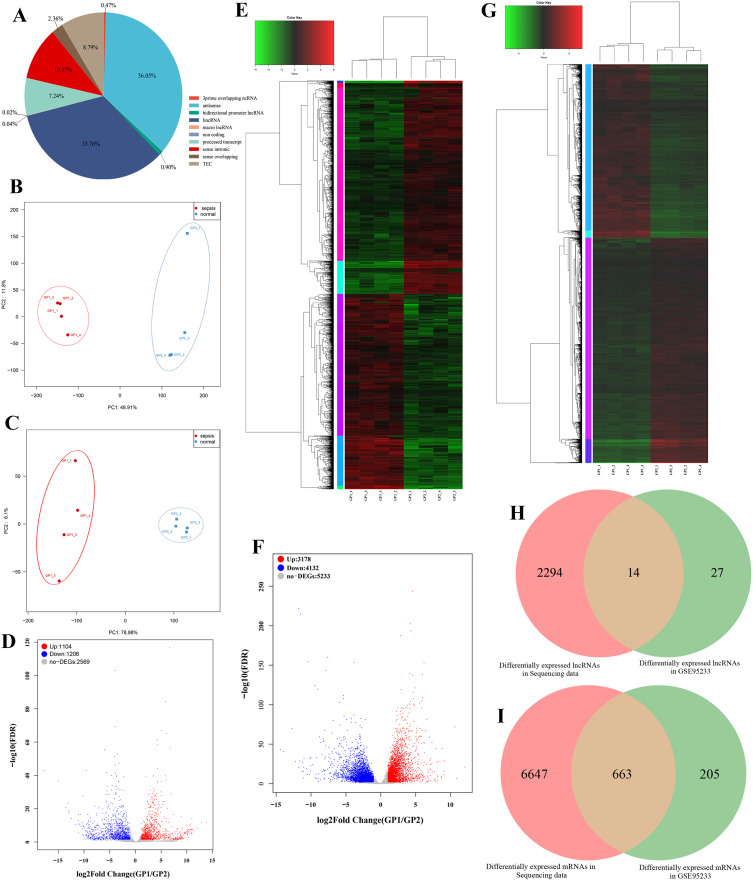
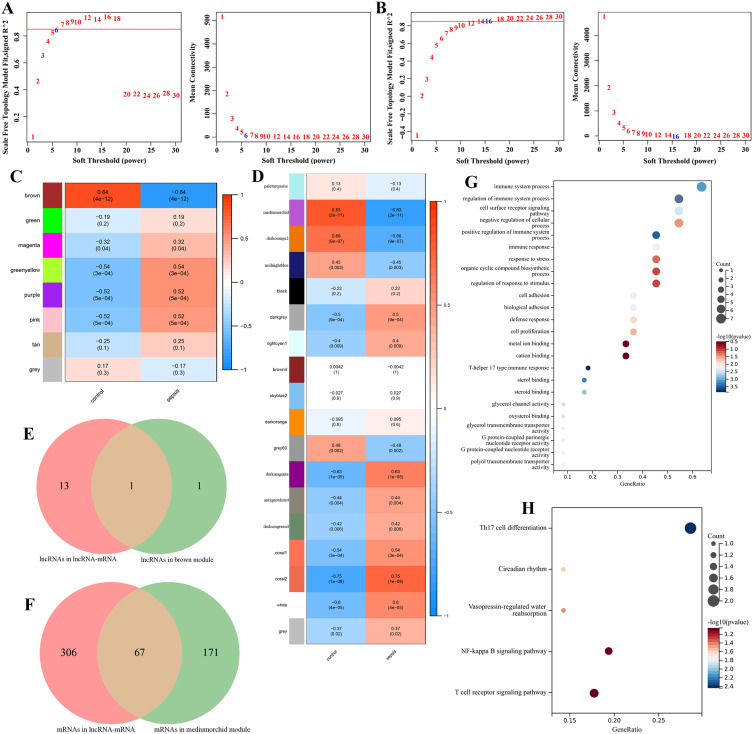
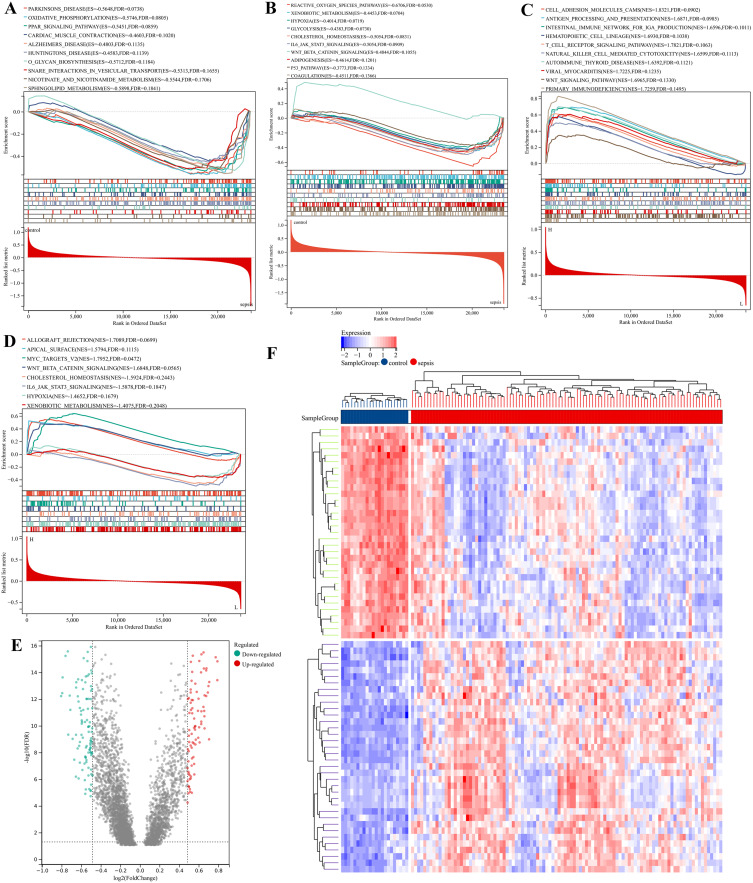
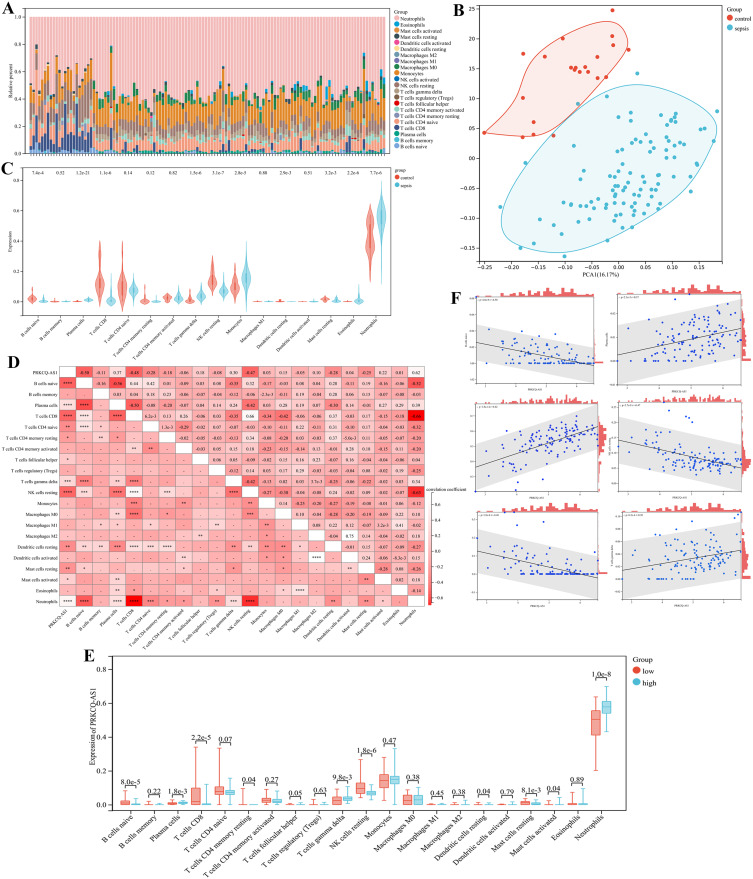
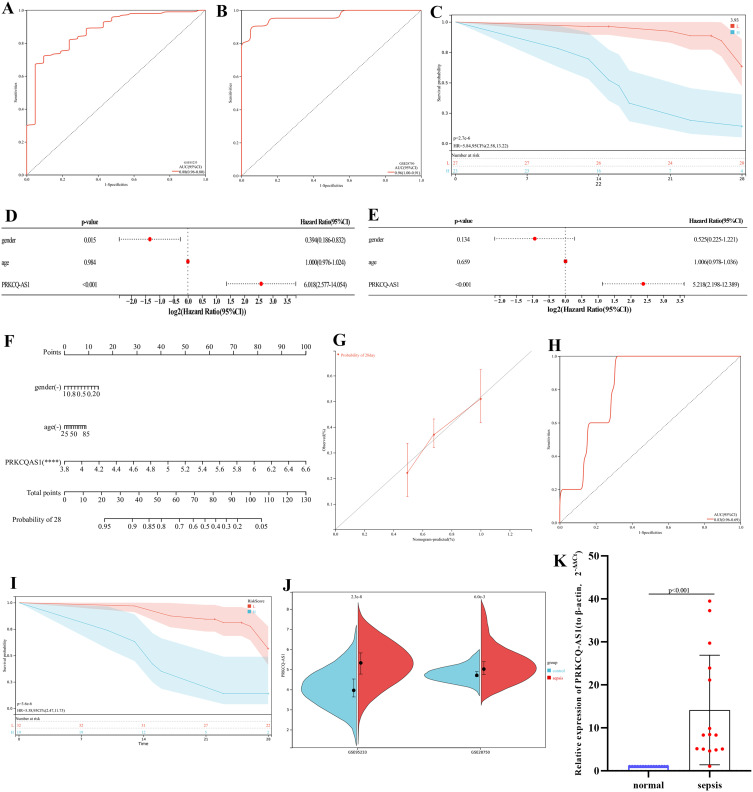
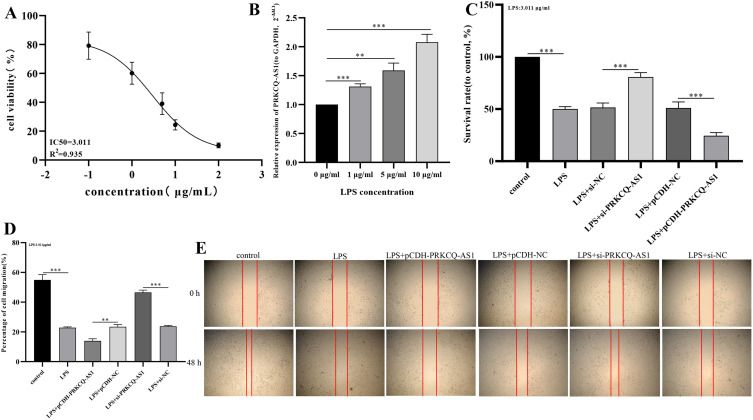
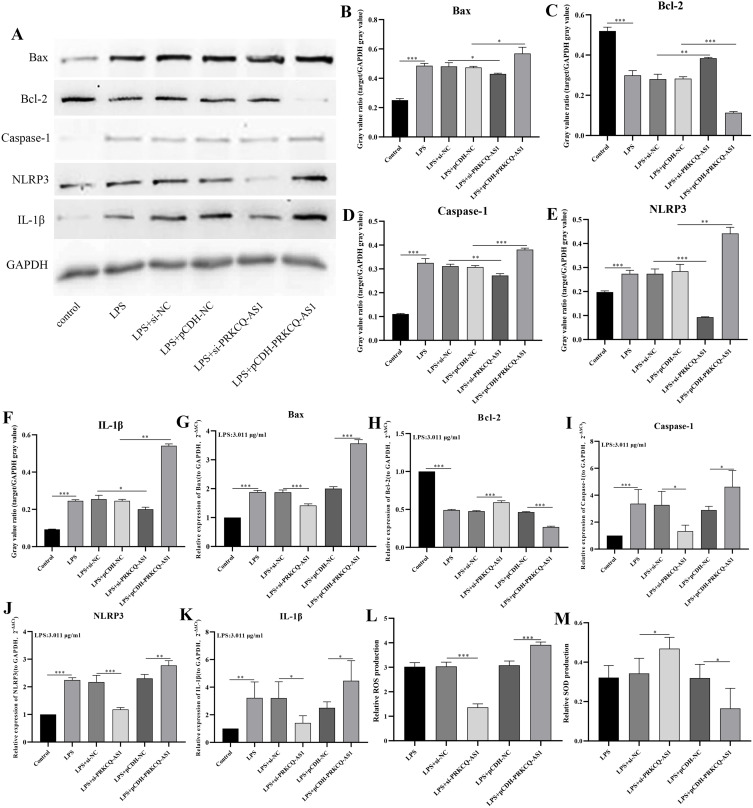
Methods: Transcriptome sequencing and limma was used to screen dysregulated RNAs. Key RNAs were screened by correlation analysis, lncRNA-mRNA co-expression and weighted gene co-expression network analysis. Immune infiltration, gene set enrichment analysis and gene set variation analysis were used to analyze the immune correlation. Kaplan-Meier curve, receiver operator characteristic curve, Cox regression analysis and nomogram were used to analyze the correlation between key RNAs and prognosis. Sepsis model was established by lipopolysaccharide-induced HUVECs injury, and then cell viability and migration ability were detected by cell counting kit-8 and wound healing assay. The levels of apoptosis-related proteins and inflammatory cytokines were detected by RT-qPCR and Western blot. Reactive Oxygen Species and superoxide dismutase were detected by commercial kit.

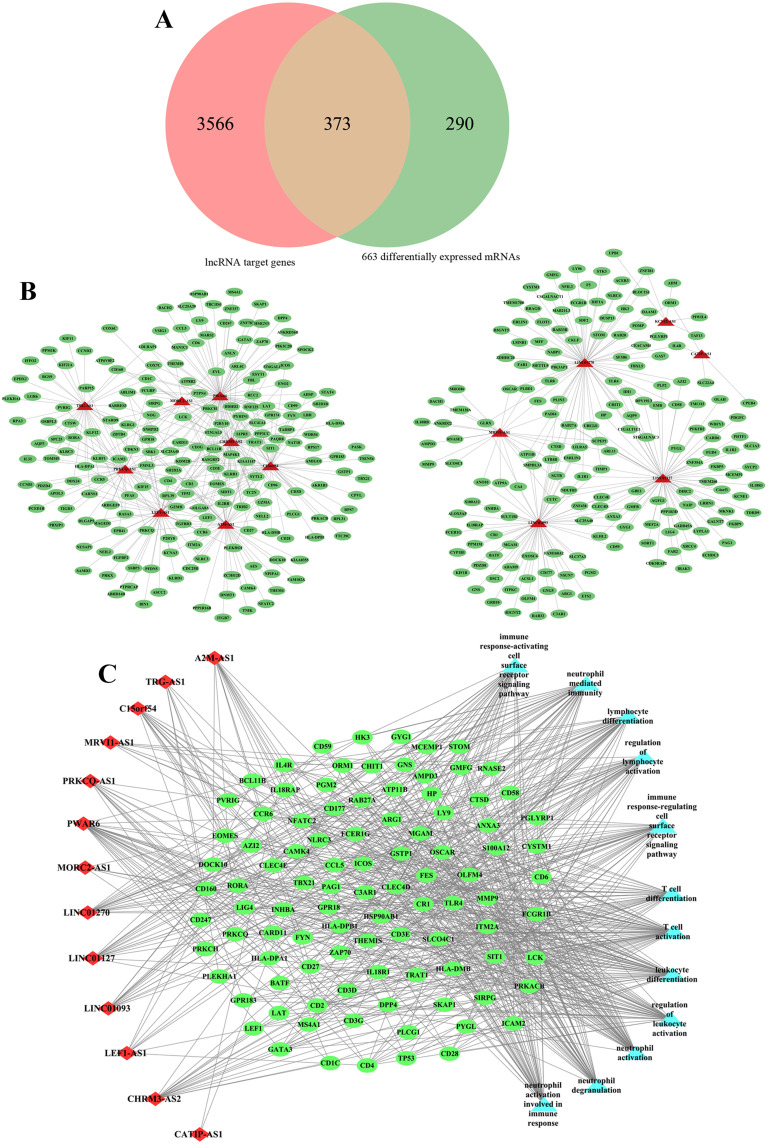
Results: Fourteen key differentially expressed lncRNAs and 663 key differentially expressed genes were obtained. And these lncRNAs were closely related to immune cells, especially T cell activation, immune response and inflammation. Subsequently, Subsequently, lncRNA PRKCQ-AS1 was identified as the regulator for further investigation in sepsis. RT-qPCR results showed that PRKCQ-AS1 expression was up-regulated in clinical samples and sepsis model cells, which was an independent prognostic factor in sepsis patients. Immune correlation analysis showed that PRKCQ-AS1 was involved in the immune response and inflammatory process of sepsis. Cell function tests confirmed that PRKCQ-AS1 could inhibit sepsis model cells viability and promote cell apoptosis, inflammatory damage and oxidative stress.

Conclusion: We constructed immune-related lncRNA-mRNA regulatory networks in the progression of sepsis and confirmed that PRKCQ-AS1 is an important prognostic factor affecting the progression of sepsis and is involved in immune response.

Keywords: PRKCQ-AS1; immune-related lncRNA; lncRNA-mRNA; prognosis and progress; sepsis.


Conflict of interest statement

The authors declare that they do not have any potential conflicts of interest in this work.

Figures

Figure 1
Figure 1
(A) The type and proportion of lncRNA identified in transcriptome sequencing data. (B) PCA principal component analysis based on lncRNA expression in sepsis group and control group. (C) PCA principal component analysis based on mRNA expression in sepsis group and control group. (D) Volcano plot shows the differential expression of lncRNAs between sepsis group and control group. GP1 represents the sepsis group. GP2 represents the normal group. (E) Heat map shows the differential expression of lncRNAs between sepsis group and control group. GP1 represents the sepsis group. GP2 represents the normal group. (F) Volcano plot shows the differential expression of mRNAs between sepsis group and control group. GP1 represents the sepsis group. GP2 represents the normal group. (G) Heat map shows the differential expression of mRNAs between sepsis group and control group. GP1 represents the sepsis group. GP2 represents the normal group. (H) Venn shows the common differential expression lncRNAs between sequencing data and GSE95233. (I) Venn shows the common differential expression mRNAs between sequencing data and GSE95233.
Figure 2
Figure 2
(A) Venn shows the common mRNAs between lncRNA target genes and differential expression mRNAs. (B) lncRNA-mRNA co-expression network. The green oval represents mRNAs. the red triangles represent lncRNAs. (C) lncRNA-mRNA-GO term co-expression network. The green oval represents mRNAs. the red diamonds represent lncRNAs. The light blue triangle represents GO terms.
Figure 3
Figure 3
(A) lncRNA WGCNA soft threshold results, where the horizontal axis is soft threshold (power) and the vertical axis is the evaluation parameter of the scale-free network. (B) mRNA WGCNA sample clustering results (above) and soft threshold results (below), where the horizontal axis is soft threshold (power) and the vertical axis is the evaluation parameter of the scale-free network. (C) Correlation heat map of sepsis phenotype and control phenotype with each module of lncRNAs. The horizontal axis is the basic phenotype, the vertical axis is the module, the color indicates the correlation, and the text represents the correlation coefficient and significance p value. (D) Correlation heat map of sepsis phenotype and control phenotype with each module of mRNAs. The horizontal axis is the basic phenotype, the vertical axis is the module, the color indicates the correlation, and the text represents the correlation coefficient and significance p value. (E) Common lncRNAs between lncRNA-mRNA co-expression network and WGCNA key modules. (F) Common mRNAs between lncRNA-mRNA co-expression network and WGCNA key modules. (G) GO enrichment analysis of common mRNAs. The ordinate text indicates the name of GO. The x-coordinate is Gene Ratio. (H) KEGG enrichment analysis of common mRNAs. The ordinate text indicates the name of GO. The x-coordinate is gene Ratio.
Figure 4
Figure 4
Gene Set Enrichment Analysis (GSEA) and Gene Set Variation Analysis (GSVA) enrichment analysis. (A) GSEA on the whole GSE95233 and observed its enrichment in KEGG set. (B) GSEA on the whole GSE95233 and observed its enrichment in HALLMARK set. (C) GSEA based on PRKCQ-AS1 expression in KEGG set. (D) GSEA based on PRKCQ-AS1 expression in HALLMARK set. (E) Volcano for differential GSVA enrichment analysis of PRKCQ-AS1 expression in sepsis and control groups. Green dots represent down regulated enrichment, and red dots represent up regulated enrichment. (F) The heat map shows the significant gene sets; blue is the control group, red is the sepsis group, the blue square represents low enrichment, and the red square represents high enrichment.
Figure 5
Figure 5
Immune cell infiltration and correlational analysis. (A) Barplot shows the proportion of 22 immune cells in sepsis samples. (B) PCA analysis of immune infiltration background dataset. (C) Immune cells are expressed at different group of sepsis (sepsis vs control) as violin chart. Turquoise is the sepsis group, and red is the control group. (D) The correlation heat map of 22 kinds of infiltrated immune cells and PRKCQ-AS1 expression. Light red means positive correlation, and red means negative correlation. ****p <0.0001, ***p <0.001, ** p<0.01, *p<0.05 (E) Immune cells are expressed at different levels of PRKCQ-AS1 (low vs high) as box diagram. Turquoise is the low expression group, and red is the low expression group. (F) The correlation of infiltrated immune cells (Plasma cells, T cells gamma delta, NK cells resting, T cells CD8, B cells native and Neutrophils) and PRKCQ-AS1 expression.
Figure 6
Figure 6
(A) ROC analysis of PRKCQ-AS1based on GSE95233. (B) ROC analysis of PRKCQ-AS1based on GSE28750. (C) PRKCQ-AS1 survival analysis in sepsis patients. The turquoise line represents high expression group, and the red line represents low expression group. The turquoise shading and red shading represent 95% confidence interval. (D) Forest maps show univariate Cox analysis results. (E) Forest maps show multivariate Cox analysis results. (F) A nomogram of 28-day survival prediction of sepsis patients constructed with PRKCQ-AS1 expression, age and gender. ****p <0.0001. (G) The calibration curve corresponding to the nomogram. (H) The ROC analysis corresponding to the nomogram. (I) Kaplan–Meier curve corresponding to the nomogram. The turquoise line represents high expression group, and the red line represents low expression group. The turquoise shading and red shading represent 95% confidence interval. (J) PRKCQ-AS1 expression in GSE95233 and GSE28750. (K) PRKCQ-AS1 expression in 15 sepsis samples and 15 control samples by RT-qPCR. The expression level of actin was used as an internal reference for PRKCQ-AS1. The data are shown as the mean ± standard deviation.
Figure 7
Figure 7
(A) Fitting curve of the effect of LPS on HUVECs activity. (B) Effects of LPS concentration on PRKCQ-AS1 expression in HUVECs by RT-qPCR. The expression level of GAPDH was used as an internal reference for PRKCQ-AS1. The data are shown as the mean ± standard deviation. ***p <0.001. **p<0.01. (C) The effects of PRKCQ-AS1 knockdown or overexpression on the vitality of sepsis-related cell (LPS-induced HUVECs) measured using the CCK-8 assay. The data are shown as the mean ± standard deviation. ***p < 0.001. (D and E) The effects of PRKCQ-AS1 knockdown or overexpression on the migration of sepsis-related cell (LPS-induced HUVECs) measured using the wound healing assay. The data are shown as the mean ± standard deviation. ***p < 0.001. **p < 0.01.
Figure 8
Figure 8
(AF) Effects of PRKCQ-AS1 overexpression or knockout on protein expression levels of Bax (A and B), Bcl-2(A and C), caspase 1(A and D), NLRP3(A and E) and IL-1β (A and F) in the sepsis-related cell (LPS-induced HUVECs) by western bolt. ***p < 0.001.** p < 0.01. *p < 0.05.(G–K) Effects of PRKCQ-AS1 overexpression or knockout on expression levels of Bax (G), Bcl-2 (H), caspase 1 (I), NLRP3 (J) and IL-1β (K) in the sepsis-related cell (LPS-induced HUVECs) by RT-qPCR. The expression level of GAPDH was used as an internal reference for PRKCQ-AS1. The data are shown as the mean ± standard deviation. ***p<0.001. ** p<0.01. *p < 0.05.(L and M) Effects of PRKCQ-AS1 overexpression or knockout on ROS (L) and SOD (M) levels in the sepsis-related cell (LPS-induced HUVECs) by commercial kit. The data are shown as the mean ± standard deviation. ***p<0.001. *p < 0.05.

Similar articles

Cited by

References

    1. Purcarea A, Sovaila S. Sepsis, a 2020 review for the internist. Rom J Intern Med. 2020;58(3):129–137. doi:10.2478/rjim-2020-0012 - DOI - PubMed
    1. Gauer R, Forbes D, Boyer N. Sepsis: diagnosis and management. Am Fam Physician. 2020;101(7):409–418. - PubMed
    1. Ackerman MH, Ahrens T, Kelly J, Pontillo A. Sepsis. Crit Care Nurs Clin North Am. 2021;33(4):407–418. doi:10.1016/j.cnc.2021.08.003 - DOI - PubMed
    1. van der Poll T, Shankar-Hari M, Wiersinga WJ. The immunology of sepsis. Immunity. 2021;54(11):2450–2464. doi:10.1016/j.immuni.2021.10.012 - DOI - PubMed
    1. Torres LK, Pickkers P, van der Poll T. Sepsis-induced immunosuppression. Annu Rev Physiol. 2022;84(1):157–181. doi:10.1146/annurev-physiol-061121-040214 - DOI - PubMed