. 2024 Feb 1;137(3):jcs261685.
doi: 10.1242/jcs.261685. Epub 2024 Feb 8.

Segregation of nascent GPCRs in the ER-to-Golgi transport by CCHCR1 via direct interaction

Affiliations

Segregation of nascent GPCRs in the ER-to-Golgi transport by CCHCR1 via direct interaction

Xin Xu et al. J Cell Sci. .

Abstract

G protein-coupled receptors (GPCRs) constitute the largest superfamily of cell surface signaling proteins that share a common structural topology. When compared with agonist-induced internalization, how GPCRs are sorted and delivered to functional destinations after synthesis in the endoplasmic reticulum (ER) is much less well understood. Here, we demonstrate that depletion of coiled-coil α-helical rod protein 1 (CCHCR1) by siRNA and CRISPR-Cas9 significantly inhibits surface expression and signaling of α2A-adrenergic receptor (α2A-AR; also known as ADRA2A), without affecting α2B-AR. Further studies show that CCHCR1 depletion specifically impedes α2A-AR export from the ER to the Golgi, but not from the Golgi to the surface. We also demonstrate that CCHCR1 selectively interacts with α2A-AR. The interaction is mediated through multiple domains of both proteins and is ionic in nature. Moreover, mutating CCHCR1-binding motifs significantly attenuates ER-to-Golgi export, surface expression and signaling of α2A-AR. Collectively, these data reveal a novel function for CCHCR1 in intracellular protein trafficking, indicate that closely related GPCRs can be sorted into distinct ER-to-Golgi transport routes by CCHCR1 via direct interaction, and provide important insights into segregation and anterograde delivery of nascent GPCR members.

Keywords: Adrenergic receptor; Biosynthesis; CCHCR1; ER export; G protein-coupled receptor; Sorting; Trafficking.


Conflict of interest statement

Competing interests The authors declare no competing or financial interests.

Figures

Fig. 1.
Fig. 1.
Effects of CCHCR1 depletion by siRNA and CRISPR-Cas9 on the surface expression, subcellular localization and signaling of α2-ARs. (A) Western blot analysis of siRNA-mediated knockdown of CCHCR1 and expression of siRNA-resistant CCHCR1. HEK293 cells were transfected with Myc–CCHCR1 or its siRNA-resistant version together with control siRNA or individual siRNA targeting CCHCR1. The expression of Myc-CCHCR1 was measured by immunoblotting using anti-Myc antibodies. (B) Quantitative data for results shown in A. (C) Effects of siRNA-mediated knockdown of CCHCR1 on the cell surface expression of α2A-AR and α2B-AR. HEK293 cells were transfected with α2A-AR or α2B-AR together with control or CCHCR1 siRNA and the surface expression of α2-ARs was determined by intact cell ligand binding using [3H]RX821002. The data shown are percentages of specific binding obtained from cells transfected with control siRNA. In a typical experiment, the mean values of specific [3H]RX821002 binding were 15,931±440 and 10,194±477 cpm in control cells transfected with α2A-AR and α2B-AR, respectively. (D) Effects of CCHCR1 knockdown by siRNA on the subcellular localization of α2A-AR and α2B-AR. HEK293 cells were transfected with GFP-tagged α2A-AR or α2B-AR together with control or CCHCR1 siRNA. Images are representatives of three repeats. (E) Western blot analysis of CCHCR1 depletion by CRISPR-Cas9. HEK293 cells were transfected with control or CRISPR-Cas9 KO plasmids together with Myc–CCHCR1. (F) Quantitative data for results shown in E. (G) Effects of CCHCR1 KO by CRISPR-Cas9 on the subcellular distribution of α2A-AR and α2B-AR. The cells transfected with control and CCHCR1 KO plasmids were defined by the GFP signal. (H) Quantitative data for results shown in G. The quantitative data are the surface-to-total expression ratio. (I) Effects of CCHCR1 knockdown by siRNA on the surface expression of endogenous α2A-AR. HT29 cells were transfected with control or CCHCR1 siRNA for 48 h and the numbers of α2A-AR in membrane fractions were determined by ligand binding using [3H]-RX821002. The data shown are the receptor numbers per µg membrane protein. (J) Effects of CCHCR1 knockdown on ERK1/2 activation by exogenously transfected α2-AR-GFP in HEK293 cells and by endogenous α2A-AR in HT29 cells. The cells were stimulated with UK14304 at 1 μM for 5 min. Receptor expression was detected by using GFP antibodies. (K) Quantitative data for results shown in J. All quantitative data are expressed as mean±s.e.m. (n=23–35 cells in three separate experiments in H and n=3 in B, C, F, I and K). *P<0.05, **P<0.01, ***P<0.001 versus respective control (one-way ANOVA with Turkey's multiple comparisons post test in B, C, I and K, and unpaired two-tailed t-test in F and H). Scale bars: 10 μm.
Fig. 2.
Fig. 2.
Effects of CCHCR1 depletion by siRNA and CRISPR-Cas9 on the ER-to-Golgi transport of nascent α2A-AR and α2B-AR in RUSH assays. (A) Cartoon of the RUSH system for the transport of newly synthesized α2-ARs from the ER to the Golgi. Str, streptavidin. (B) Representative images showing the ER-to-Golgi transport kinetics of nascent α2A-AR and α2B-AR in RUSH assays. HEK293 cells were transfected with RUSH plasmids expressing α2A-AR or α2B-AR for 24 h and then incubated with biotin for 10, 20 and 30 min. After the cells were fixed, receptor expression at the Golgi (area denoted by the white dotted line) and in the whole cell (area denoted by the yellow dotted line) was quantified. (C) Quantitative data for results shown in B. (D,E) Effects of siRNA-mediated knockdown of CCHCR1 on α2-AR export from the ER to the Golgi. HEK293 cells were transfected with RUSH plasmids expressing α2A-AR (D) or α2B-AR (E) together with control or CCHCR1 siRNA and incubated with biotin for 15 and 30 min. (F) Quantitative data for results shown in D and E. (G,H) Effects of CRISPR-Cas9-mediated KO of CCHCR1 on α2-AR export from the ER to the Golgi. HEK293 cells were transfected with RUSH plasmids expressing mCherry-tagged α2A-AR (G) or α2B-AR (H) together with control or CCHCR1 KO plasmids carrying GFP and incubated with biotin for 15 and 30 min. (I) Quantitative data for results shown in G and H. All quantitative data shown are the Golgi-to-total ratio and expressed as mean±s.e.m. (n=20–32, 37–54 and 37–54 cells in C, F and I, respectively, from at least three individual experiments). ***P<0.001 versus control (one-way ANOVA with Turkey's multiple comparisons post test in F and by unpaired two-tailed t-test in I). Scale bars: 10 μm.
Fig. 3.
Fig. 3.
Effects of CCHCR1 depletion by siRNA and CRISPR-Cas9 on the Golgi-to-PM transport of α2-ARs. (A) Cartoon of the transport of nascent α2-ARs from the Golgi to the cell surface measured in RUSH assays in combination with temperature-induced block of Golgi export. Str, streptavidin. (B,C) Effects on siRNA-mediated CCHCR1 knockdown on α2-AR export from the Golgi to the PM. HEK293 cells transfected with RUSH plasmids expressing α2A-AR (B) or α2B-AR (C) together with control or CCHCR1 siRNA were treated with biotin at 20°C for 3 h (time 0 min) and then incubated with fresh DMEM without biotin at 37°C for 30 min (time 30 min). (D) Quantitative data for results shown in B and C. (E,F) Effects of CRISPR-Cas9-mediated KO of CCHCR1 on α2-AR export from the Golgi to the PM. The cells transfected with RUSH plasmids expressing mCherry-tagged α2A-AR (E) or α2B-AR (F) together with control or CCHCR1 KO plasmids were incubated at 37°C for 30 min (time 30 min) following biotin induction at 20°C for 3 h (time 0 min). (G) Quantitative data for results shown in E and F. All quantitative data are the Golgi-to-total ratio and expressed as mean±s.e.m. (n=25–52 and 23–36 cells in D and G, respectively, from at least three individual experiments). ***P<0.001 versus respective 0 min (one-way ANOVA with Turkey's multiple comparisons post test). Scale bars: 10 μm.
Fig. 4.
Fig. 4.
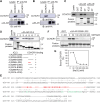
CCHCR1 interaction with α2-ARs and identification of CCHCR1-binding motifs in the ICL3 of α2A-AR. (A,B) Co-IP of CCHCR1 and α2A-AR (A) or α2B-AR (B). HEK293 cells were transfected with HA–α2A-AR (A) or HA–α2B-AR (B) together with empty vectors (Ctrl) or Myc–CCHCR1 and subjected to immunoprecipitation (IP) with HA antibodies. Myc-CCHCR1 and HA-α2-AR in the IP complex were detected by immunoblotting (IB) using Myc and HA antibodies, respectively. (C) Interaction of the ICL3 and the CT of α2A-AR and α2B-AR with Myc–CCHCR1 in GST fusion protein pulldown assays. The ICL3 and the CT of α2-ARs were generated as GST fusion proteins and incubated with cell lysates prepared from HEK293 cells expressing Myc–CCHCR1. Bound CCHCR1 was detected by immunoblotting using Myc antibodies. (D) Progressive deletion to identify the CCHCR1-binding domain in the α2A-AR ICL3. Different ICL3 fragments were generated as GST fusion proteins and their interactions with Myc–CCHCR1 were measured. (E) Alignment of the ICL3 of α2A-AR and α2B-AR by using EMBOSS Needle. The fragment S296–L332 in the α2A-AR ICL3 that binds CCHCR1 as demonstrated in D is colored red. Basic residues in this domain are bolded. Acidic residues in the corresponding region of the α2B-AR ICL3 are colored green. (F) Effects of increasing concentrations of NaCl on CCHCR1 interaction with the fragment S296-L332. (G) Quantitative data for results shown in F. The quantitative data are presented as mean±s.e.m. (n=3). GST fusion proteins used in individual experiments are shown. The results shown in each panel are representatives of at least 3 repeats.
Fig. 5.
Fig. 5.
Identification of CCHCR1-binding residues in the CT of α2A-AR. (A) Alignment of the CT of α2A-AR and α2B-AR. The membrane-proximal CT of both receptors form helix 8. The RKR motif in α2A-AR is colored red. (B) Effects of mutating the RKR motif to AAA and EEE on the interaction of the α2A-AR CT with Myc–CCHCR1 in GST fusion protein pulldown assays. (C) Quantitative data shown for results shown in B. (D) Effects of increasing concentrations of NaCl on CCHCR1 interaction with the α2A-AR CT. (E) Quantitative data for results shown in D. GST fusion proteins used in individual experiments are shown. The quantitative data are presented as mean±s.e.m. (n=3). ***P<0.001 versus WT CT.
Fig. 6.
Fig. 6.
Identification of α2A-AR-binding domains in CCHCR1. (A) The structure of CCHCR1 predicted by AlphaFold, containing 5 helixes. (B) The strategy to identify specific α2A-AR-binding domains in CCHCR1. The domains are depicted to scale. The right panel summarizes the results shown in C. +++, strong interaction; +, weak interaction; –, no detectable interaction. (C) Interactions of Myc-tagged fragments of CCHCR1 with the ICL3 and the CT of α2A-AR in GST fusion protein pulldown assays. Similar results were obtained in at least three repeats. (D) Sequence and structure of helix 5 of CCHCR1. Three acidic residues which were mutated to alanine residues (DDE-3A) are colored red. (E) Effect of mutating the three acidic residues on the interaction of the CCHCR1 fragment 666–756 with the α2A-AR CT. (F) Quantitative data for results shown in E. The data are the bound CCHCR1 fragment relative to the input (lysate) and presented as mean±s.e.m. (n=3). ***P<0.001 versus WT 666–756 (unpaired two-tailed t-test).
Fig. 7.
Fig. 7.
Mutation of CCHCR1-binding motifs impedes the ER-to-Golgi export, surface expression and signaling of α2A-AR. (A) The ER-to-Golgi transport of α2A-AR and its mutant Δ37/3E lacking the CCHCR1-binding sites in the ICL3 and the CT. HEK293 cells were transfected with RUSH plasmids expressing mCherry-tagged α2A-AR or Δ37/3E and incubated with biotin for 15 min. (B) Quantitative data for results shown in A. The quantitative data are the Golgi-to-total expression ratio. (C) Schematic diagram showing RUSH-based BRET assays to measure the cell surface expression of α2A-AR. Str, streptavidin. (D) The surface expression of α2A-AR and Δ37/3E as measured in RUSH-based BRET assays in live cells. HEK293 cells were transfected with RUSH plasmids expressing α2A-AR or Δ37/3E together with Venus–kRas. After incubation with biotin for 2 h, the surface expression of α2A-AR was measured by BRET assays. (E) The surface expression of α2A-AR and Δ37/3E as measured by intact cell radioligand binding after transient expression for 24 h. (F) The surface expression of α2A-AR and Δ37/3E as measured by β-lactamase reporter assays. HEK293 cells were transfected with β-lactamase-tagged α2A-AR or Δ37/3E and then incubated with nitrocefin. The absorbance at 486 nm was measured for 30 min and the rate of reaction was used as the readout of receptor surface expression. (G) ERK1/2 activation by α2A-AR and Δ37/3E. HEK293 cells were transfected with GFP-tagged α2A-AR or Δ37/3E and then stimulated with UK14304 at 1 μM for 5 min. Receptor expression was detected by using GFP antibodies. (H) Quantitative data for results shown in G. All quantitative data are presented as mean±s.e.m. (n=31–47 cells from at least three repeats in B; n=3 in D, E, F and H). *P<0.05, ***P<0.001 versus α2A-AR (unpaired two-tailed t-test). Scale bars: 10 μm. (I) A model depicting the function and mechanism of CCHCR1 in the sorting of newly synthesized α2A-AR and α2B-AR in their ER-to-Golgi transport. α2A-AR interacts with CCHCR1 and the interaction is mediated through positively charged residues (+) in the ICL3 and the CT of α2A-AR and negatively charged residues (–) in both termini of CCHCR1. In particular, the RKR motif in α2A-AR and the DDE motif in CCHCR1 have been demonstrated to be important for the interaction.

Similar articles

Cited by

References

    1. Allen, J. A. and Roth, B. L. (2011). Strategies to discover unexpected targets for drugs active at G protein-coupled receptors. Annu. Rev. Pharmacol. Toxicol. 51, 117-144. 10.1146/annurev-pharmtox-010510-100553 - DOI - PubMed
    1. Andersen, J. S., Wilkinson, C. J., Mayor, T., Mortensen, P., Nigg, E. A. and Mann, M. (2003). Proteomic characterization of the human centrosome by protein correlation profiling. Nature 426, 570-574. 10.1038/nature02166 - DOI - PubMed
    1. Asumalahti, K., Laitinen, T., Itkonen-Vatjus, R., Lokki, M. L., Suomela, S., Snellman, E., Saarialho-Kere, U. and Kere, J. (2000). A candidate gene for psoriasis near HLA-C, HCR (Pg8), is highly polymorphic with a disease-associated susceptibility allele. Hum. Mol. Genet. 9, 1533-1542. 10.1093/hmg/9.10.1533 - DOI - PubMed
    1. Asumalahti, K., Veal, C., Laitinen, T., Suomela, S., Allen, M., Elomaa, O., Moser, M., de Cid, R., Ripatti, S. and Vorechovsky, I. (2002). Coding haplotype analysis supports HCR as the putative susceptibility gene for psoriasis at the MHC PSORS1 locus. Hum. Mol. Genet. 11, 589-597. 10.1093/hmg/11.5.589 - DOI - PubMed
    1. Bermak, J. C., Li, M., Bullock, C. and Zhou, Q. Y. (2001). Regulation of transport of the dopamine D1 receptor by a new membrane-associated ER protein. Nat. Cell Biol. 3, 492-498. 10.1038/35074561 - DOI - PubMed

Publication types

MeSH terms

Substances

LinkOut - more resources