. 2024 May 7;120(6):630-643.
doi: 10.1093/cvr/cvae014.

Histone demethylase KDM5 regulates cardiomyocyte maturation by promoting fatty acid oxidation, oxidative phosphorylation, and myofibrillar organization

Affiliations

Histone demethylase KDM5 regulates cardiomyocyte maturation by promoting fatty acid oxidation, oxidative phosphorylation, and myofibrillar organization

Manisha Deogharia et al. Cardiovasc Res. .

Abstract

Aims: Human pluripotent stem cell-derived cardiomyocytes (iPSC-CMs) provide a platform to identify and characterize factors that regulate the maturation of CMs. The transition from an immature foetal to an adult CM state entails coordinated regulation of the expression of genes involved in myofibril formation and oxidative phosphorylation (OXPHOS) among others. Lysine demethylase 5 (KDM5) specifically demethylates H3K4me1/2/3 and has emerged as potential regulators of expression of genes involved in cardiac development and mitochondrial function. The purpose of this study is to determine the role of KDM5 in iPSC-CM maturation.

Methods and results: KDM5A, B, and C proteins were mainly expressed in the early post-natal stages, and their expressions were progressively downregulated in the post-natal CMs and were absent in adult hearts and CMs. In contrast, KDM5 proteins were persistently expressed in the iPSC-CMs up to 60 days after the induction of myogenic differentiation, consistent with the immaturity of these cells. Inhibition of KDM5 by KDM5-C70 -a pan-KDM5 inhibitor, induced differential expression of 2372 genes, including upregulation of genes involved in fatty acid oxidation (FAO), OXPHOS, and myogenesis in the iPSC-CMs. Likewise, genome-wide profiling of H3K4me3 binding sites by the cleavage under targets and release using nuclease assay showed enriched of the H3K4me3 peaks at the promoter regions of genes encoding FAO, OXPHOS, and sarcomere proteins. Consistent with the chromatin and gene expression data, KDM5 inhibition increased the expression of multiple sarcomere proteins and enhanced myofibrillar organization. Furthermore, inhibition of KDM5 increased H3K4me3 deposits at the promoter region of the ESRRA gene and increased its RNA and protein levels. Knockdown of ESRRA in KDM5-C70-treated iPSC-CM suppressed expression of a subset of the KDM5 targets. In conjunction with changes in gene expression, KDM5 inhibition increased oxygen consumption rate and contractility in iPSC-CMs.

Conclusion: KDM5 inhibition enhances maturation of iPSC-CMs by epigenetically upregulating the expressions of OXPHOS, FAO, and sarcomere genes and enhancing myofibril organization and mitochondrial function.

Keywords: Epigenetics; H3K4me3; Histone modification; KDM5; iPSC-cardiomyocytes.


Conflict of interest statement

Conflict of interest: none declared

Figures

Graphical Abstract
Graphical Abstract
The figure was generated using BioRender.com.
Figure 1
Figure 1
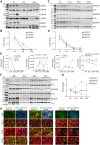
Expression of KDM5A, B, and C in immature and mature CMs. (A) Immunoblot (IB) analysis from whole heart extracts showing the expression of KDM5A, KDM5B, and KDM5C in the neonate (P5) and their absence in heart samples from adult mice. GAPDH was used as a loading control. (B) Respective quantitative data for KDM5A, B, and C normalized to GAPDH levels from whole heart extracts. (C) IB analysis of KDM5A, B, and C levels in mouse CMs isolated from newborn (P2), 2-week (P14), 4-week (P28), and 8-week (P56) mouse hearts. (D) Corresponding quantitative data for KDM5A, B, and C from cardiac myocytes normalized to VCL. (E) qPCR analysis of RNA extracted at different time points of differentiation of human iPSCs towards cardiac lineage. The relative expression levels of pluripotent markers, cardiac transcription factors, and CM lineage markers at different stages of differentiation are shown. The expression levels of KDM5A, 5B and 5C at the indicated time points are also shown. (F) IB analysis of KDM5A, 5B, and 5C levels from extracts obtained at different time points of iPSC differentiation to CM. (G) Quantitative data showing consistent expression of KDM5A, B, and C proteins in iPSC and at all stages of iPSC differentiation towards CM normalized to VCL. (H) IF staining of cells with anti-KDM5A, B, or C (green) and anti-TNNT2 antibodies (red) and DAPI (blue) showing the expression and nuclear localization of KDM5 proteins at all stages of differentiation.
Figure 2
Figure 2
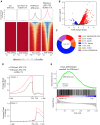
Effect of KDM5 inhibition on iPSC-CM gene expression. (A) Immunoblot showing H3K4me3 levels after treatment of iPSC-CMs with different concentrations of the KDM5 inhibitor (KDM5-C70). Cells treated with vehicle (0.01% DMSO) and untreated cells served as controls. (B) Changes in the level of H3K4me3 relative to H3 for the data shown in A. (C) IF staining using anti-H3K4me3 (green) and anti-TNNT2 (red) antibodies and DAPI (blue) (D) MDS plot of RNA-seq data showing the separation of iPSC-CMs and DMSO from the KDM5-C70-treated samples. (E) Volcano plots obtained from RNA-seq data showing DEGs and the significance level in KDM5-C70 compared with untreated control iPSC-CMs. The differentially upregulated genes are shown in red, while those that are downregulated are shown in blue and those that remain unchanged are shown in black. (F) Heatmap and hierarchical clustering of DEGs in the indicated groups. (G) Heat plot showing the expression pattern and differential expression status of KDM5A, and B predicted targets after KDM5-C70 treatment. (H and I) GSEA after KDM5-C70 treatment showing the activated (H) or inhibited (I) hallmark gene signature. The Y-axis in the graphs represents the Normalized Enrichment Score, the colour intensity represents the number of genes involved, and the size indicates the level of significance for each pathway.
Figure 3
Figure 3
Effect of KDM5 inhibition on genome-wide H3K4me3 distribution. (A) Heat plot showing cumulative signal intensity for H3K4me3 and IgG in treated and untreated samples. The upper panels show the average profile of the peaks. The lower panels show read density heatmaps around 3Kb from the peak centres. (B) Volcano plot showing differentially H3K4me3 peaks in the KDM5-C70-treated vs. control groups. Peaks that are differentially upregulated (higher signal intensity) are shown in red, while downregulated peaks are shown in blue. (C) Genome-wide distribution of differentially enriched H3K4me3 peaks. Promoter and upstream regions are defined as the region 3 kb upstream and 1 kb downstream from the start of transcription. (D) Distribution of peaks around the TSS, gene body and downstream to gene body in control cells (black) and KDM-C70-treated cells (red). (E) GSEA plots showing the correlation of RNA levels of DEGs with the genes that have differentially higher H3K4me3 deposits in KDM5-C70-treated vs. control groups.
Figure 4
Figure 4
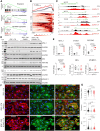
Effect of KDM5 inhibition on sarcomere gene programme. (A) GSEA and GO analysis of DEGs showing induction of the gene programme involved in myogenesis, and myofilament formation. (B) Distribution of H3K4me3 peak density at the TSS of sarcomere genes differentially expressed in KDM5-C70-treated (red) vs. control (black) samples and heat plot showing the signal intensity of H3K4me3 in the upstream regions of sarcomere genes in control and KDM5-C70-treated samples. (C) Integrative genomics viewer (IGV) genome browser trace of H3K4me3 showing peak intensity at the promoter and upstream regions of selected sarcomere genes in control and treated samples. (D–E) IB analysis showing increased expression of MYL2, TNNI3, MYOM2, and MYH7 and no changes in Desmin (DES) and MYBPC3 in KDM5-C70-treated groups. (F) IF staining with anti-TNNT2 (red), anti-ACTN1 (green), and DAPI (blue) showing sarcomeres and a prominent striated pattern in KDM5C-70-treated cells. Cells were plated on a Matrigel-coated glass coverslip. (G) Calculated circularity index (0 = oblong and 1 = circle), area, and perimeter for control, DMSO, and KDM5-C70-treated samples.
Figure 5
Figure 5
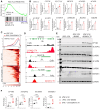
KDM5 inhibition leads to induction of FAO gene programme. (A) GSEA showing activation of fatty acid metabolism gene signature. (B) qPCRs of genes involved in fatty acid transport and oxidation demonstrate induction in KDM5-C70-treated cells. (C) Heat plots showing distribution profile of peak density and peak width enrichment near the TSS of fatty acid metabolism genes in cells and KDM5-C70-treated samples. (D) IGV genome browser traces of H3K4me3 on selected genes involved in fatty acid metabolism in the control (black) and KDM5-C70-treated samples (red). (E) IB analysis showing increased expression of the fatty acid transporter CPT1B, and the enzymes involved in beta-oxidation of fatty acids namely ACADVL (Kruskal–Wallis test P = 0.0048), ACADM and ECHDC3 in treated cells. (F) Quantitative data showing the fold change in the expression of proteins as shown in E. Pairwise corrected P-values are shown in the figure.
Figure 6
Figure 6
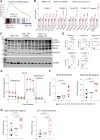
Effect of KDM5 inhibition on OXPHOS. (A) GSEA from DEGs-predicted activation of gene signature of OXPHOS upon KDM5 inhibition. (B) qPCR data showing transcript levels of selected OXPHOS genes from Complexes I to V. (C and D) Immunoblot analysis showing the expression of representative protein from Complexes I to V of the OXPHOS. (E) Panel shows kinetic data for real-time OCR measurements of hiPSC-CMs by Seahorse extracellular flux analyser in the controls and treated groups. Average data from 5 independent experiments each constituting an average of 10 wells/experiment is shown. Error bar indicates SEM. (F and G) KDM5-C70 treatment demonstrated a higher respiratory rate under baseline conditions and after mitochondrial decoupling. Quantitative data obtained from five independent experiments each constituting an average of 10 wells is shown. Pairwise corrected P-values after one-way ANOVA are shown.

Update of

Comment in

References

    1. Bergmann O, Bhardwaj RD, Bernard S, Zdunek S, Barnabe-Heider F, Walsh S, Zupicich J, Alkass K, Buchholz BA, Druid H, Jovinge S, Frisen J. Evidence for cardiomyocyte renewal in humans. Science 2009;324:98–102. - PMC - PubMed
    1. Senyo SE, Steinhauser ML, Pizzimenti CL, Yang VK, Cai L, Wang M, Wu TD, Guerquin-Kern JL, Lechene CP, Lee RT. Mammalian heart renewal by pre-existing cardiomyocytes. Nature 2013;493:433–436. - PMC - PubMed
    1. Rubart M, Field LJ. Cardiac regeneration: repopulating the heart. Annu Rev Physiol 2006;68:29–49. - PubMed
    1. Yuan X, Braun T. Multimodal regulation of cardiac myocyte proliferation. Circ Res 2017;121:293–309. - PubMed
    1. Porrello ER, Mahmoud AI, Simpson E, Hill JA, Richardson JA, Olson EN, Sadek HA. Transient regenerative potential of the neonatal mouse heart. Science 2011;331:1078–1080. - PMC - PubMed

Publication types

MeSH terms

Associated data