. 2024 May 1;14(5):737-751.
doi: 10.1158/2159-8290.CD-22-0952.

Jak2V617F Reversible Activation Shows Its Essential Requirement in Myeloproliferative Neoplasms

Affiliations

Jak2V617F Reversible Activation Shows Its Essential Requirement in Myeloproliferative Neoplasms

Andrew J Dunbar et al. Cancer Discov. .

Abstract

Gain-of-function mutations activating JAK/STAT signaling are seen in the majority of patients with myeloproliferative neoplasms (MPN), most commonly JAK2V617F. Although clinically approved JAK inhibitors improve symptoms and outcomes in MPNs, remissions are rare, and mutant allele burden does not substantively change with chronic therapy. We hypothesized this is due to limitations of current JAK inhibitors to potently and specifically abrogate mutant JAK2 signaling. We therefore developed a conditionally inducible mouse model allowing for sequential activation, and then inactivation, of Jak2V617F from its endogenous locus using a combined Dre-rox/Cre-lox dual-recombinase system. Jak2V617F deletion abrogates MPN features, induces depletion of mutant-specific hematopoietic stem/progenitor cells, and extends overall survival to an extent not observed with pharmacologic JAK inhibition, including when cooccurring with somatic Tet2 loss. Our data suggest JAK2V617F represents the best therapeutic target in MPNs and demonstrate the therapeutic relevance of a dual-recombinase system to assess mutant-specific oncogenic dependencies in vivo.

Significance: Current JAK inhibitors to treat myeloproliferative neoplasms are ineffective at eradicating mutant cells. We developed an endogenously expressed Jak2V617F dual-recombinase knock-in/knock-out model to investigate Jak2V617F oncogenic reversion in vivo. Jak2V617F deletion abrogates MPN features and depletes disease-sustaining MPN stem cells, suggesting improved Jak2V617F targeting offers the potential for greater therapeutic efficacy. See related commentary by Celik and Challen, p. 701. This article is featured in Selected Articles from This Issue, p. 695.


Figures

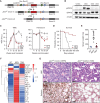
Figure 1. Jak2V617F deletion abolishes JAK/STAT signaling and abrogates the MPN phenotype. A, Schematic representation of the dual-recombinase Jak2V617F conditional knock-in/knock-out allele (Jak2RL), the Jak2RL knock-in allele following Dre recombination, and the null recombined allele following Cre-mediated deletion. Semi-circles indicate Rox sequences; triangles indicate loxP sequences. B, Representative Western blot depicting phospho-STAT5 abundance of Dre-mediated Jak2V617F knock-in (+Dre) versus Jak2V617F-deleted (+Dre +Cre) states from isolated splenocytes 7 days following tamoxifen (TAM) administration in comparison with unrecombined (Unrec.) Jak2RL cells (n = 2 biological replicates each; representative of n = 2 independent experiments). C, Peripheral blood count trends (weeks 0–24) of MPN versus tamoxifen (Jak2V617F-deleted) treated mice: WBCs (left), Hct (right; n ≥ 10 per arm; mean ± SEM). Gray bar represents duration of tamoxifen pulse/chow administration. Representative of n = 2 independent transplants. **, P ≤ 0.01; ****, P ≤ 0.0001. D, Kaplan–Meier survival analysis of MPN versus tamoxifen (Jak2V617F-deleted) treated mice (n ≥ 12 per arm; log-rank test). Gray bar represents duration of tamoxifen pulse/chow administration. ****, P ≤ 0.0001. E, Spleen weights of MPN versus tamoxifen (Jak2V617F-deleted) treated mice at timed sacrifice (24 weeks) in comparison with WT control mice (mean ± SEM). Representative of n = 2 independent transplants. ****, P ≤ 0.0001. F, Heat map scaled using Z-scores of serum cytokine/chemokine concentrations of MPN versus tamoxifen (Jak2V617F-deleted) treated mice harvested at time of sacrifice 18–24 weeks posttransplant in comparison with WT control mice (n = 4–7 biological replicates per arm pooled from n = 3 transplants). Asterisks denote cytokines with FDR ≤ 0.05. Kruskal–Wallis test with FDR correction. G, Representative hematoxylin and eosin (H&E) and reticulin stains of bone marrow of MPN (Control) versus tamoxifen (Jak2V617F-deleted) treated mice from timed sacrifice at 24 weeks. Representative micrographs of n = 6 individual mouse replicates per arm. All images represented at 400× magnification. Scale bar, 20 μm.
Figure 1.
Jak2 V617F deletion abolishes JAK/STAT signaling and abrogates the MPN phenotype. A, Schematic representation of the dual-recombinase Jak2V617F conditional knock-in/knock-out allele (Jak2RL), the Jak2RL knock-in allele following Dre recombination, and the null recombined allele following Cre-mediated deletion. Semicircles indicate Rox sequences; triangles indicate loxP sequences. B, Representative Western blot depicting phospho-STAT5 abundance of Dre-mediated Jak2V617F knock-in (+Dre) vs. Jak2V617F-deleted (+Dre +Cre) states from isolated splenocytes 7 days following tamoxifen (TAM) administration in comparison with unrecombined (Unrec.) Jak2RL cells (n = 2 biological replicates each; representative of n = 2 independent experiments). C, Peripheral blood count trends (weeks 0–24) of MPN vs. tamoxifen (Jak2V617F-deleted) treated mice: WBCs (left), Hct (right; n ≥ 10 per arm; mean ± SEM). Gray bar represents duration of tamoxifen pulse/chow administration. Representative of n = 2 independent transplants. **, P ≤ 0.01; ****, P ≤ 0.0001. D, Kaplan–Meier survival analysis of MPN vs. tamoxifen (Jak2V617F-deleted) treated mice (n ≥ 12 per arm; log-rank test). Gray bar represents duration of tamoxifen pulse/chow administration. ****, P ≤ 0.0001. E, Spleen weights of MPN vs. tamoxifen (Jak2V617F-deleted) treated mice at timed sacrifice (24 weeks) in comparison with WT control mice (mean ± SEM). Representative of n = 2 independent transplants. ****, P ≤ 0.0001. F, Heat map scaled using Z-scores of serum cytokine/chemokine concentrations of MPN vs. tamoxifen (Jak2V617F-deleted) treated mice harvested at time of sacrifice 18–24 weeks posttransplant in comparison with WT control mice (n = 4–7 biological replicates per arm pooled from n = 3 transplants). Asterisks denote cytokines with FDR ≤ 0.05. Kruskal–Wallis test with FDR correction. G, Representative hematoxylin and eosin (H&E) and reticulin stains of bone marrow of MPN (Control) vs. tamoxifen (Jak2V617F-deleted) treated mice from timed sacrifice at 24 weeks. Representative micrographs of n = 6 individual mouse replicates per arm. All images represented at 400× magnification. Scale bar, 20 μm.
Figure 2. Jak2V617F reversal impairs the fitness of MPN cells, including MPN stem cells. A, Peripheral blood (PB) mutant Cd45.2 percent chimerism trend (weeks 0–24) of early (3 weeks posttransplant) tamoxifen (TAM; Jak2V617F-deleted) treated (gold bar) and late (12 weeks posttransplant) tamoxifen-treated (maroon bar) mice (n = 8 each) in comparison with MPN (dark gray bar; n = 6) mice (mean ± SEM). Gray bars represent duration of tamoxifen pulse/chow administration. Representative of n = 2 independent transplants. **, P ≤ 0.01; ***, P ≤ 0.001. B, Bone marrow–mutant cell fraction within LSK (Lineage−Sca1+cKit+), granulocytic-monocytic progenitor (GMP; Lineage−cKit+Sca1−Cd34+Fcg+), and megakaryocytic-erythroid progenitor (MEP; Lineage−cKit+Sca1−Cd34−Fcg−) compartments of early (3 weeks posttransplant) tamoxifen (Jak2V617F-deleted) treated and late (12 weeks posttransplant) tamoxifen-treated mice in comparison with MPN mice at timed sacrifice of 24 weeks (n = 6–8 individual biological replicates per arm; mean ± SEM). Representative of n = 2 independent transplants. **, P ≤ 0.01; ***, P ≤ 0.001; ****, P ≤ 0.0001. C, Gene-set enrichment analysis (GSEA) of significant Hallmark gene sets of MPN versus tamoxifen (Jak2V617F-deleted) treated LSKs isolated 7 days after initiation of tamoxifen (n = 3–4 biological replicates per arm). D, Volcano plot demonstrating differential gene expression of MPN versus tamoxifen (Jak2V617F-deleted) treated LSKs 7 days following initiation of tamoxifen (n = 3–4 biological replicates per arm). E, GMP and MEP stem cell frequencies of MPN versus tamoxifen (Jak2V617F-deleted) treated mice 7 days following initiation of tamoxifen (n = 8 biological replicates per arm across two independent transplants; mean ± SEM). F, Row normalized heat map of RNA-seq data of key erythroid differentiation factor genes from harvested MEPs at baseline (MPN), day 3 (D3) and day 7 (D7) following initiation of tamoxifen (Jak2V617F deletion). G, HOMER motif analysis from ATAC-seq data demonstrating decreased accessibility of Gata motif signatures with concomitant increased accessibility of Cebp motif signatures of tamoxifen-treated (Jak2V617F-deleted) cKit+ bone marrow cells isolated 7 days following initiation of treatment in comparison with MPN cells (n = 3 biological replicates per arm).Non-Sig., nonsignificant.
Figure 2.
Jak2 V617F reversal impairs the fitness of MPN cells, including MPN stem cells. A, Peripheral blood (PB) mutant Cd45.2 percent chimerism trend (weeks 0–24) of early (3 weeks posttransplant) tamoxifen (TAM; Jak2V617F-deleted) treated (gold bar) and late (12 weeks posttransplant) tamoxifen-treated (maroon bar) mice (n = 8 each) in comparison with MPN (dark gray bar; n = 6) mice (mean ± SEM). Gray bars represent duration of tamoxifen pulse/chow administration. Representative of n = 2 independent transplants. **, P ≤ 0.01; ***, P ≤ 0.001. B, Bone marrow–mutant cell fraction within LSK (LineageSca1+cKit+), granulocytic-monocytic progenitor (GMP; LineagecKit+Sca1Cd34+Fcg+), and megakaryocytic-erythroid progenitor (MEP; LineagecKit+Sca1Cd34Fcg) compartments of early (3 weeks posttransplant) tamoxifen (Jak2V617F-deleted) treated and late (12 weeks posttransplant) tamoxifen-treated mice in comparison with MPN mice at timed sacrifice of 24 weeks (n = 6–8 individual biological replicates per arm; mean ± SEM). Representative of n = 2 independent transplants. **, P ≤ 0.01; ***, P ≤ 0.001; ****, P ≤ 0.0001. C, Gene-set enrichment analysis (GSEA) of significant Hallmark gene sets of MPN vs. tamoxifen (Jak2V617F-deleted) treated LSKs isolated 7 days after initiation of tamoxifen (n = 3–4 biological replicates per arm). D, Volcano plot demonstrating differential gene expression of MPN vs. tamoxifen (Jak2V617F-deleted) treated LSKs 7 days following initiation of tamoxifen (n = 3–4 biological replicates per arm). E, GMP and MEP stem cell frequencies of MPN vs. tamoxifen (Jak2V617F-deleted) treated mice 7 days following initiation of tamoxifen (n = 8 biological replicates per arm across two independent transplants; mean ± SEM). F, Row normalized heat map of RNA-seq data of key erythroid differentiation factor genes from harvested MEPs at baseline (MPN), day 3 (D3), and day 7 (D7) following initiation of tamoxifen (Jak2V617F deletion). G, HOMER motif analysis from ATAC-seq data demonstrating decreased accessibility of Gata motif signatures with concomitant increased accessibility of Cebp motif signatures of tamoxifen-treated (Jak2V617F-deleted) cKit+ bone marrow cells isolated 7 days following initiation of treatment in comparison with MPN cells (n = 3 biological replicates per arm). Non-Sig., nonsignificant.
Figure 3. Differential efficacy of Jak2V617F deletion compared with JAK inhibitor therapy. A, Scatter plot depicting −log10(Padj)*sign(log2 Fold Change) of ruxolitinib (RUX) treated versus tamoxifen (TAM; Jak2V617F-deleted) treated LSKs (Lineage−Sca1+cKit+) in comparison with MPN control LSKs isolated after 7 days of treatment (n = 2–3 biological replicates per arm); differentially expressed genes as indicated by color (see Supplementary Tables S1 and S3). B, Gene-set enrichment analysis (GSEA) depicting a positive enrichment in heme metabolism in ruxolitinib-treated (n = 3) versus negative enrichment in tamoxifen (Jak2V617F-deleted) treated (n = 3) LSKs isolated after 7 days of treatment. C, Box plot of the top leading edge genes in the Hallmark heme metabolism gene set of ruxolitinib-treated (blue) or tamoxifen (Jak2V617F-deleted) treated (red) megakaryocytic-erythroid progenitor (MEP; Lineage−cKit+Sca1−Cd34−Fcg−) cells as compared with untreated MPN cohorts. D, Box plots of scATAC-seq motif accessibility for either NFKB1 or REL transcription factors for untreated human JAK2 WT (n = 188 cells from 4 patients; gray), untreated JAK2V617F-mutant (n = 105 cells from 4 patients; gray), and ruxolitinib-treated JAK2V617F-mutant (n = 87 cells from 3 patients; blue) HSPCs (from Myers and colleagues, Nature, in press, 2024). P values indicated are from linear mixture model explicitly modeling patient identity as random effect to account for patient-specific effects, followed by likelihood ratio test. ****, P ≤ 0.0001. E, Peripheral blood counts of vehicle (VEH), ruxolitinib (RUX), the type II JAK2 inhibitor CHZ868 (CHZ), or tamoxifen (Jak2V617F-deleted) treated mice at the conclusion of a 6-week in vivo trial: WBCs (left), Hct (right; n ≥ 4 each; mean ± SEM). **, P ≤ 0.01; ***, P ≤ 0.001; ****, p ≤ 0.0001. F, Peripheral blood (PB) mutant Cd45.2 percent chimerism trend (0–6 weeks) of vehicle, ruxolitinib, CHZ868, or tamoxifen (Jak2V617F-deleted) treated mice (n ≥ 4 each; mean ± SEM). *, P ≤ 0.05. G, Bone marrow–mutant cell fraction of LSK (Lineage−Sca1+cKit+), granulocytic-monocytic progenitor (GMP; Lineage−cKit+Sca1−Cd34+Fcg+), and megakaryocytic-erythroid progenitor (MEP; Lineage−cKit+Sca1−Cd34−Fcg−) compartments of vehicle, ruxolitinib, CHZ868, or tamoxifen (Jak2V617F-deleted) treated mice at the conclusion of the 6-week in vivo trial (n ≥ 4 each; mean ± SEM). *, P ≤ 0.05; ****, P ≤ 0.0001. H, GSEA depicting a negative enrichment in downregulation of KRAS signaling targets in ruxolitinib-treated (n = 3) versus positive enrichment in tamoxifen (Jak2V617F-deleted) treated (n = 3) MEPs isolated after 7 days of respective treatment. I, IHC of phospho-ERK on sectioned bone marrow of vehicle, ruxolitinib, or tamoxifen (Jak2V617F-deleted) treated mice following 7 days of treatment (n = 3 individual biological replicates per arm). All images represented at 400× magnification. Scale bar, 20 μm. J, Quantitative PCR demonstrating relative Ybx1 expression levels from isolated cKit+ bone marrow of vehicle versus ruxolitinib versus tamoxifen (Jak2V617F-deleted) treated mice after 7 days of treatment (n = 2–4 individual biological replicates per arm; mean ± SEM). *, P ≤ 0.05; **, P ≤ 0.01. E–G, Representative of n = 3 independent experiments.
Figure 3.
Differential efficacy of Jak2V617F deletion compared with JAK inhibitor therapy. A, Scatter plot depicting −log10(Padj)*sign(log2 Fold Change) of ruxolitinib (RUX) treated vs. tamoxifen (TAM; Jak2V617F-deleted) treated LSKs (LineageSca1+cKit+) in comparison with MPN control LSKs isolated after 7 days of treatment (n = 2–3 biological replicates per arm); differentially expressed genes as indicated by color (see Supplementary Tables S1 and S3). B, Gene-set enrichment analysis (GSEA) depicting a positive enrichment in heme metabolism in ruxolitinib-treated (n = 3) vs. negative enrichment in tamoxifen (Jak2V617F-deleted) treated (n = 3) LSKs isolated after 7 days of treatment. C, Box plot of the top leading edge genes in the Hallmark heme metabolism gene set of ruxolitinib-treated (blue) or tamoxifen (Jak2V617F-deleted) treated (red) megakaryocytic-erythroid progenitor (MEP; LineagecKit+Sca1Cd34Fcg) cells as compared with untreated MPN cohorts. D, Box plots of scATAC-seq motif accessibility for either NFKB1 or REL transcription factors for untreated human JAK2 WT (n = 188 cells from 4 patients; gray), untreated JAK2V617F-mutant (n = 105 cells from 4 patients; gray), and ruxolitinib-treated JAK2V617F-mutant (n = 87 cells from 3 patients; blue) HSPCs (35). P values indicated are from linear mixture model explicitly modeling patient identity as random effect to account for patient-specific effects, followed by likelihood ratio test. ****, P ≤ 0.0001. E, Peripheral blood counts of vehicle (VEH), ruxolitinib (RUX), the type II JAK2 inhibitor CHZ868 (CHZ), or tamoxifen (Jak2V617F-deleted) treated mice at the conclusion of a 6-week in vivo trial: WBCs (left), Hct (right; n ≥ 4 each; mean ± SEM). **, P ≤ 0.01; ***, P ≤ 0.001; ****, p ≤ 0.0001. F, Peripheral blood (PB) mutant Cd45.2 percent chimerism trend (0–6 weeks) of vehicle, ruxolitinib, CHZ868, or tamoxifen (Jak2V617F-deleted) treated mice (n ≥ 4 each; mean ± SEM). *, P ≤ 0.05. G, Bone marrow–mutant cell fraction of LSK (LineageSca1+cKit+), granulocytic-monocytic progenitor (GMP; LineagecKit+Sca1Cd34+Fcg+), and megakaryocytic-erythroid progenitor (MEP; LineagecKit+Sca1Cd34Fcg) compartments of vehicle, ruxolitinib, CHZ868, or tamoxifen (Jak2V617F-deleted) treated mice at the conclusion of the 6-week in vivo trial (n ≥ 4 each; mean ± SEM). *, P ≤ 0.05; ****, P ≤ 0.0001. H, GSEA depicting a negative enrichment in downregulation of KRAS signaling targets in ruxolitinib-treated (n = 3) vs. positive enrichment in tamoxifen (Jak2V617F-deleted) treated (n = 3) MEPs isolated after 7 days of respective treatment. I, IHC of phospho-ERK on sectioned bone marrow of vehicle, ruxolitinib, or tamoxifen (Jak2V617F-deleted) treated mice following 7 days of treatment (n = 3 individual biological replicates per arm). All images represented at 400× magnification. Scale bar, 20 μm. J, Quantitative PCR demonstrating relative Ybx1 expression levels from isolated cKit+ bone marrow of vehicle vs. ruxolitinib vs. tamoxifen (Jak2V617F-deleted) treated mice after 7 days of treatment (n = 2–4 individual biological replicates per arm; mean ± SEM). *, P ≤ 0.05; **, P ≤ 0.01. E–G, Representative of n = 3 independent experiments.
Figure 4. Jak2V617F dependency with cooperative Tet2 loss. A, Schematic of the experimental set up for the double-mutant Jak2RL/Tet2f/f competitive transplants. Downward arrows represent initial pulse tamoxifen (TAM) administration to genetically inactivate Tet2. B, WBC counts of primary Jak2RL versus Tet2−/− versus Jak2RL/Tet2−/− transplanted mice at 16 weeks posttransplant (n = 5–6 each; mean ± SEM). Representative of an n = 2 independent transplants. *, P ≤ 0.05; ***, P ≤ 0.001. C, Spleen weights of primary Jak2RL versus Tet2−/− versus Jak2RL/Tet2−/− transplanted mice at time of sacrifice (n = 5–6 each; mean ± SEM). Representative of an n = 2 independent transplants. *, P ≤ 0.05; **, P ≤ 0.01. D, Peripheral blood Cd45.2-mutant percent chimerism of Jak2RL versus Tet2−/− versus Jak2RL/Tet2−/− secondary competitive transplant mice at 9 weeks posttransplant (n ≥ 10 per arm; mean ± SEM). Representative of an n = 2 independent transplants. *, P ≤ 0.05. E, Peripheral blood count trends (weeks 0–21) of MPN versus tamoxifen (Jak2V617F-deleted) treated Jak2RL versus Jak2RL/Tet2−/− competitive transplant mice: WBCs (left), hematocrit (Hct; right; n = 3–4 per arm; mean ± SEM). Gray bars represent duration of tamoxifen pulse/chow administration. Representative of n = 2 independent transplants. **, P ≤ 0.01; ***, P ≤ 0.001; ****, P ≤ 0.0001. F, Fold change from baseline (pretreatment) to post- of Cd45.2-mutant peripheral blood chimerism of Jak2RL versus Tet2−/− versus Jak2RL/Tet2−/− transplanted mice treated for 6 weeks with either vehicle, ruxolitinib (RUX; 60 mg/kg twice daily), or tamoxifen (Jak2VF deletion; n = 4–5 per arm; mean ± SEM). *, P ≤ 0.05. G, Reticulin stains of bone marrow from MPN versus tamoxifen (Jak2V617F-deleted) treated Jak2RL versus Jak2RL/Tet2−/− mice at timed sacrifice (21 weeks). Representative micrographs of n = 3 individual mouse replicates per arm. All images represented at 400× magnification. Scale bar, 20 μm. H, Bone marrow–mutant Cd45.2 percent chimerism within the LSK (Lineage−Sca1+cKit+) compartment of MPN versus tamoxifen (Jak2V617F-deleted) treated Jak2RL versus Jak2RL/Tet2−/− mice at timed sacrifice (21 weeks; n ≥ 7 biological replicates per arm across two independent transplants; mean ± SEM). *, P ≤ 0.05; ***, P ≤ 0.001. I, Serial replating assay of plated MPN versus tamoxifen (Jak2V617F-deleted) treated Jak2RL versus Jak2RL/Tet2−/− bone marrow cells harvested at timed sacrifice 21 weeks and scored at day 8 after each plating (each sample plated in triplicate, representative of n = 2 independent experiments, mean ± SD). cGy, centigray; KI, knock-in; KO, knock-out; Lin-neg BM, lineage-negative bone marrow; trx, transplant.
Figure 4.
Jak2V617F dependency with cooperative Tet2 loss. A, Schematic of the experimental setup for the double-mutant Jak2RL/Tet2f/f competitive transplants. Downward arrows represent initial pulse tamoxifen (TAM) administration to genetically inactivate Tet2. B, WBC counts of primary Jak2RL vs. Tet2−/− vs. Jak2RL/Tet2−/− transplanted mice at 16 weeks posttransplant (n = 5–6 each; mean ± SEM). Representative of n = 2 independent transplants. *, P ≤ 0.05; ***, P ≤ 0.001. C, Spleen weights of primary Jak2RL vs. Tet2−/− vs. Jak2RL/Tet2−/− transplanted mice at time of sacrifice (n = 5–6 each; mean ± SEM). Representative of n = 2 independent transplants. *, P ≤ 0.05; **, P ≤ 0.01. D, Peripheral blood Cd45.2-mutant percent chimerism of Jak2RL vs. Tet2−/− vs. Jak2RL/Tet2−/− secondary competitive transplant mice at 9 weeks posttransplant (n ≥ 10 per arm; mean ± SEM). Representative of n = 2 independent transplants. *, P ≤ 0.05. E, Peripheral blood count trends (weeks 0–21) of MPN vs. tamoxifen (Jak2V617F-deleted) treated Jak2RL vs. Jak2RL/Tet2−/− competitive transplant mice: WBCs (left), hematocrit (Hct; right; n = 3–4 per arm; mean ± SEM). Gray bars represent duration of tamoxifen pulse/chow administration. Representative of n = 2 independent transplants. **, P ≤ 0.01; ***, P ≤ 0.001; ****, P ≤ 0.0001. F, Fold change from baseline (pretreatment) to posttreatment of Cd45.2-mutant peripheral blood chimerism of Jak2RL vs. Tet2−/− vs. Jak2RL/Tet2−/− transplanted mice treated for 6 weeks with either vehicle, ruxolitinib (RUX; 60 mg/kg twice daily), or tamoxifen (Jak2VF deletion; n = 4–5 per arm; mean ± SEM). *, P ≤ 0.05. G, Reticulin stains of bone marrow from MPN vs. tamoxifen (Jak2V617F-deleted) treated Jak2RL vs. Jak2RL/Tet2−/− mice at timed sacrifice (21 weeks). Representative micrographs of n = 3 individual mouse replicates per arm. All images represented at 400× magnification. Scale bar, 20 μm. H, Bone marrow–mutant Cd45.2 percent chimerism within the LSK (LineageSca1+cKit+) compartment of MPN vs. tamoxifen (Jak2V617F-deleted) treated Jak2RL vs. Jak2RL/Tet2−/− mice at timed sacrifice (21 weeks; n ≥ 7 biological replicates per arm across two independent transplants; mean ± SEM). *, P ≤ 0.05; ***, P ≤ 0.001. I, Serial replating assay of plated MPN vs. tamoxifen (Jak2V617F-deleted) treated Jak2RL vs. Jak2RL/Tet2−/− bone marrow cells harvested at timed sacrifice 21 weeks and scored at day 8 after each plating (each sample plated in triplicate, representative of n = 2 independent experiments, mean ± SD). cGy, centigray; KI, knock-in; KO, knock-out; Lin-neg BM, lineage-negative bone marrow; trx, transplant.

References

    1. Levine RL, Pardanani A, Tefferi A, Gilliland DG. Role of JAK2 in the pathogenesis and therapy of myeloproliferative disorders. Nat Rev Cancer 2007;7:673–83. - PubMed
    1. Mullally A, Lane SW, Ball B, Megerdichian C, Okabe R, Al-Shahrour F, et al. . Physiological Jak2V617F expression causes a lethal myeloproliferative neoplasm with differential effects on hematopoietic stem and progenitor cells. Cancer Cell 2010;17:584–96. - PMC - PubMed
    1. Mullally A, Poveromo L, Schneider RK, Al-Shahrour F, Lane SW, Ebert BL. Distinct roles for long-term hematopoietic stem cells and erythroid precursor cells in a murine model of Jak2V617F-mediated polycythemia vera. Blood 2012;120:166–72. - PMC - PubMed
    1. Bhagwat N, Koppikar P, Keller M, Marubayashi S, Shank K, Rampal R, et al. . Improved targeting of JAK2 leads to increased therapeutic efficacy in myeloproliferative neoplasms. Blood 2014;123:2075–83. - PMC - PubMed
    1. Yan D, Hutchison RE, Mohi G. Critical requirement for Stat5 in a mouse model of polycythemia vera. Blood 2012;119:3539–49. - PMC - PubMed

Publication types